Professional Paper 1386–A
Select image for high resolution and Save to download 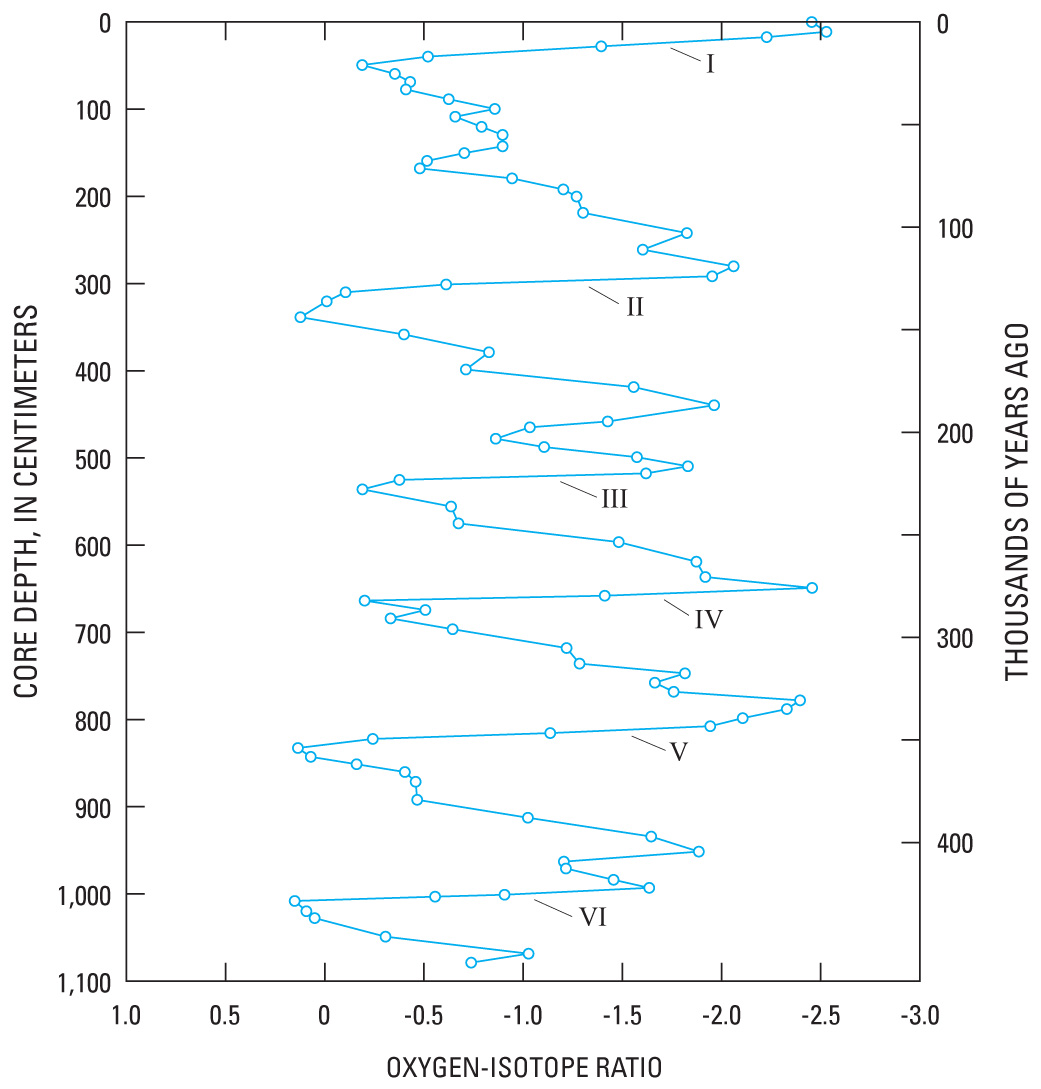 Figure 32. Variations in the oxygen-isotope ratio of a marine sediment core showing the 100,000-year cycles of glacials and interglacials. The curves record the slow onset of glaciation and six intervals of rapid deglaciation at the end (“termination”) of each cycle. Modified from Imbrie and Imbrie (1979, p. 157, fig. 38). |

![]() U.S. Department of the Interior |
U.S. Geological Survey
U.S. Department of the Interior |
U.S. Geological Survey
URL: http://pubsdata.usgs.gov/pubs/pp/p1386a/gallery2-fig32.html
Page Contact Information: GS Pubs Web Contact
Page Last Modified: Thursday, 01-Dec-2016 16:25:08 EST
