Professional Paper 1386–A
Select image for high resolution and Save to download 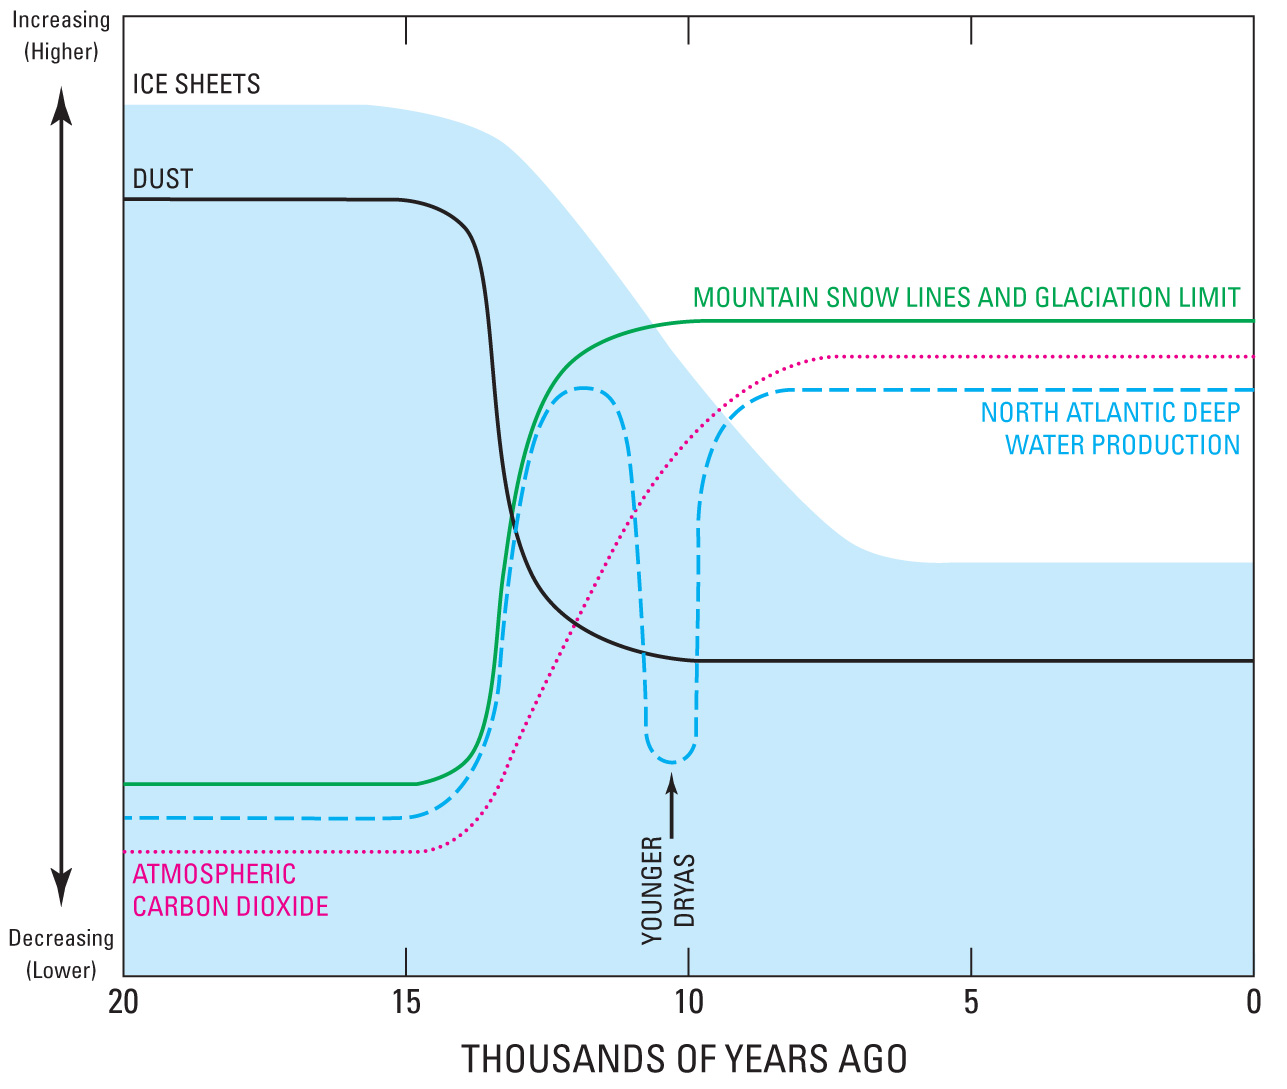 Figure 33. Schematic diagram showing some of the changes in the Earth System during the transition between the end of the Pleistocene Epoch and the beginning of the Holocene Epoch. These changes decreased dust in the Earth’s atmosphere, whereas CO2 concentration and production of deep water in the North Atlantic Ocean increased. Elevation of the snow line (and therefore the glaciation limit) in mountain ranges increased, signifying the retreat of mountain glaciers, of ice caps, and of snowfields and the melting of continental ice sheets in North America, Eurasia, and South America. A sudden short interval of cooling is indicated by the Younger Dryas. Modified from Broecker and Denton (1990). |

![]() U.S. Department of the Interior |
U.S. Geological Survey
U.S. Department of the Interior |
U.S. Geological Survey
URL: http://pubsdata.usgs.gov/pubs/pp/p1386a/gallery2-fig33.html
Page Contact Information: GS Pubs Web Contact
Page Last Modified: Thursday, 01-Dec-2016 16:25:09 EST
