Professional Paper 1386–A
Select image for high resolution and Save to download 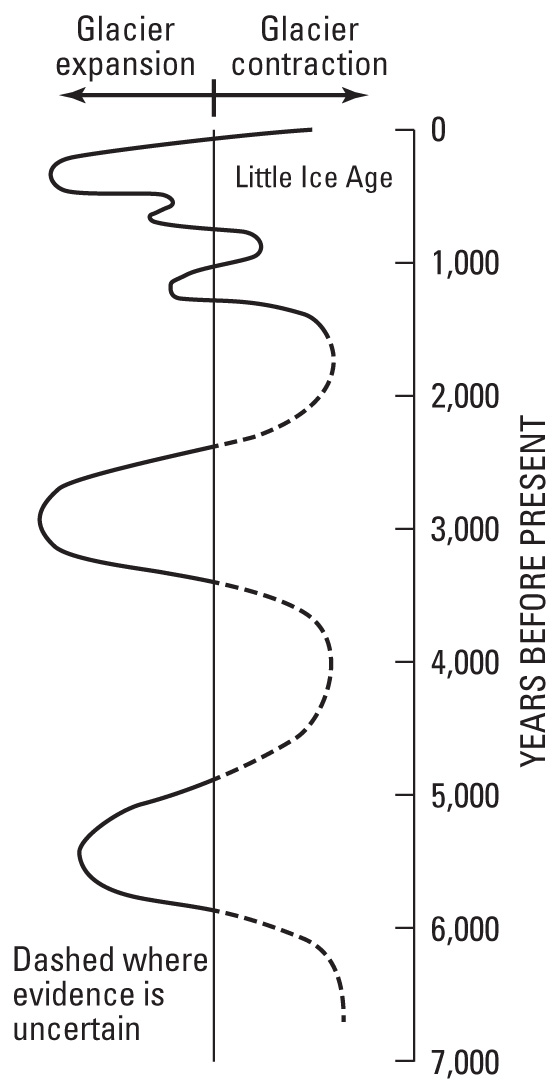 Figure 36. Schematic diagram of glacier fluctuations worldwide during the last 7,000 years of the Holocene Epoch. Modified from Sugden and John (1976, p. 124, figure 6.17). |

![]() U.S. Department of the Interior |
U.S. Geological Survey
U.S. Department of the Interior |
U.S. Geological Survey
URL: http://pubsdata.usgs.gov/pubs/pp/p1386a/gallery2-fig36.html
Page Contact Information: GS Pubs Web Contact
Page Last Modified: Thursday, 01-Dec-2016 16:25:10 EST
