Skip Links

USGS - science for a changing world

Professional Paper 1386–A

Chapter A–2 (Figure 38)

Return to Home

Return to figure gallery

Select image for high resolution and Save to download
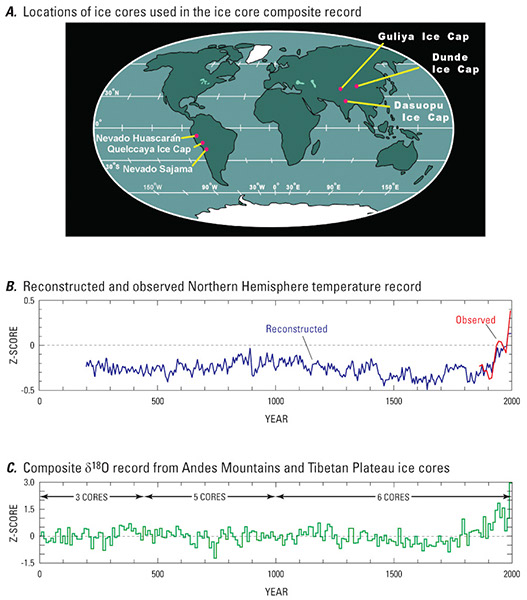
Figure 38.—A, Geographic location of ice cores used in the ice-core composite record. B, Northern Hemisphere temperature records. The ice-core reference period for B is 1961–1990. The blue line is a reconstruction of temperature from Jones and Mann (2004); the short red segment of the line depicts the meteorological observations compiled by Jones and Moberg (2003). C, Composite of decadal averages of the isotope δ18O from ice cores from the Andes Mountains and Tibetan Plateau during the past two millennia. The Z score is the standard deviation from its respective mean (Mosley-Thompson and others, 2006). The ice-core reference period for C is the 2,000 years preceding the 21st century.

Figure 38.A, Geographic location of ice cores used in the ice-core composite record. B, Northern Hemisphere temperature records. The ice-core reference period for B is 1961–1990. The blue line is a reconstruction of temperature from Jones and Mann (2004); the short red segment of the line depicts the meteorological observations compiled by Jones and Moberg (2003). C, Composite of decadal averages of the isotope δ18O from ice cores from the Andes Mountains and Tibetan Plateau during the past two millennia. The Z score is the standard deviation from its respective mean (Mosley-Thompson and others, 2006). The ice-core reference period for C is the 2,000 years preceding the 21st century.


Accessibility FOIA Privacy Policies and Notices

Take Pride in America logo USA.gov logo U.S. Department of the Interior | U.S. Geological Survey
URL: http://pubsdata.usgs.gov/pubs/pp/p1386a/gallery2-fig38.html
Page Contact Information: GS Pubs Web Contact
Page Last Modified: Thursday, 01-Dec-2016 16:25:11 EST