Professional Paper 1386–A
Select image for high resolution and Save to download 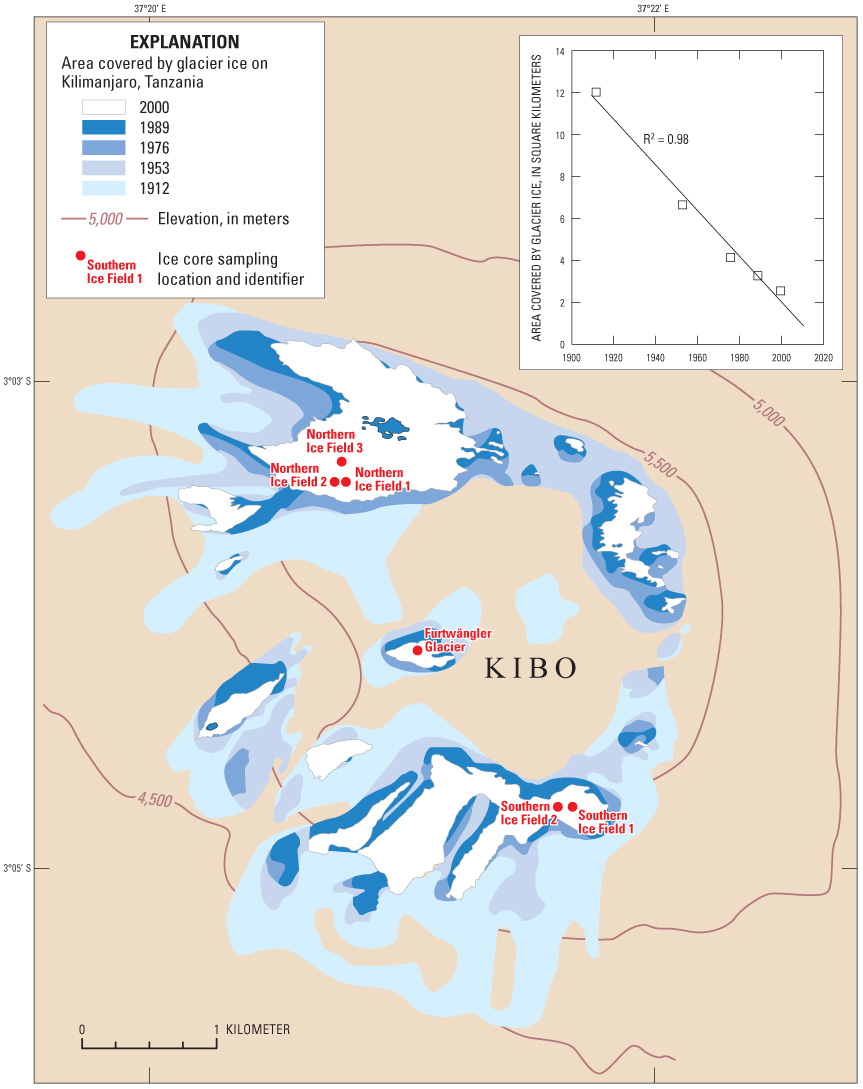 Figure 39. Outlines of the Kilimanjaro Ice Fields in 1912, 1953, 1976, 1989, and 2000. The inset graph shows a least-squares regression line plot of the 5 discrete years of area calculations and the nearly linear (R2, the coefficient of determination, is 0.98) decrease in ice area from 1912 to 2000. The red dots on the map indicate locations of ice-core sites, three from the Northern Ice Field, one from the Furtwängler Glacier, and two from the Southern Ice Field. See also Young and Hastenrath (1991) and Hastenrath and Greischar (1997). |

![]() U.S. Department of the Interior |
U.S. Geological Survey
U.S. Department of the Interior |
U.S. Geological Survey
URL: http://pubsdata.usgs.gov/pubs/pp/p1386a/gallery2-fig39.html
Page Contact Information: GS Pubs Web Contact
Page Last Modified: Thursday, 01-Dec-2016 16:25:12 EST
