Professional Paper 1386–A
Select image for high resolution and Save to download 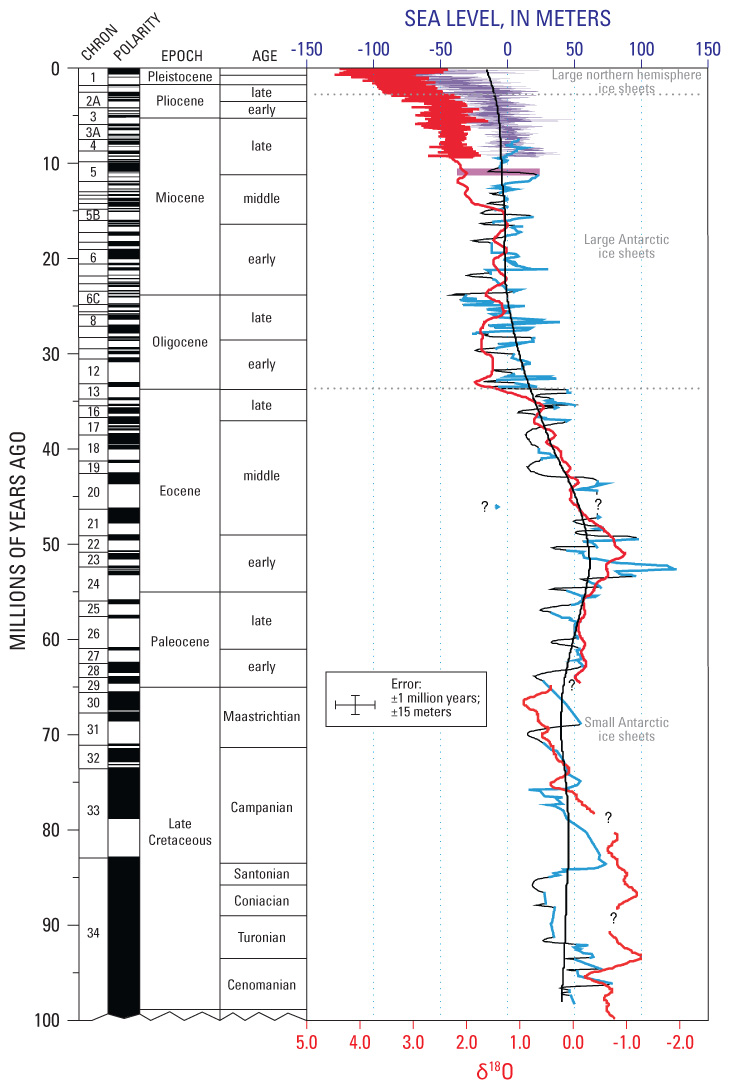 Figure 43. Variation in global sea level during the last 100 Ma (light blue and purple lines), from the Late Cretaceous of the Mesozoic Era through the Cenozoic Era to the present time. The red line is a benthic foraminiferal δ18O synthesis; the purple line is for the interval 0 to 7 Ma. Note the fluctuating decline in sea level (light blue, 7 to 100 Ma) after the peak in the early Eocene. Modified from Miller and others (2005, p. 1,295, fig. 3). |

![]() U.S. Department of the Interior |
U.S. Geological Survey
U.S. Department of the Interior |
U.S. Geological Survey
URL: http://pubsdata.usgs.gov/pubs/pp/p1386a/gallery2-fig43.html
Page Contact Information: GS Pubs Web Contact
Page Last Modified: Thursday, 01-Dec-2016 16:25:14 EST
