Select image for high resolution and Save to download

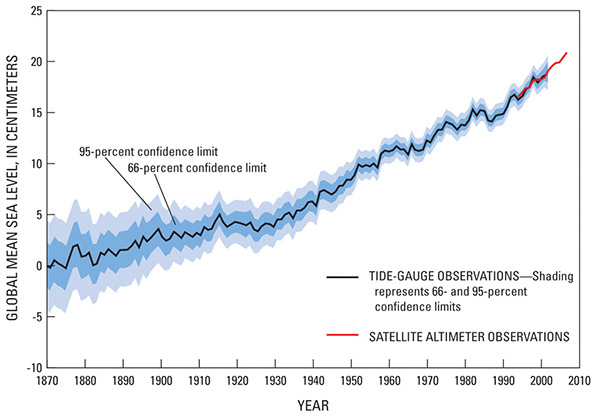
Figure 47. Globally averaged rise in sea level from tide-gauge observations (black line) and from satellite altimetry data (from sensors on Topex/Poseidon and Jason-1 satellites) (red line). Modified from Bentley and others (2007, p. 156, fig. 6C.3); original source is Church and White (2006). |