Professional Paper 1386–A
Select image for high resolution and Save to download 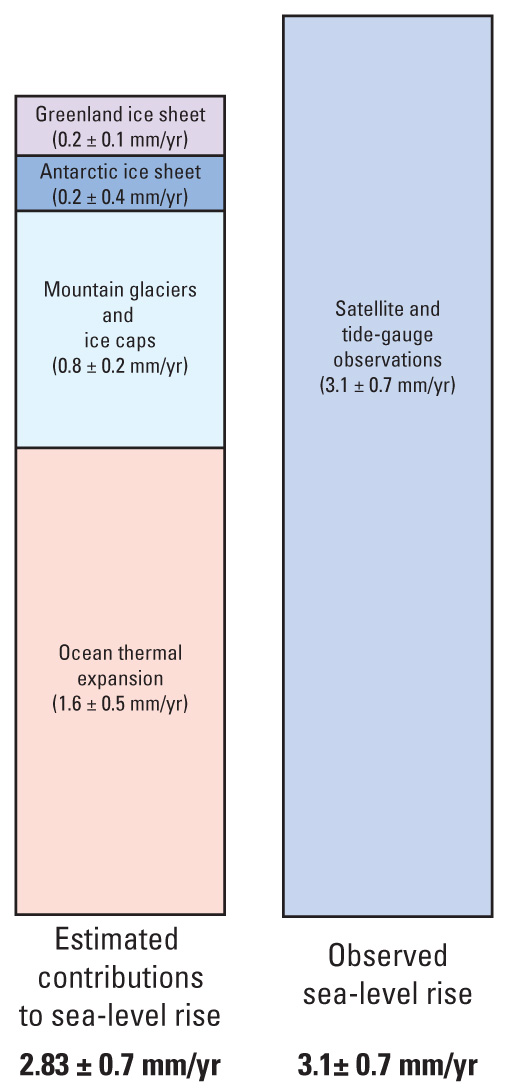 Figure 48. Estimated sources of global rise in sea level from 1993 through 2003, estimated from ocean thermal expansion (steric rise) and as meltwater from non-ice-sheet glaciers and from the Greenland and Antarctic ice sheets (2.83±0.7 mm a-1). Satellite data and tide-gauge observations indicate a higher mean rise (3.1±0.7 mm a-1) during the same period. Modified from Bentley and others (2007, p. 157, fig. 6C.4). |

![]() U.S. Department of the Interior |
U.S. Geological Survey
U.S. Department of the Interior |
U.S. Geological Survey
URL: http://pubsdata.usgs.gov/pubs/pp/p1386a/gallery2-fig48.html
Page Contact Information: GS Pubs Web Contact
Page Last Modified: Thursday, 01-Dec-2016 16:25:16 EST
