Professional Paper 1386–A
Select image for high resolution and Save to download 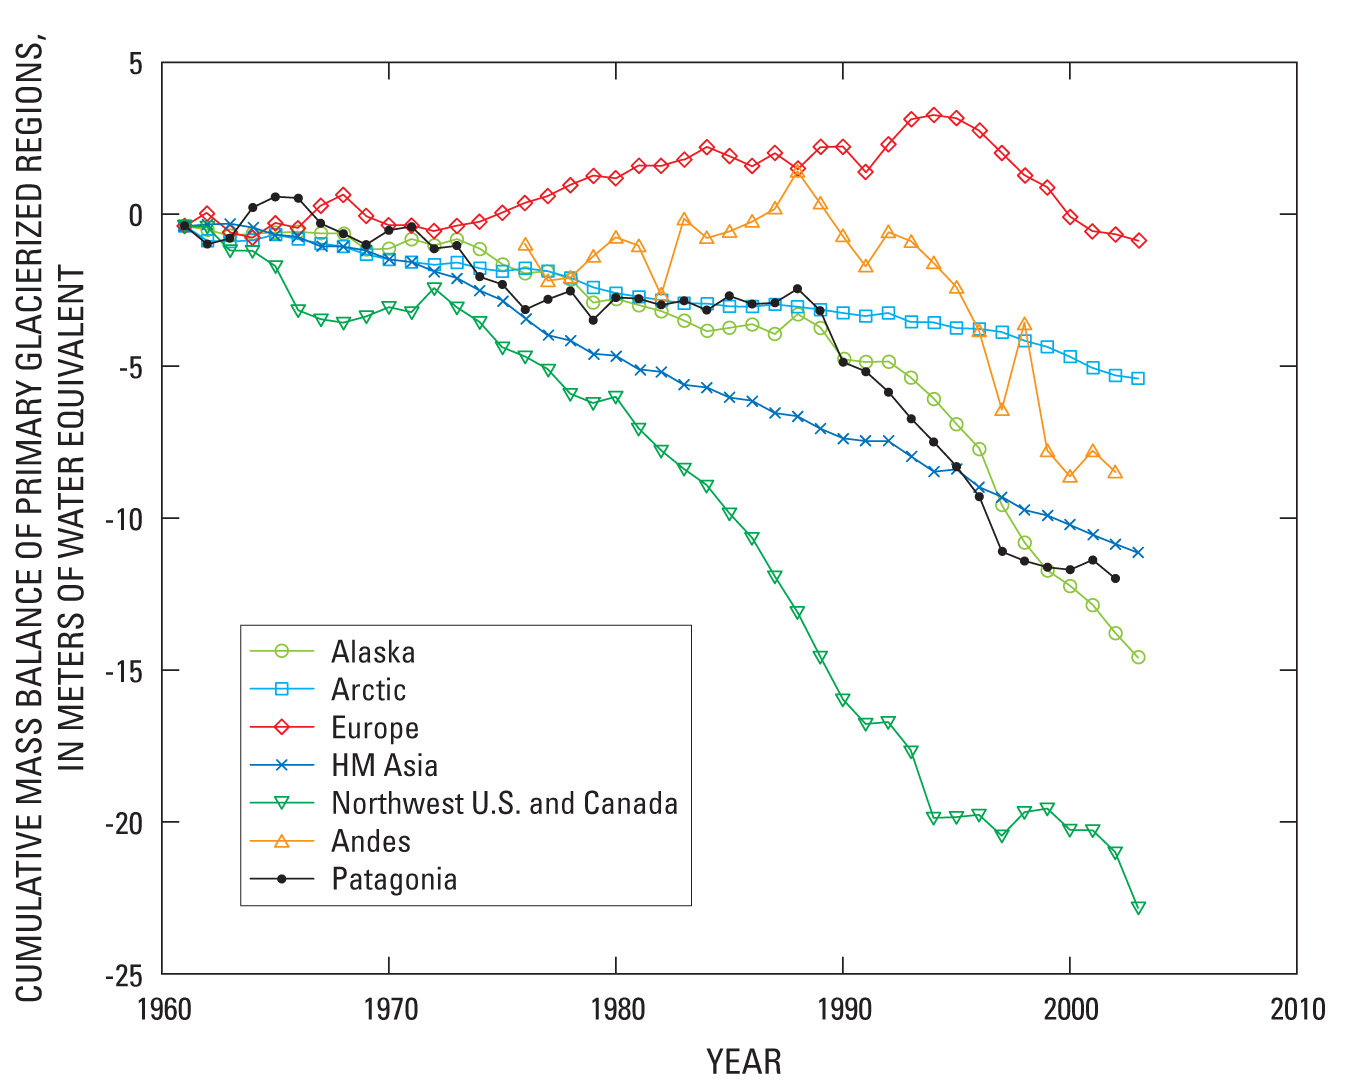 Figure 53. Cumulative mass balances calculated for large glacierized regions. For these calculations, we used the time series of mass balance for all glaciers—more than 300 from time to time and from 30 to 100 with multiyear records (see http://www.nsidc.org). We weighted the annual mass-balance data for individual glaciers by their surface area and then by the aggregate surface area of 49 primary glacier systems (20 of them are shown in fig. 52). By the end of the 1980s, and more clearly during the 1990s, these cumulative curves for large glacierized regions show a significant shift toward accelerated loss of mass. |

![]() U.S. Department of the Interior |
U.S. Geological Survey
U.S. Department of the Interior |
U.S. Geological Survey
URL: http://pubsdata.usgs.gov/pubs/pp/p1386a/gallery2-fig53.html
Page Contact Information: GS Pubs Web Contact
Page Last Modified: Thursday, 01-Dec-2016 16:25:18 EST
