Professional Paper 1386–A
Select image for high resolution and Save to download 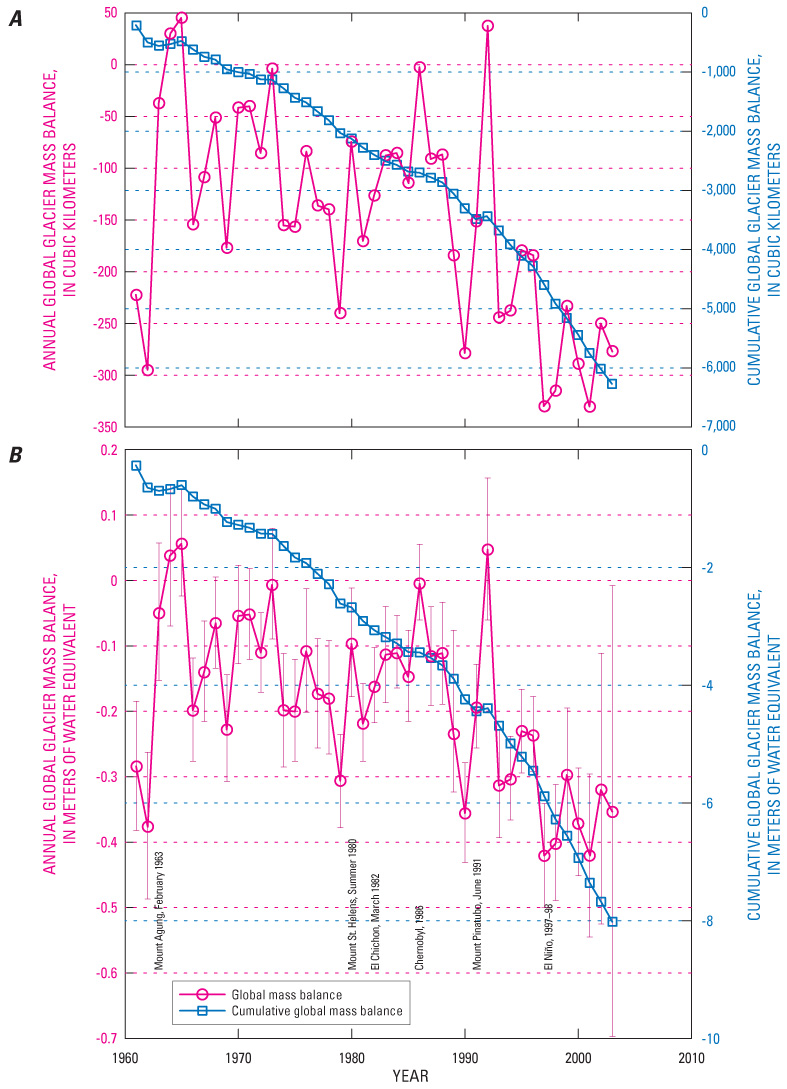 Figure 54. A, Annual variability in global mass balance of glaciers and cumulative mass-balance values globally. B, Change in volume and variability computed for the worldwide system of mountain glaciers and subpolar ice caps, which has an aggregate area of 785,000 km2. The results of direct mass-balance observations on 300 glaciers worldwide are averaged by area of individual glaciers—49 primary systems, 13 larger regions, 7 continental-size regions, and globally—to construct the single global curve. Vertical bars on B are estimated standard errors. |

![]() U.S. Department of the Interior |
U.S. Geological Survey
U.S. Department of the Interior |
U.S. Geological Survey
URL: http://pubsdata.usgs.gov/pubs/pp/p1386a/gallery2-fig54.html
Page Contact Information: GS Pubs Web Contact
Page Last Modified: Thursday, 01-Dec-2016 16:25:18 EST
