Professional Paper 1386–A
Select image for high resolution and Save to download 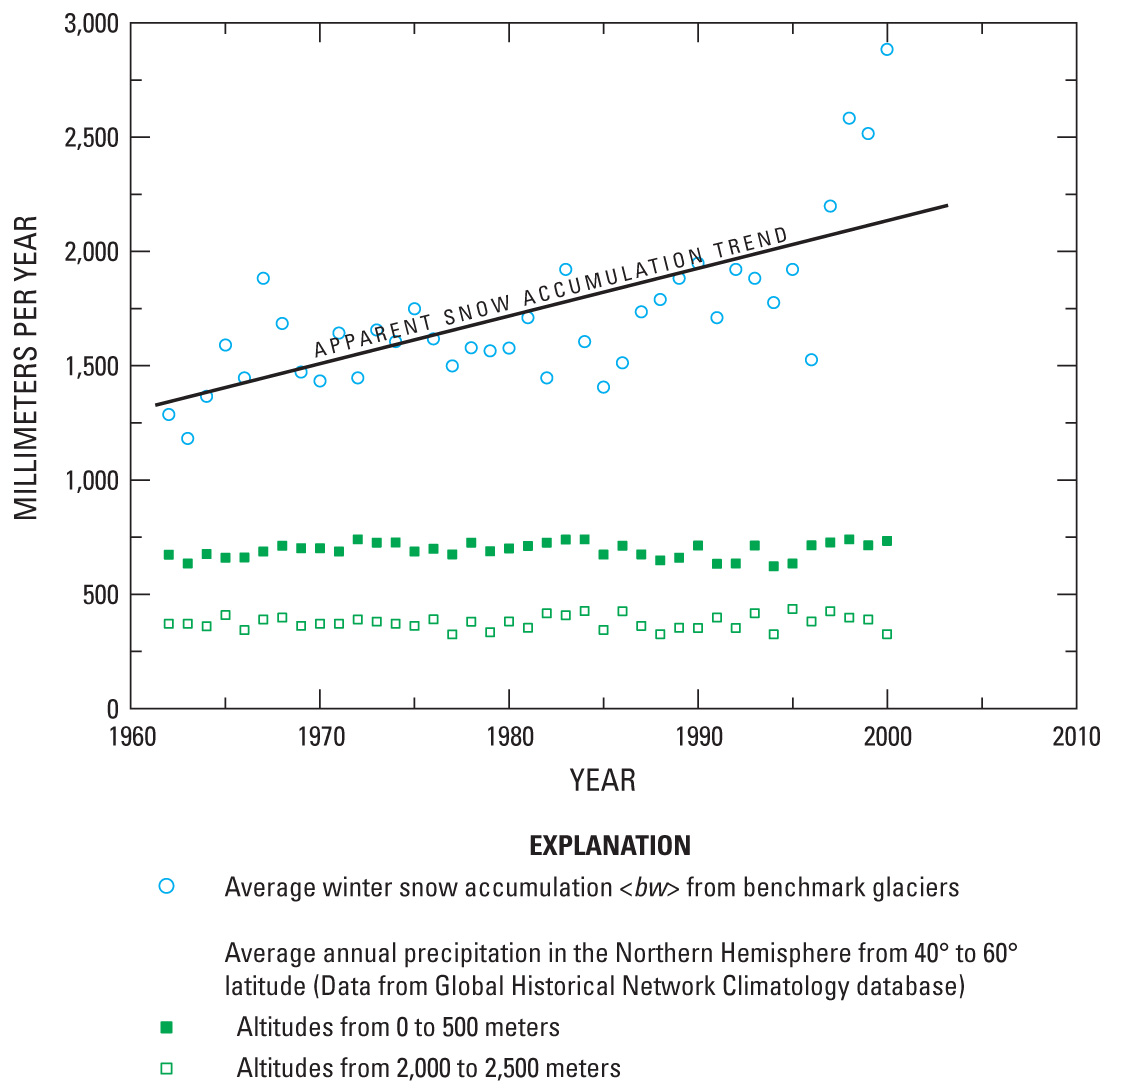 Figure 59. Winter snow accumulation, bw, from benchmark glaciers (averaged for all available observations; see Dyurgerov, 2002), and annual precipitation, <Pa>, averaged for Northern Hemisphere latitude 40° to 60°, at two altitudinal ranges, 0 to 500 m and 2,000 to 2,500 m. From the Global Historical Network Climatology database. The apparent trend from 1960 to 2000 indicates winter snow accumulation sharply increasing from 1998 to 2000. |

![]() U.S. Department of the Interior |
U.S. Geological Survey
U.S. Department of the Interior |
U.S. Geological Survey
URL: http://pubsdata.usgs.gov/pubs/pp/p1386a/gallery2-fig59.html
Page Contact Information: GS Pubs Web Contact
Page Last Modified: Thursday, 01-Dec-2016 16:25:21 EST
