Professional Paper 1386–A
Select image for high resolution and Save to download 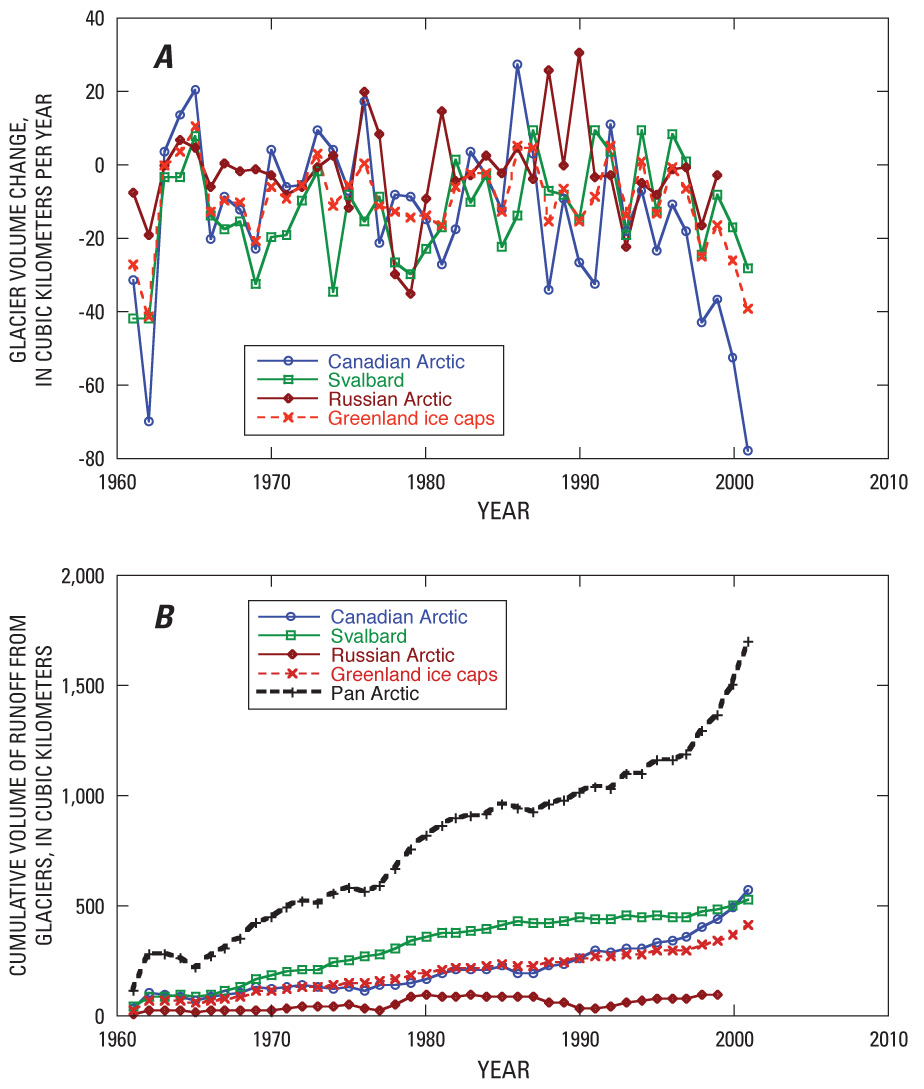 Figure 69. A, Change in volume of glaciers, calculated for large Arctic archipelagoes during the study period from 1960 to 2010. B, Cumulative values of the annual contribution of runoff during the study period from 1960 to 2010 for the same glacier areas. |

![]() U.S. Department of the Interior |
U.S. Geological Survey
U.S. Department of the Interior |
U.S. Geological Survey
URL: http://pubsdata.usgs.gov/pubs/pp/p1386a/gallery2-fig69.html
Page Contact Information: GS Pubs Web Contact
Page Last Modified: Thursday, 01-Dec-2016 16:25:27 EST
