Select image for high resolution and Save to download

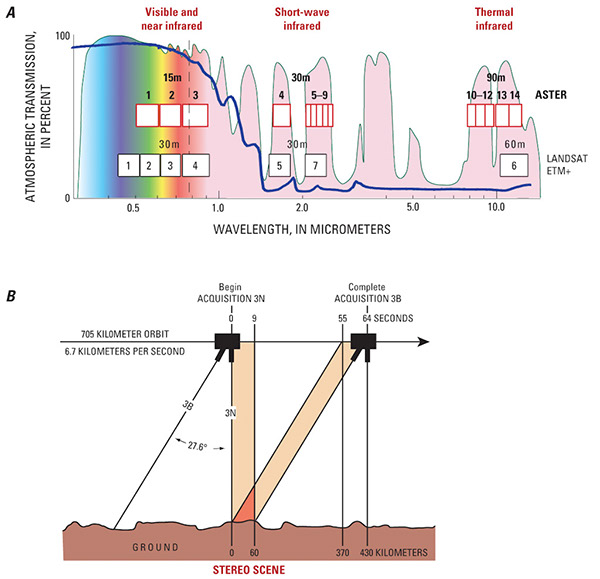
Figure 75. A, Advanced Spaceborne Thermal Emission and Reflection Radiometer (ASTER) spectral bands, for comparison with Landsat Enhanced Thematic Mapper (ETM+). The rectangular boxes (red: ASTER; black: ETM+) indicate the sensor channels, with their respective spatial resolution indicated above the boxes. The superimposed colored curve represents the atmospheric transmission in percent dependency on wavelength. The vertical dashed line marks the approximate margin of long-wavelength visible light. Abbreviations for bands of the spectrum: VNIR (visible and near infrared), SWIR (short-wave infrared), and TIR (thermal infrared). B, ASTER stereo geometry and timing of the nadir-band 3N and the back-looking sensor 3B. An ASTER nadir scene, approximately 60 km in length, and a correspondent scene looking back by 27.6° off-nadir angle and acquired about 60 seconds later together form a stereo scene. Modified from Kääb and others (2003, p. 44, figs. 1, 2). |