Professional Paper 1386–A
Select image for high resolution and Save to download 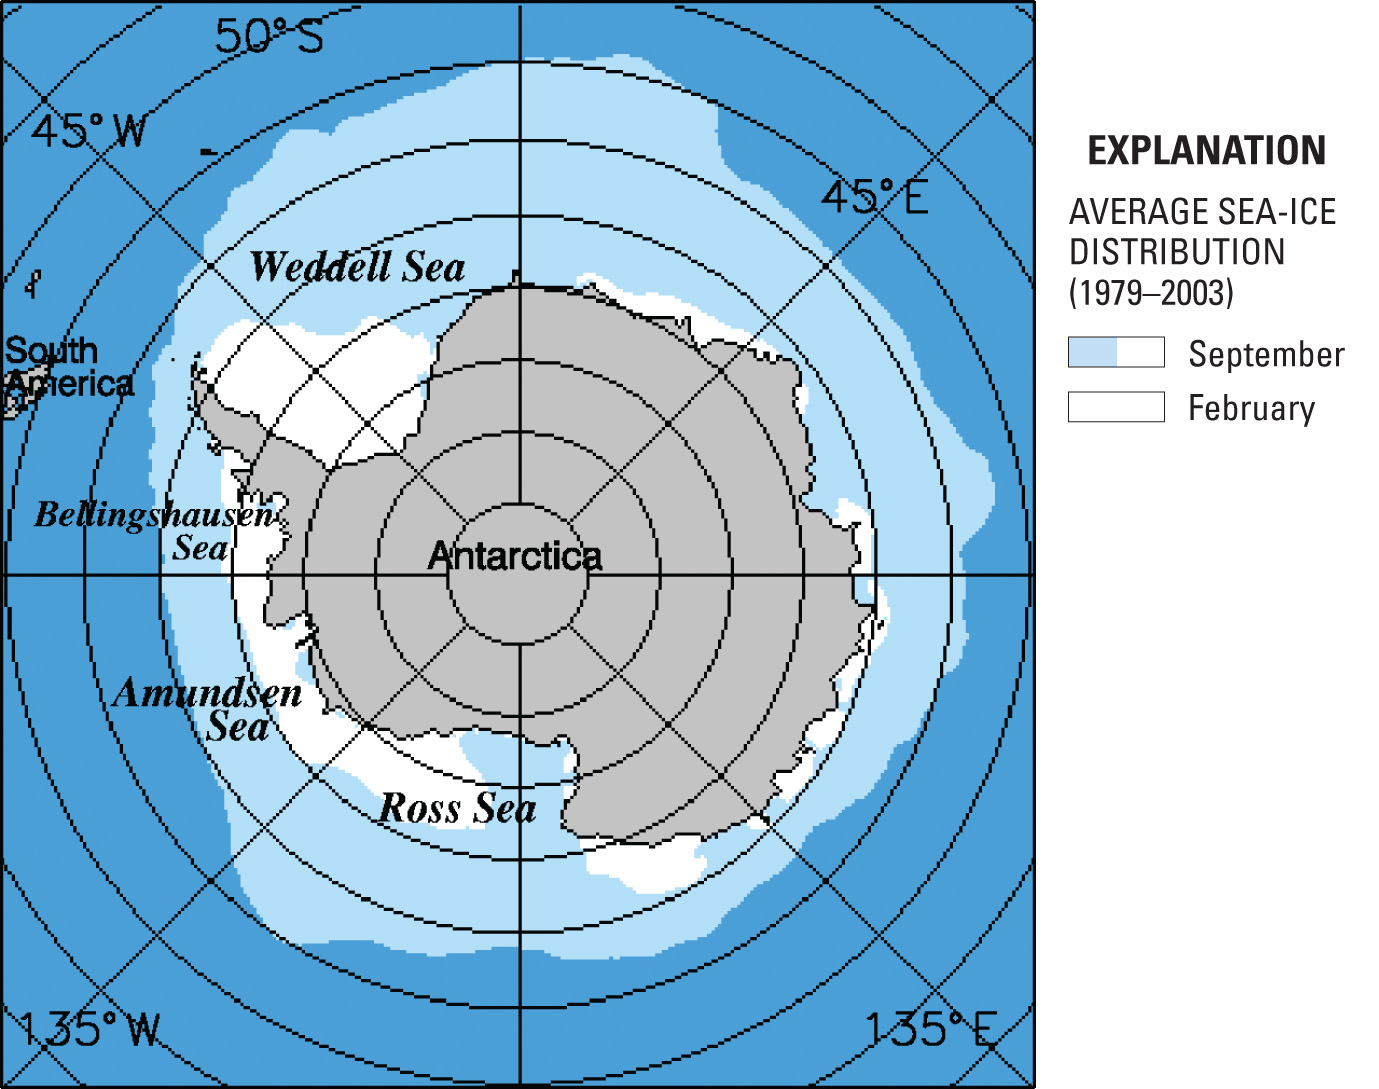 Figure 2. North polar location map and monthly sea-ice distribution in March (white and light blue) and September (white), averaged for the 25-year period from 1979 to 2003. The sea-ice distributions are derived from satellite data discussed in the “Annual Cycle of Sea Ice” section. |

![]() U.S. Department of the Interior |
U.S. Geological Survey
U.S. Department of the Interior |
U.S. Geological Survey
URL: http://pubsdata.usgs.gov/pubs/pp/p1386a/gallery4-fig02.html
Page Contact Information: GS Pubs Web Contact
Page Last Modified: Thursday, 01-Dec-2016 16:25:43 EST
