Professional Paper 1386–A
Select image for high resolution and Save to download 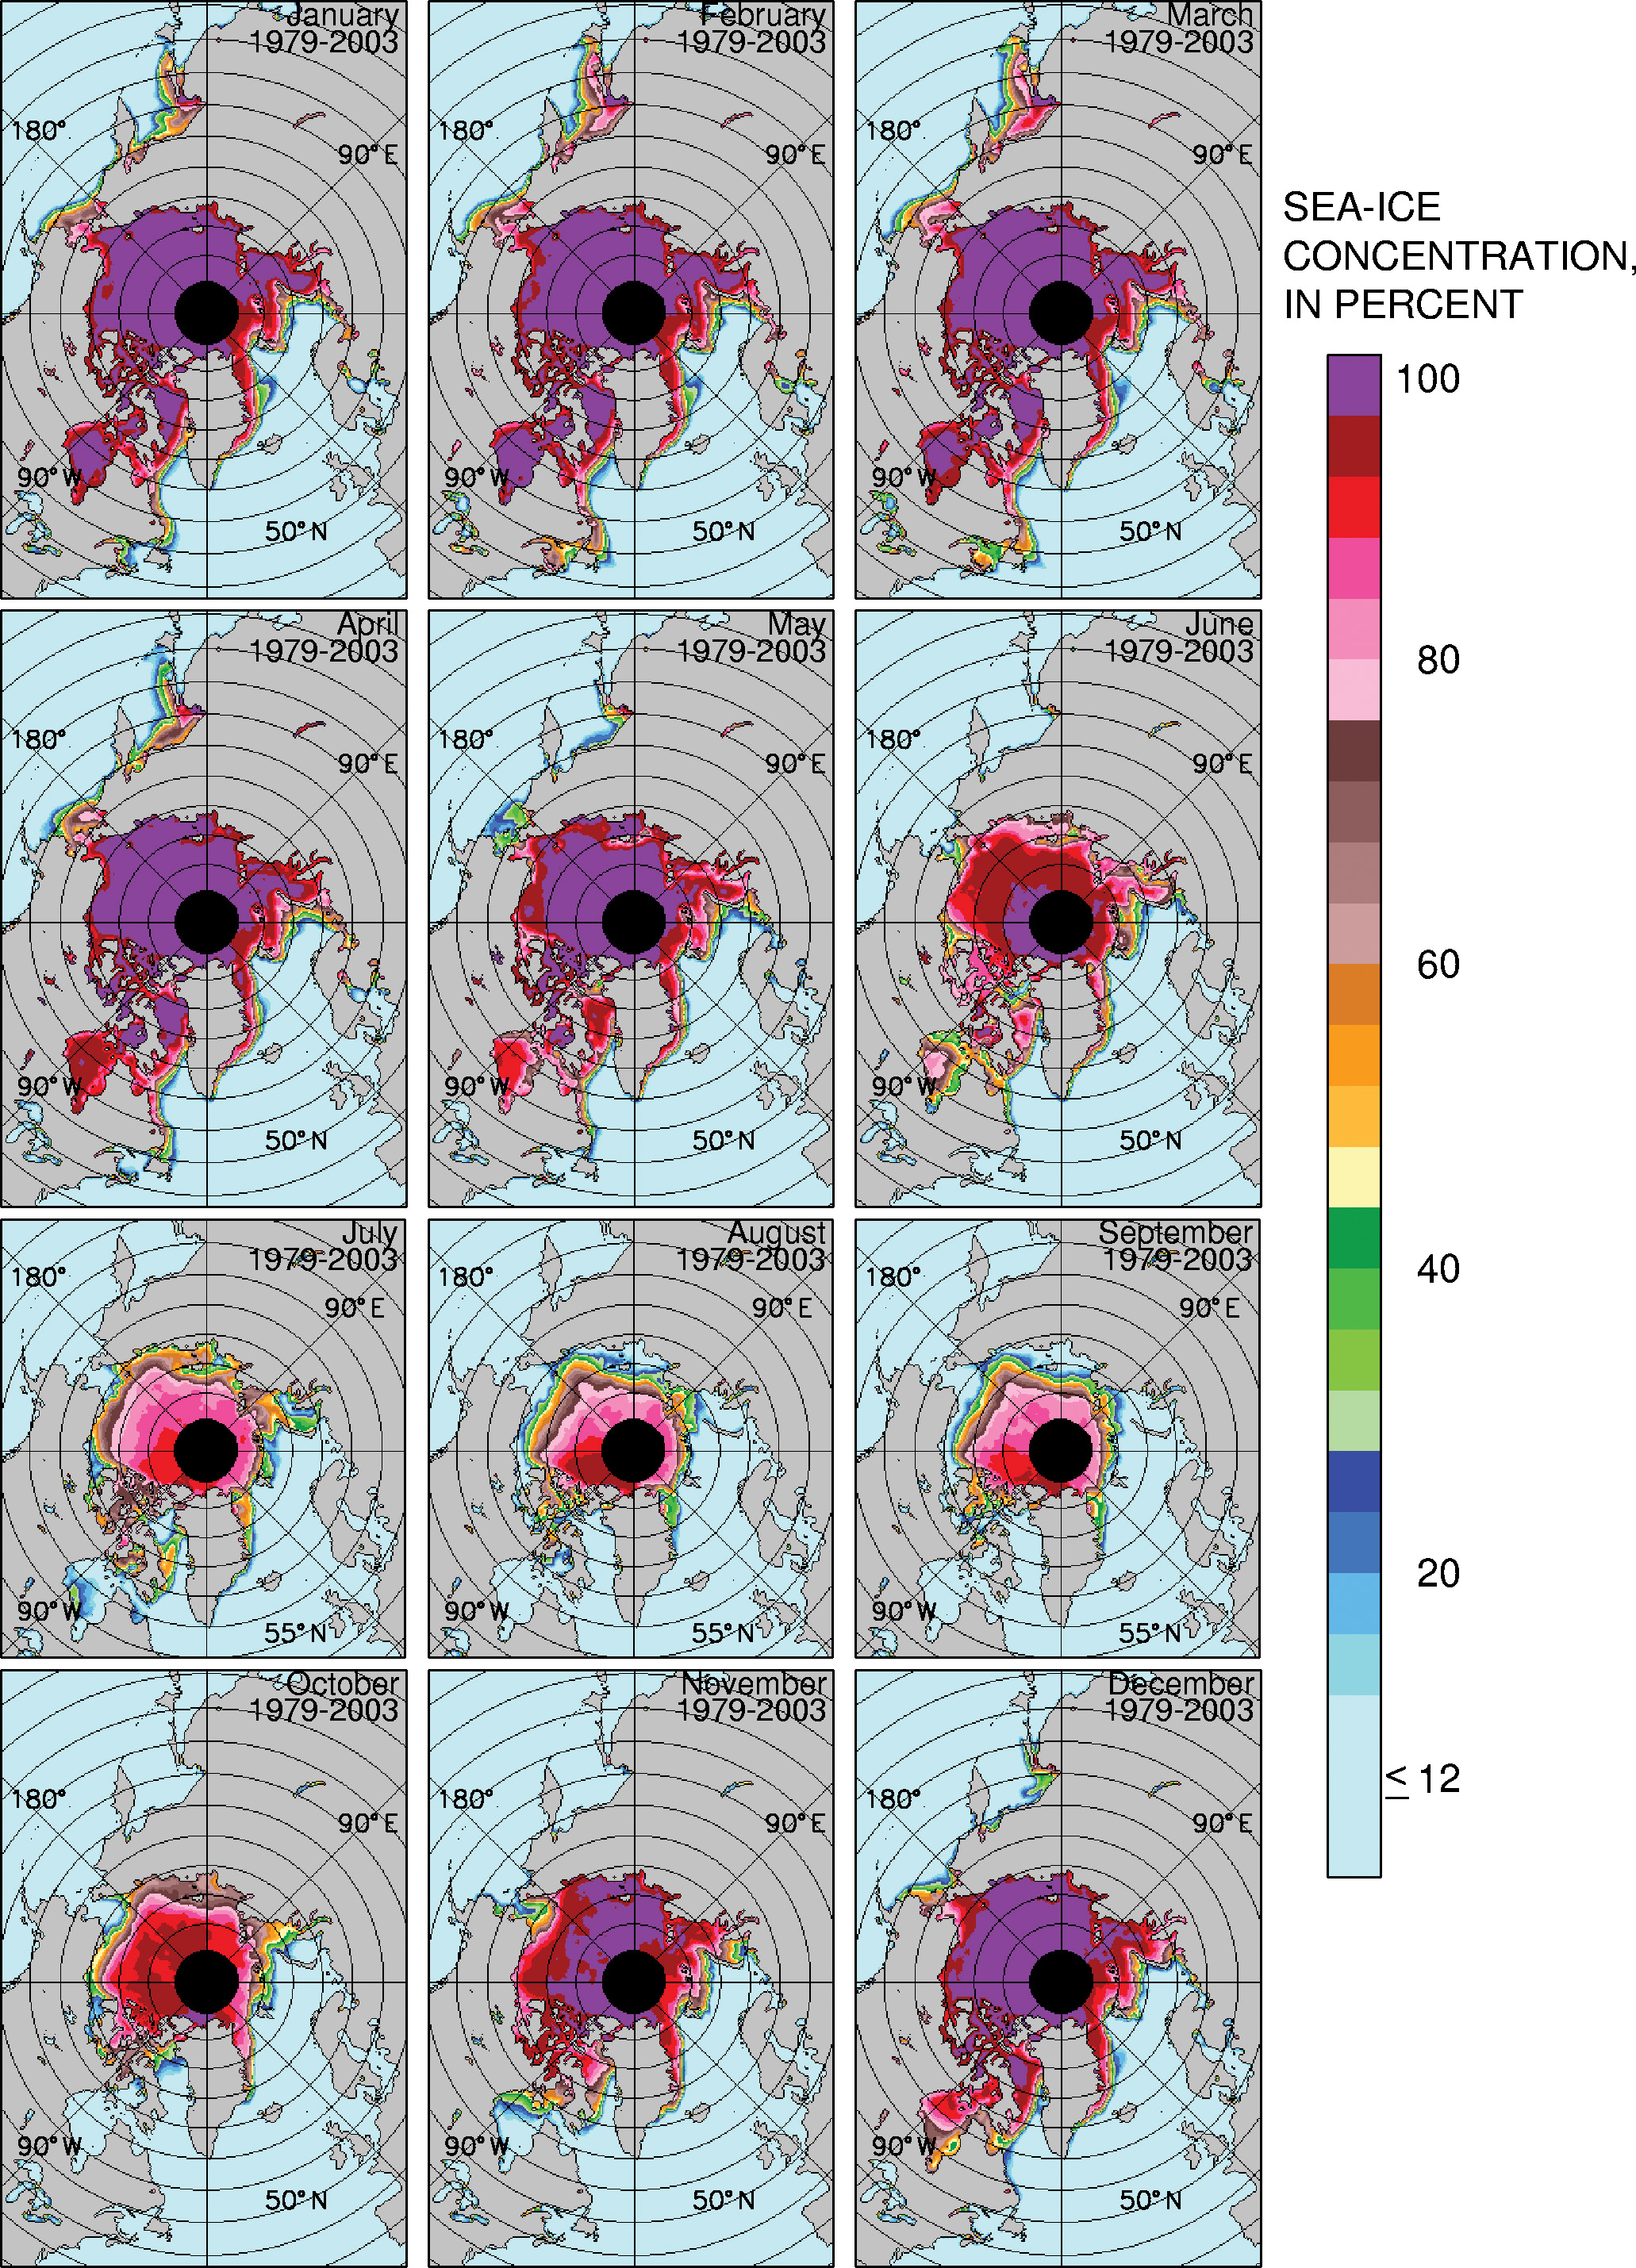 Figure 7. Monthly average sea-ice concentrations in the Northern Hemisphere for January–December, averaged for the 25-year period from 1979 to 2003. The sea-ice concentrations are derived from data from NASA’s Nimbus 7 Scanning Multichannel Microwave Radiometer (SMMR) and the Defense Meteorological Satellite Program (DMSP) Special Sensor Microwave Imager (SSMI). |

![]() U.S. Department of the Interior |
U.S. Geological Survey
U.S. Department of the Interior |
U.S. Geological Survey
URL: http://pubsdata.usgs.gov/pubs/pp/p1386a/gallery4-fig07.html
Page Contact Information: GS Pubs Web Contact
Page Last Modified: Thursday, 01-Dec-2016 16:25:45 EST
