Professional Paper 1386–A
Select image for high resolution and Save to download 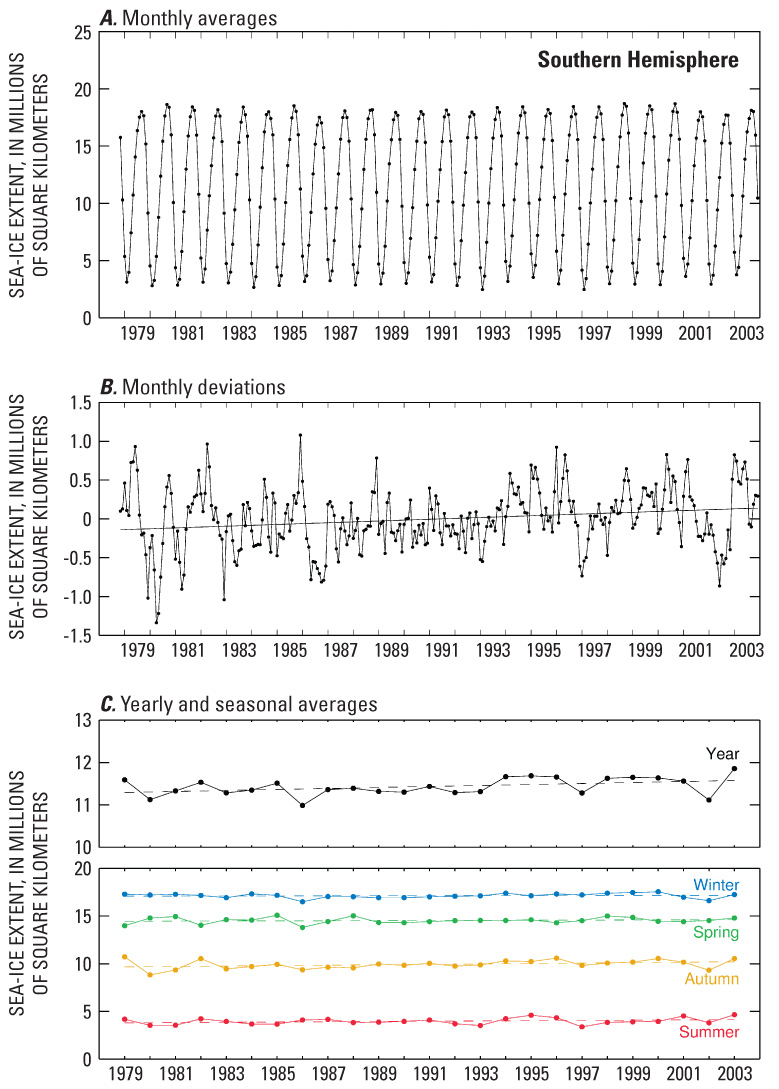 Figure 12. A, Monthly average sea-ice extents in the Southern Hemisphere, November 1978–December 2003. B, Deviations in monthly sea-ice extents in the Southern Hemisphere, November 1978–December 2003. C, Yearly and seasonal average sea-ice extents in the Southern Hemisphere, 1979–2003. Summer is averaged for January–March; autumn is averaged for April–June; winter is averaged for July–September; and spring is averaged for October–December. All values are derived from data from NASA’s Nimbus 7 Scanning Multichannel Microwave Radiometer (SMMR) and the Defense Meteorological Satellite Program (DMSP) Special Sensor Microwave Imager (SSMI). (Updated from Zwally and others, 2002.) |

![]() U.S. Department of the Interior |
U.S. Geological Survey
U.S. Department of the Interior |
U.S. Geological Survey
URL: http://pubsdata.usgs.gov/pubs/pp/p1386a/gallery4-fig12.html
Page Contact Information: GS Pubs Web Contact
Page Last Modified: Thursday, 01-Dec-2016 16:25:47 EST
