Professional Paper 1386–A
Select image for high resolution and Save to download 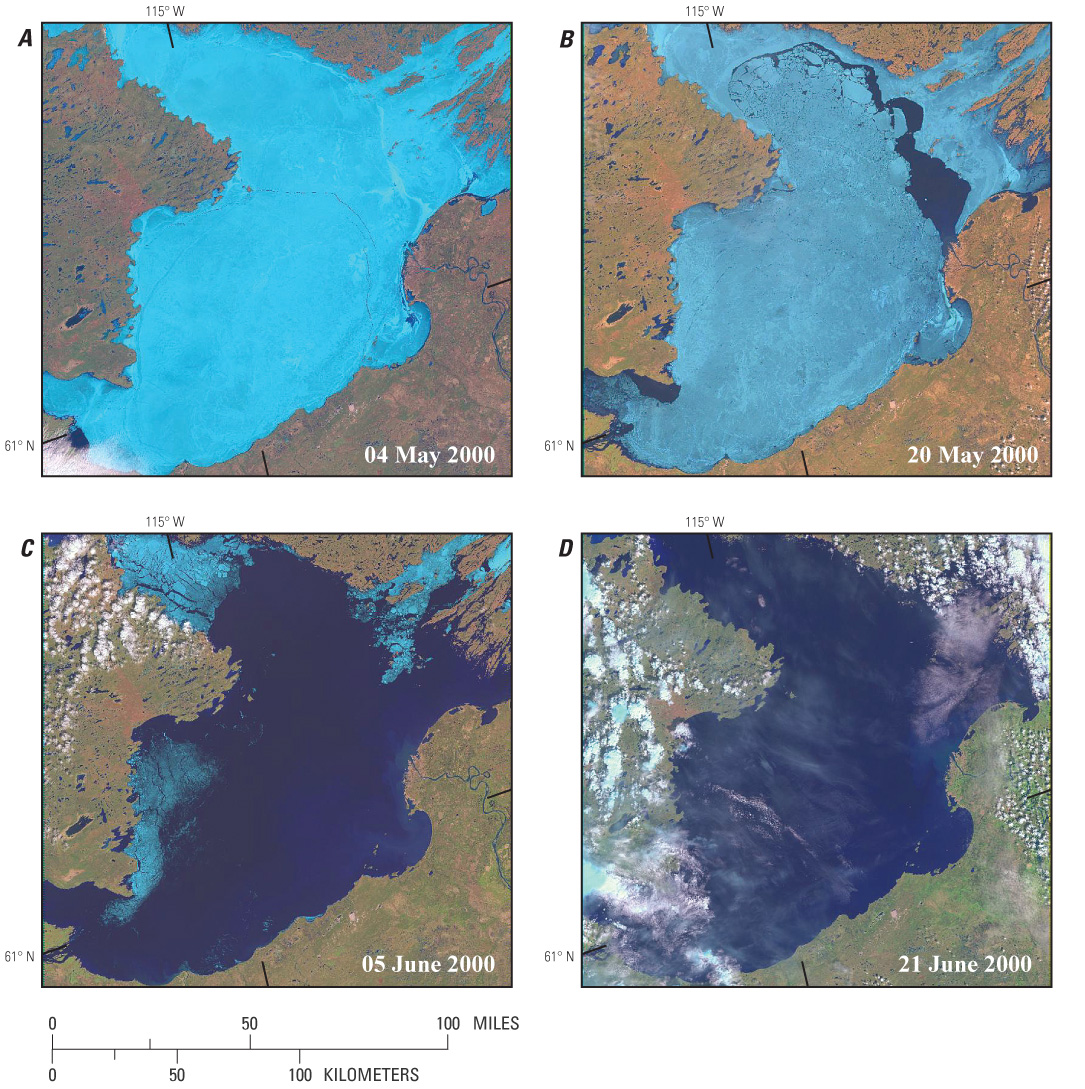 Figure 21. Landsat-7 ETM+ (bands 3, 4, 5) images show break-up on Great Slave Lake (lat 61.46°N., long 114.60°W.), Northwest Territories, Canada, in spring 2000: A, 4 May, B, 20 May, C, 5 June, and D, 21 June. The fracturing, weakening, and shrinkage of the ice are evident, as is the complete disappearance of ice from numerous smaller lakes long before Great Slave Lake was completely ice free. Each image covers an area of 185 km by 185 km on the ground. |

![]() U.S. Department of the Interior |
U.S. Geological Survey
U.S. Department of the Interior |
U.S. Geological Survey
URL: http://pubsdata.usgs.gov/pubs/pp/p1386a/gallery4-fig21.html
Page Contact Information: GS Pubs Web Contact
Page Last Modified: Thursday, 01-Dec-2016 16:25:53 EST
