Professional Paper 1386–A
Select image for high resolution and Save to download 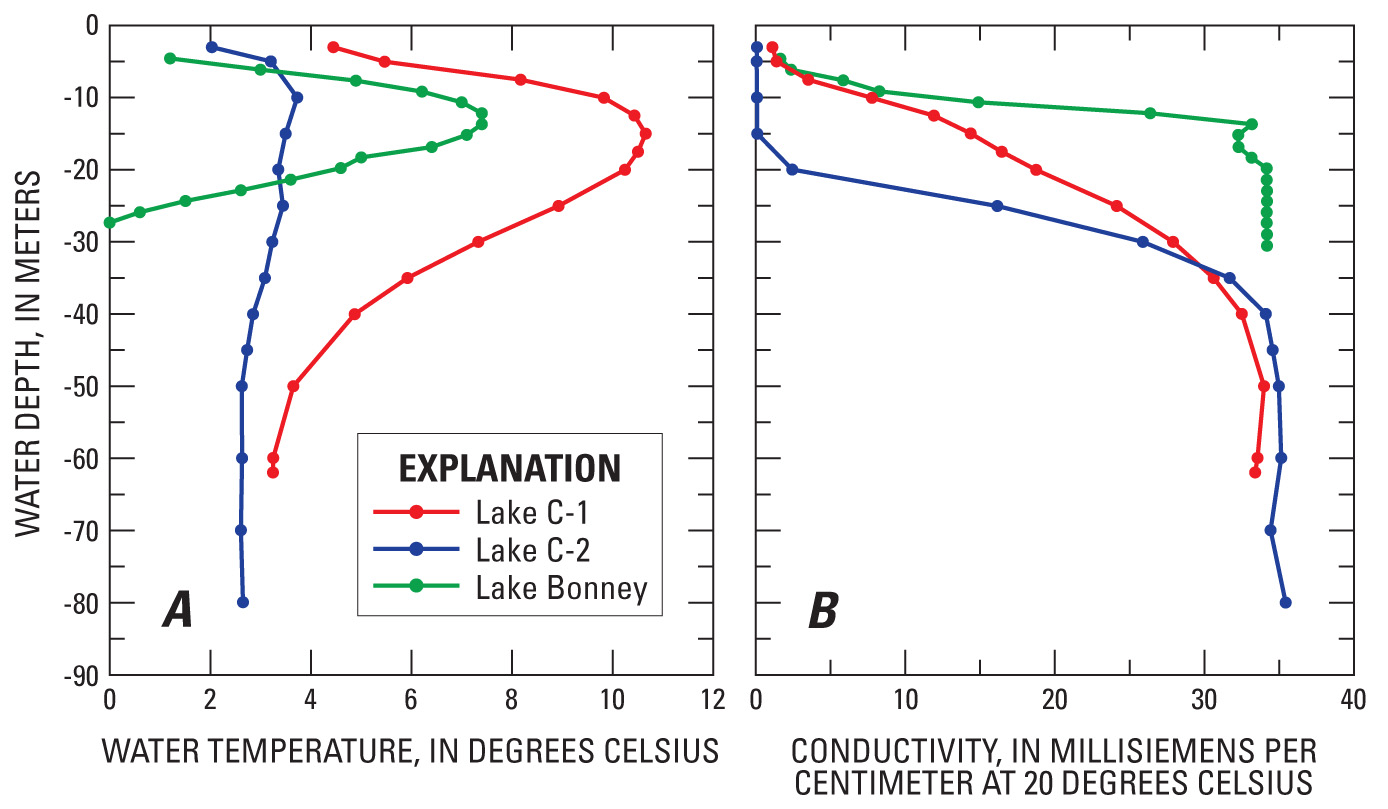 Figure 22. A, Temperature, and B, conductivity profiles in Lakes C-1 and C-2, Ellesmere Island, Nunavut, Canada, May 1985, and Lake Bonney, Taylor Valley, Antarctica, January 1963 (From Shirtcliffe and Benseman, 1964). For comparative purposes, the deepest water samples at Lakes C-1 and C-2 have salinity values of 27.4 PSU (Practical Salinity Units) and 29.3 PSU, respectively. The Lake Bonney conductivity data (Shirtcliffe and Benseman published only conductivity values) are shown as 50 percent of actual values for easier comparison with the data for Lakes C-1 and C-2. |

![]() U.S. Department of the Interior |
U.S. Geological Survey
U.S. Department of the Interior |
U.S. Geological Survey
URL: http://pubsdata.usgs.gov/pubs/pp/p1386a/gallery4-fig22.html
Page Contact Information: GS Pubs Web Contact
Page Last Modified: Thursday, 01-Dec-2016 16:25:53 EST
