Professional Paper 1386–A
Select image for high resolution and Save to download 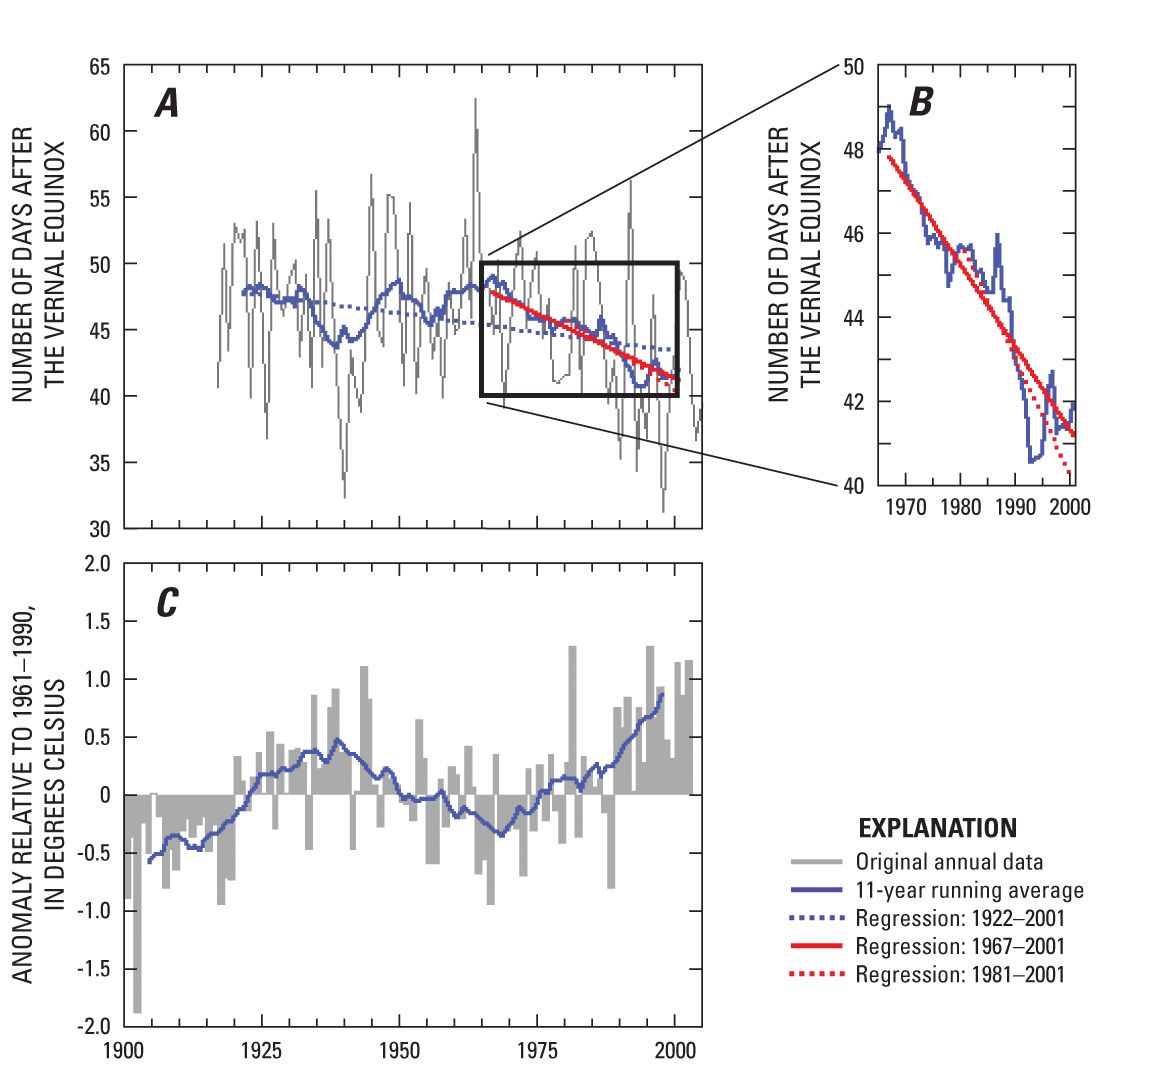 Figure 28. The Nenana Ice Classic record of break-up on the Tanana River, Alaska: A, 1917–2004; B, 1967–2004; and C, mean annual air temperature anomalies in the Arctic, 1900–2003. Break-up is shown as number of days after the vernal equinox in order to avoid bias due to leap years (Sagarin, 2001). The area in the box in A is enlarged in B. The original break-up data were obtained from the Nenana Ice Classic Web site (http://www.nenanaakiceclassic.com/). The break-up data and the air temperature anomaly data have each been smoothed with an 11-year running average filter. (See also table 2.) |

![]() U.S. Department of the Interior |
U.S. Geological Survey
U.S. Department of the Interior |
U.S. Geological Survey
URL: http://pubsdata.usgs.gov/pubs/pp/p1386a/gallery4-fig28.html
Page Contact Information: GS Pubs Web Contact
Page Last Modified: Thursday, 01-Dec-2016 16:25:56 EST
