Professional Paper 1386–A
Select image for high resolution and Save to download 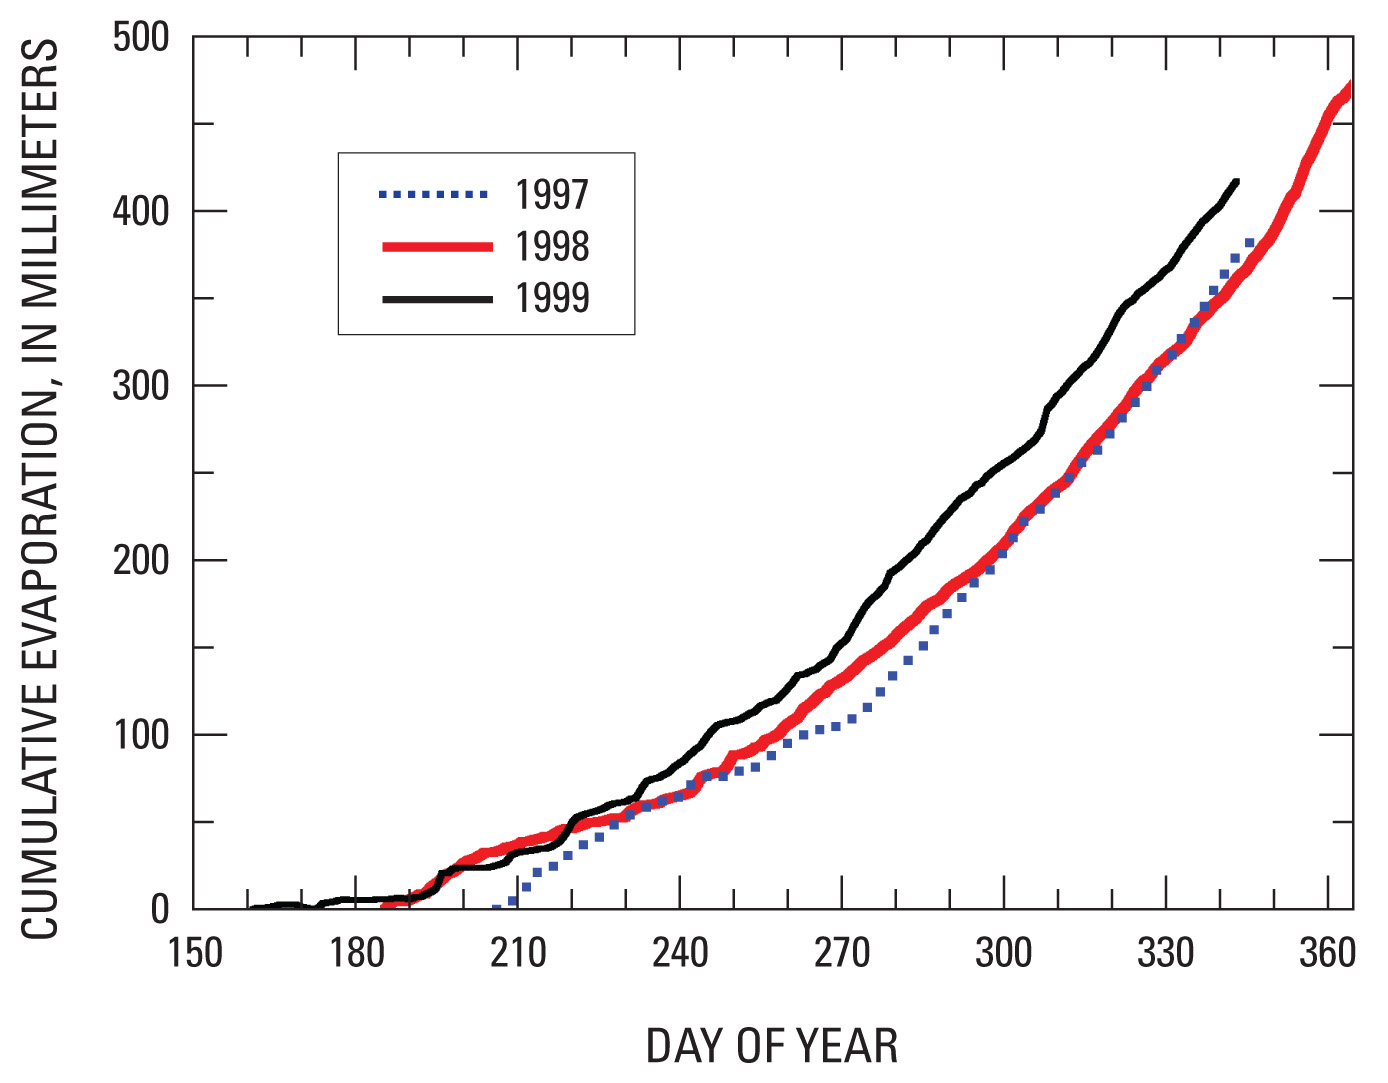 Figure 29. Measured annual cumulative evaporation from Great Slave Lake for 1997, 1998, and 1999. Each curve begins at break-up and ends at freeze-up. The graph shows a longer open-water season in 1998 than in other years associated with the 1998 El Niño, which caused earlier break-up and later freeze-up. |

![]() U.S. Department of the Interior |
U.S. Geological Survey
U.S. Department of the Interior |
U.S. Geological Survey
URL: http://pubsdata.usgs.gov/pubs/pp/p1386a/gallery4-fig29.html
Page Contact Information: GS Pubs Web Contact
Page Last Modified: Thursday, 01-Dec-2016 16:25:57 EST
