Professional Paper 1386–A
Select image for high resolution and Save to download 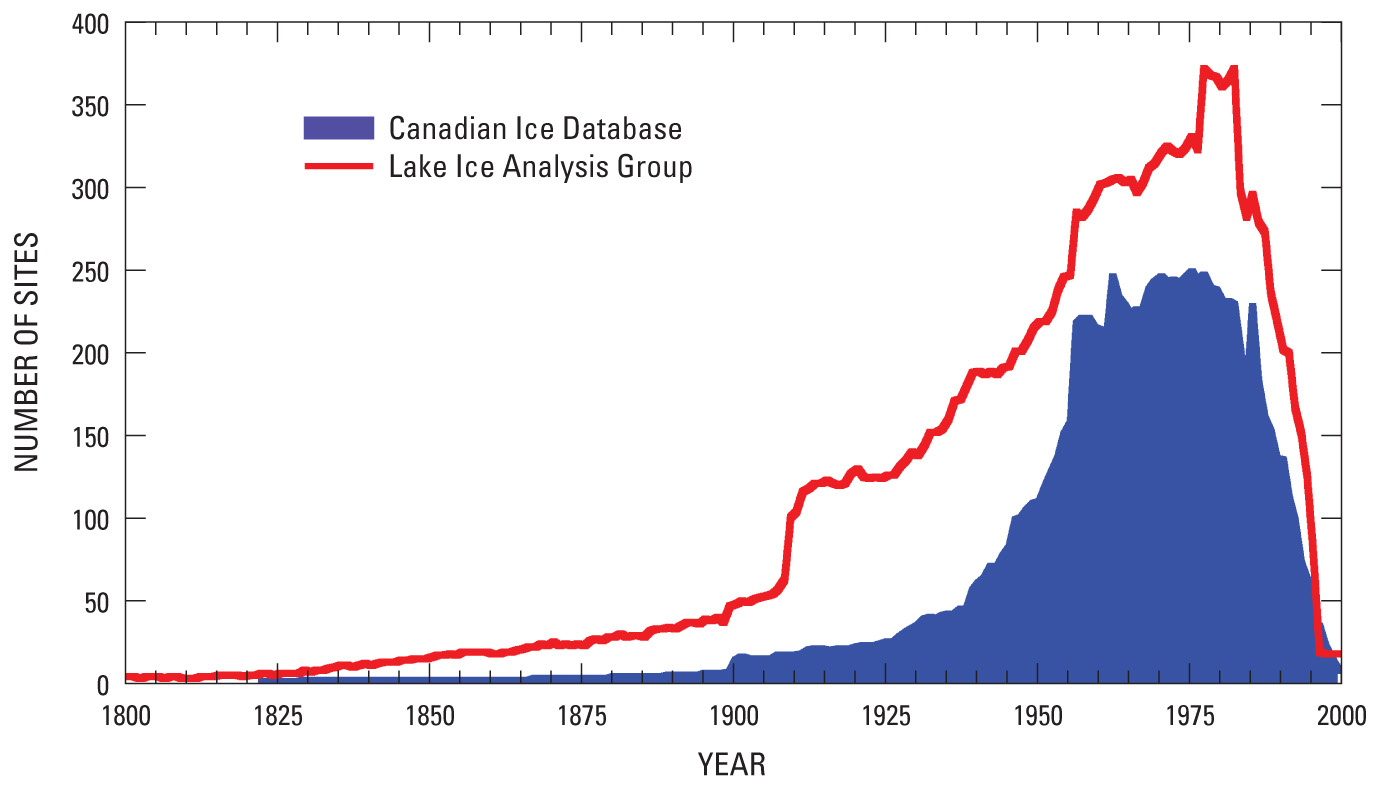 Figure 30. Historical evolution of the number of lake-ice and river-ice observation sites from the Lake Ice Analysis Group (LIAG) and the Canadian Ice Database (CID)(Lenormand and others, 2002) showing a peak in the number of observation sites in the 1970s followed by a marked decline that started in the mid-1980s. The LIAG database, also known as the Global Lake and River Ice Phenology Database, is available from the National Snow and Ice Data Center (NSIDC), and the CID is available from the Canadian Cryospheric Information Network (CCIN). Some of the observations from the CID have been incorporated into the LIAG database. |

![]() U.S. Department of the Interior |
U.S. Geological Survey
U.S. Department of the Interior |
U.S. Geological Survey
URL: http://pubsdata.usgs.gov/pubs/pp/p1386a/gallery4-fig30.html
Page Contact Information: GS Pubs Web Contact
Page Last Modified: Thursday, 01-Dec-2016 16:25:57 EST
