Professional Paper 1386–A
|
Select image for high resolution and Save to download 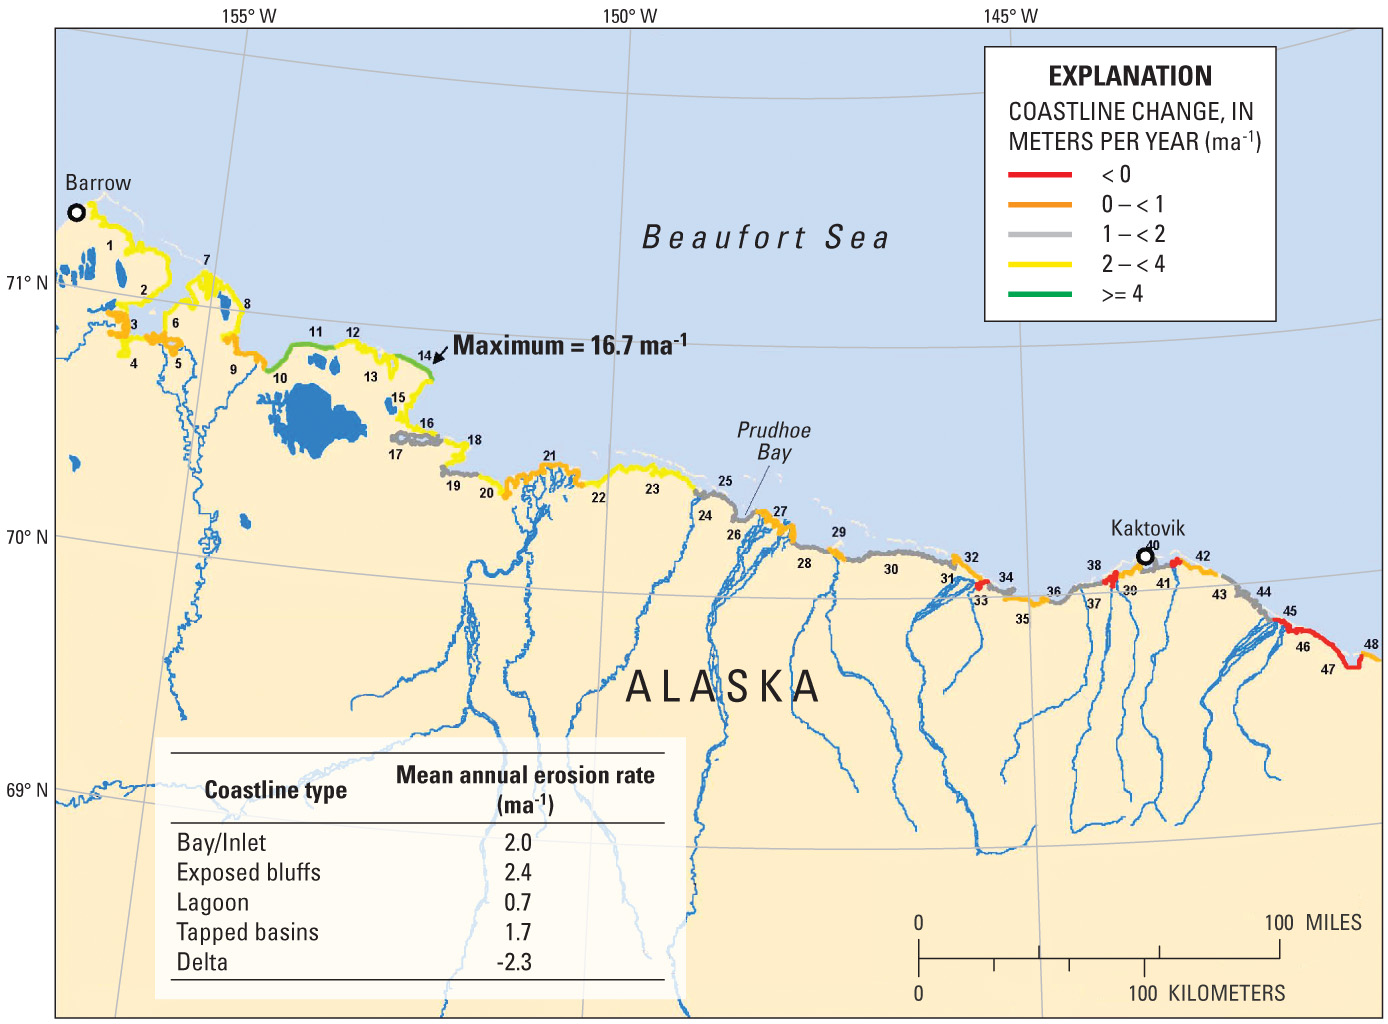 Figure 37.—Map showing coastline type and mean annual historical erosion rates along the Beaufort Sea coast of Alaska based on analysis of high-resolution imagery and geodetic ground control (Jorgenson and Brown, 2005). |

![]() U.S. Department of the Interior |
U.S. Geological Survey
U.S. Department of the Interior |
U.S. Geological Survey
URL: http://pubsdata.usgs.gov/pubs/pp/p1386a/gallery5-fig37.html
Page Contact Information: GS Pubs Web Contact
Page Last Modified: Thursday, 01-Dec-2016 16:26:15 EST
