Professional Paper 1386–A
|
Select image for high resolution and Save to download 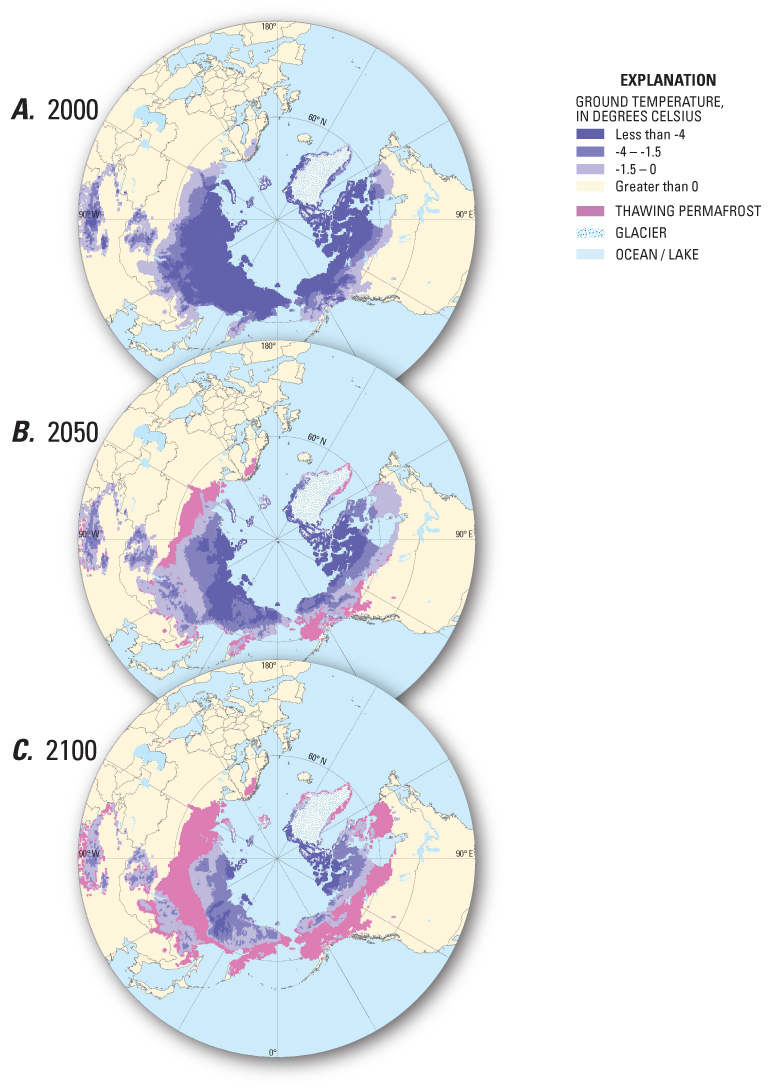 Figure 48.—Modeled circumpolar permafrost temperatures (mean annual temperature at the permafrost surface) for A, 2000; B, 2050, and C, 2100 (modified from Romanovsky, Gruber, and others, 2007). |

![]() U.S. Department of the Interior |
U.S. Geological Survey
U.S. Department of the Interior |
U.S. Geological Survey
URL: http://pubsdata.usgs.gov/pubs/pp/p1386a/gallery5-fig48.html
Page Contact Information: GS Pubs Web Contact
Page Last Modified: Thursday, 01-Dec-2016 16:26:20 EST
