Mapping of the main glaciers commenced early in the period of exploration. These maps are the result of the efforts of a few enterprising and capable individuals. The Franz Josef Glacier was sketched by von Haast in 1865, and, in 1893, Douglas and Harper compiled the first map. Fox Glacier was surveyed by Douglas and Wilson in 1894-95. The next maps were made by Greville and Bell in 1910 (Bell, 1910).
On the eastern side of the divide, almost all of the mapping
work was concentrated in the Mount Cook area, where Julius von Haast made sketch
plans of the Tasman, Godley, and Classen Glacier termini in the years 1862 and
1889 (Gellatly, 1985). In 1888, T.N. Brodrick began triangulation surveys and
topographic mapping and produced a number of maps and plans of the Mount Cook
and Godley Valley glaciers from 1889 until after the completion of his fieldwork
in 1906.
In 1893, a topographic map of the "central portion of the Southern Alps" was published by the Royal Geographical Society, London. This map, showing the four large eastern glaciers and the two large western glaciers, was probably the first to show the relative positions of glaciers on both sides of the Alps. For the remainder of the Southern Alps, from the late 1890's, a series of survey district maps was produced to which details were added as exploration (mainly for pasture land) proceeded.
In Westland, before the turn of the century, there were practically no maps of the mountain areas apart from the sketches and maps of Douglas and Harper. The first reasonably reliable regional maps were base maps constructed in the early 1900's by the New Zealand Geological Survey as part of their geological surveys. These maps are rich in detail and show all glaciers observed, although the accuracy varied with the surveyor's proximity to the features mapped.
In 1911, a detailed map of the Franz Josef and Fox Glaciers was published by the Canterbury Progress League. This map, together with the 1893 map, was reprinted (unaltered) in 1976 in the New Zealand Alpine Journal with facsimile editions of early journal volumes.
No topographic maps of the glaciers were available until the Department of Lands and Survey commenced publishing a 1-inch-to-l-mile topographic maps series (New Zealand Mapping Series 1 at a scale of 1:63,360). Publication of the first sheets began in about 1958. Until this time, uncontoured 4-mile maps of the New Zealand Territorial Series (NZMS 10) at a scale of 1:253,440 and Survey District and County Series Cadastral Maps at 1:63,360 were the best available. By the mid 1970's, effectively the whole of New Zealand had been mapped in the 1:63,360-scale topographic series with a 100-ft contour interval. However, the glaciers depicted on some of these maps may not have accurate outlines in their upper areas. The maps were prepared from vertical aerial photographs on which the position of the névé boundary depends on the amount of snow, which in turn is dependent on the time of year that the photography was acquired. Most of the aerial photographic survey flight runs were not made at the correct time of year (optimum time is prior to the end-of-summer seasonal snow-cover minimum). As a result, these maps show variable amounts of snow cover. Thus, the earlier in the summer the photography, the greater the error in plotted glacier size. Attempts have been made to reduce this error, for example, on the Mount Cook Sheet (S. 79), where permanent snow boundaries have been based on data from local observations, rather than those shown on the aerial photographs. Currently, the Department of Survey and Land Information is preparing a series of maps at 1:50,000 scale and with a 25-m contour interval. This remapping program is a large undertaking, and it will be more than a decade before the new series is completed for the whole country. Data from the New Zealand glacier inventory are being used extensively in remapping the glacierized areas.
Imaging of Glaciers
Aerial Photography
The first known sequences of vertical aerial photographs in New Zealand were taken around 1937 and 1938 by New Zealand Aerial Mapping, Ltd., but these were mainly of lowland areas. A set of vertical aerial photographs was taken over the Franz Josef, Fox, Tasman, and Hooker Glaciers in 1953, followed by a most useful set of oblique aerial photographs taken by the Royal New Zealand Air Force along both sides of the Southern Alps in autumn 1955. These surveys were made just prior to the first of the systematic vertical aerial photographic flights made over the Southern Alps as part of a nationwide aerial photogrammetric mapping program. By the end of the 1960's all of the glacierized areas were photographed, and many areas have been rephotographed since.
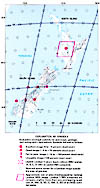
All of New Zealand's glacierized areas are included in existing Landsat images, but not all of the images are usable for glacial observations (fig. 8). The two requisites for an optimum usable image are no cloud cover and an image acquired at the time of minimum snow cover (late summer). Many of the better images of the glacierized areas have glacial features obscured by seasonal snow. The coding for each of the nominal scene centers shown on figure 8 refers primarily to the amount of cloud cover over the glacierized regions. Table 1 provides additional information on each image, including remarks about amount of snow cover.
|
Figure 8.-Map of New Zealand showing availability of Landsat images of glaciers. |
Table 1 lists the known usable images of the New Zealand glaciers. Many additional images exist, but these are generally unacceptable because of excessive cloud cover or because of snow cover on winter scenes. Unfortunately, the Landsat satellite paths and image rows do not coincide well with the configuration of the glacierized areas. This results in images of the more important glacerized regions appearing at the margins of the images. The best available image of the Mount Cook area is the larger scale (1: 500, 000) Landsat 3 RBV image (30324-21342, subscene A), corresponding to the northwest quadrant of Path 79, Row 91, but this image lacks relief detail in the snowfields (Ferrigno and Williams, 1983).
Landsat images are more appropriate for the larger glaciers, because the spatial resolution of the image is inadequate for identifying details of small glaciers less than about 1 or 2 km2 in area. On a 1:1,000,000-scale Landsat MSS image 1 km equals 1 mm, so a 1-km2 glacier would measure 1 mm2 on the image. Even on a 1:500,000-scale Landsat 3 RBV image, a 1-km2 glacier would only be 4 mm2. Unfortunately the rapid changes in small, steep, and very active glaciers, such as the one shown in figure 9, are difficult to monitor by satellite imagery. On some small glaciers the snowline has recently risen beyond the upper limits of the glacier, thereby leaving the entire glacier in the ablation zone (fig. 10).
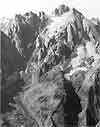 |
Figure
9.-Oblique
aerial photograph looking east on 11 April 1978 at a small unnamed glacier
under Mount Kensington (2,446 m) west of the main divide in the Mount Whitcombe
region. The glacier, typical of steep Westland glaciers having a high activity
index, reacts strongly to climatic changes. Photograph by Trevor J.H. Chinn,
New Zealand Geological Survey, film negative no. 7826. |
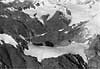 |
Figure 10.-Oblique aerial photograph looking east on 16 April 1980 at the Jalf Glacier, a "dying" glacier on the West Coast between Franz Josef and Fox Glaciers. The surface of bare ice indicates that the snowline has risen completely above the glacier, and no snow at all from recent winters has remained to contribute to the glacier balance. Photograph by Trevor J.H. Chinn, New Zealand Geological Survey, film negative no. 8094. |
All of New Zealand's glaciers have generally been receding since the beginning of the century (fig. 6), with fluctuating, but rising, end-of-summer snowline elevations. During the "Late Neoglacial" cool period, which persisted during the past 500 to 800 years, most New Zealand glaciers reached three main maximums, climaxing in 1750, 1850, and 1890 (Wardle, 1973; Burrows, 1975; Burrows and Maunder, 1975; Burrows and Russell, 1975; Salinger, 1976; Hessell, 1980, 1983; Salinger and others, 1983). From 1890 there was a general slow recession of most glaciers until the late 1920's, when a widespread rapid retreat commenced. This retreat is continuing, punctuated by only minor readvances in the more active glaciers (fig. 6). Associated with the retreat of glacier termini, most glaciers have suffered a reduction in size and a rise of snowline elevations. From 1971 to 1975, Ivory Glacier lost more than 30 m of thickness in the terminus area, less over other parts of the glacier (fig. 7). The total volume of ice and snow lost during this period for this glacier alone was 13.9 x 10⁶ m3, or an average annual loss of 3.5 x 10⁶ m3. During the same period the area of this glacier was reduced by 26 percent, from 0.80 km2 to 0.59 km2. Where the larger glaciers extend to low-gradient or ponded ice trunks at valley floor level, recession is evident by a steady lowering of ice-surface levels, accompanied by little or no change in terminus position, or by the development of a proglacial lake. These glaciers have glacier snouts that are normally debris covered, and many have recently developed glacierkarst features. The glacierkarst terrain on Tasman Glacier is well displayed on Landsat 3 RBV image 30324-21342, subscene A (fig. 11). Recently formed proglacial lakes of Classen and Godley Glaciers also appear clearly near the northern margin of this image. Figure 12 is an oblique aerial photograph of Douglas Glacier's proglacial lake, which has developed during the past 20 years. The change in size of proglacial lakes is possibly the single best indicator of glacier variations seen on satellite imagery.
In contrast to the slow response of glaciers with large low-gradient trunks, large glaciers with steep trunks have been very reactive to small mass-balance changes, and the long period of glacier recession during the 20th century has been manifested in a series of small advances superimposed upon a general recession, similar to waves on the seashore at ebbing tide. Franz Josef and Fox Glaciers are of this type (figs. 13 and 14), but unfortunately no usable Landsat images of these glaciers exist. Both glaciers lie in the corners of the available Landsat images and are either poorly displayed or obscured by cloud cover.
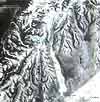 |
Figure 11.-Landsat 3 RBV image (3032421342, subscene A; 23 January 1979; Path 79, Row 91) of part of the Mount Cook region showing glacierkarst features developing on the Tasman Glacier and a wide array of additional glacial features. |
 |
Figure 12.-Oblique aerial photograph looking northeast on 11 April 1978 of the debris-covered and detached trunk of Douglas Glacier, which terminates in a rapidly expanding proglacial lake. Photograph by Trevor J.H. Chinn, New Zealand Geological Survey, film negative no. 7830. |
 |
Figure 13.-Historic variations of the terminus position of the Franz Josef Glacier and associated events. |
| Figure 14.- Vertical aerial photographic mosaic of the terminus and environs of the Franz Josef Glacier in 1983 showing outlines of positions of the glacier front over the past two centuries. The forest trimline of 1820 is particularly evident. |
Small glaciers have a short-response time to climatic
changes (Chinn, 1975). A comparative study of photographs taken during the past
10 years indicates that they may have recently slowed their retreat. Some appear
to have even reached a steady state. Unfortunately, the fluctuations of small
glaciers cannot be measured or monitored, because the spatial resolution of
Landsat MSS and RBV imagery (79-m and 30-m picture elements, or pixels, respectively)
is not adequate.
Past glacial extents in both the Pleistocene and Holocene are frequently well depicted on Landsat images. The classic Pleistocene morainal sequences surrounding Lakes Pukaki and Tekapo are well displayed on Landsat MSS image 2805-21163 (fig. 15); the outermost tills are cut by a large canal for a hydroelectric power project. Many of the moraines associated with tributary cirque and valley glaciers also are clearly portrayed. Possibly the largest Pleistocene lateral moraine preserved in New Zealand occurs in south Westland, to the west of the alpine fault. This moraine is shown clearly in the upper lefthand part of Landsat MSS image 2824-21211, band 7 (fig. 16). The successive morainal crests have been progressively moved northeastward by fault displacement, away from the central flowline of the glacier.
Although difficult to see on small glaciers, flow directions can be interpreted on images of the larger glaciers from the patterns of supraglacial morainal debris (fig. 11). Debris-covered glaciers also show flow structures, particularly arcuate structures, in areas of compressive flow. Much of this supraglacial material is derived from rockfalls and landslides, and many of the larger glaciers on the images were found by aerial or field observation to be transporting individual landslides. These features consist of isolated arcuate masses of rock distributed transversely across the glacier trunk (fig. 17). The rate of glacier flow may be estimated from these features by measuring displacement between images made some years apart.
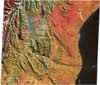 |
Figure 15.-Landsat 2 MSS false-color composite image (2805-21163; 6 April 1977; Path 79. Row 91) showing Pleistocene glacial features and moraines around Lakes Pukaki, Tekapo, and Ohau. |
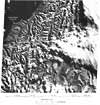 |
Figure 16.-Landsat 2 MSS image (2824-21211, band 7; 25 April 1977; Path 80, Row 91) of a large Pleistocene lateral moraine (arrowed). Northward offset by movement along the Alpine fault may be part of the reason for the unusual width of the feature. |
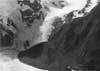 |
Figure 17.-Oblique aerial photograph on 14 March 1980 of a recent rock avalanche that fell onto Murchison Glacier during December 1979. Such deposits are readily visible on satellite images. Their movement and distortion enable ice movement to be monitored by satellite imagery. Photograph by Trevor J. H. Chinn, New Zealand Geological Survey, film negative no. 8025. |
The elevation of the end-of-summer snowline on a glacier depends on winter snowfall and summer melt, and changes in snowline position from year to year reflect the precipitation and temperature regimes for the previous year. Snowline positions may be delineated on the larger glaciers, particularly where there is little relief and the glacier gradient is low. The demarcation between snow and bare ice shows up as the boundary between blues and whites on Landsat MSS color-composite images, or as differences in gray tone on black-and-white images (individual Landsat MSS bands 4, 5, 6, or 7).
Variations
in glacier-snowline position are probably the single best indicator of a glacier's
health. This line separates the accumulation area from the ablation area, and
a rise in snowline elevation above its mean position indicates a negative glacier
balance. Continued annual negative balances ultimately result in glacier recession.
Glacier-snowline elevations have been recorded during studies on the Tasman
and Ivory Glaciers (Chinn and Bellamy, 1970; Anderton and Chinn, 1978; Anderton,
1975) and are compared in table 2. During the studies on the Ivory Glacier,
the end-of-season snowlines rose above the upper elevation limit of the glacier
to an indeterminate elevation on the headwall. Therefore, mass-balance figures
are given instead of snowline elevation.
Conclusions
Glaciers are particularly useful for the study of present and past climatic variations. A record of variations in glacier margins and glacier-snowline positions provides a means of accurately documenting yearly climatic variations, whereas moraines mark previous glacier extents and thus record past colder climates. Satellite imagery is a fast and regionally comprehensive method of documenting all of these glacier features. In New Zealand, satellite imagery may have its greatest value in establishing past limits of the larger glaciers, because former moraines and other subtle ground features clearly show former glacier extent. The limiting factor of Landsat images of New Zealand for glaciological monitoring is the effective spatial resolution of MSS, Landsat 3 RBV, and thematic mapper (TM) data (79-m pixels for the MSS, 30-m pixels for the RBV and TM images). Future satellite images, such as photographs from the Large Format Camera, which have a spatial resolution of 10 m (equivalent to a 3-m pixel), will result in a major reassessment of the value of satellite imagery for monitoring fluctuations in New Zealand's glaciers.
| Home | Volume Contents | New Zealand References Cited |
U.S. Geological Survey, U.S.Department
of the Interior
This page is https://pubs.usgs.gov/prof/p1386h/nzealand/nzealand2.html
Contact: Richard S. Williams, Jr.,
and Jane G. Ferrigno
Last modified 05.04.00