The Sierra Nevada del Cocuy trends north-south on the Cordillera Oriental. Mountain glaciers extend along an 18-km-long segment, and glaciers and snowfields measured on a 1973 Landsat image covered an area of 28 km2 (table 3). However, Jordan and others (1989), using 1959 and 1978 aerial photographs, gave a preliminary estimate of 39.12 km2 (table 2). In contrast, Thouret and others (1996) gave a range from 28 to 30 km2 for the glacierized area. Glaciers flow only to the west because of the extremely steep eastern slopes of the range. The highest peak in the range rises 5,493 m above mean sea level. The lowest elevation for a glacier terminus was reported by Ancízar (1853) to be 4,150 m. One hundred years later, Kraus and Van der Hammen (1959, 1960) reported the termini elevations of four glaciers to be between 4,325 and 4,425 m, an estimated average annual retreat of about 1.6 m a-1. The snowline elevation was reported to be at 4,676 m by Ancízar (1853), at 4,780 by Notestein and King (1932), and at 4,900 m by the Cambridge Expedition (Stoddart, 1959). Older long-time residents of the Sierra Nevada del Cocuy have observed a significant retreat of the snowline and glacier termini during the last 50 years.
Figure 6.--Glacierized area (green) on the Sierra Nevada del Cocuy drawn from 1955 aerial photographs (modified from Kraus and Van der Hammen, 1959, 1960). Van der Hammen and others (1980/81) produced a revised map of part of the area encompassed by figure 6.
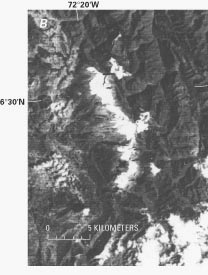
Figure 6 shows a sketch map prepared from 1955 aerial photographs (Kraus and Van der Hammen, 1959, 1960). Van der Hammen and others (1980/81) published a revised map of the glaciers compiled at a scale of 1:40,000 from 1955 and 1959 aerial photos. Figure 7A illustrates the glacier extent in 1973, which was estimated to be about 22 km2 as shown on a Landsat MSS image (1179-14373; 18 January 1973; fig. 7B). A small but noticeable change in area took place during the 1955-1973 period, which can be estimated as a reduction of 6 km2.
| Figure 7.--Glaciers and snowfields of the Sierra Nevada del Cocuy. A, Area of glaciers and snowfields, shown in green, calculated from a Landsat 1 MSS image acquired on 18 January 1973. B, Enlargement of northeastern part of Landsat 1 MSS image (1179-14373, band 7; 18 January 1973; Path 7, Row 56) from the EROS Data Center, Sioux Falls, S. Dak. | |
|
|
| Home | Next |
U.S. Geological Survey, U.S.Department of the Interior