
Rapidly disappearing glaciers are found on the Sierra Nevada de Santa Marta massif along its east-trending watershed above the 4,700-m elevation; maximum elevations are reached by the 5,775-m-high twin peaks, Pico Simón Bolívar and Pico Cristóbal Colón. Rapid deglaciation in this region was reported in 1939 by Notestein (1939) and confirmed in 1969 by Wood (1970). Van der Hammen (1984) found that considerable expansion of the glaciers took place between about 1500 and 1850 but noted a continuous retreat of glacier termini during the 20th century.
At the time of the Cabot Expedition (Cabot, 1939), the glaciers of the Sierra Nevada comprised five groups, as described by Raasveldt (1957). As previously noted, Raasveldt (1957) estimated the ice extent during the Bolívar stade to be 105 km2; he also gave 4,700 m as the generalized elevation of glacier termini and a minimum of 4,500 m based on 1954 aerial photographs. The five groups of glaciers are as follows:
Maps were compiled that documented the glacier extent at the time of the Cabot Expedition and published by Wood (1941) and Raasveldt (1957) (fig. 2). The glacier extent shown in Wood's map was measured by the use of a planimeter, and the surface area of ice-covered terrain was estimated to be approximately 17.5 km2 (Wood, 1970). Raasveldt (1957), however, cited the glacier area as covering 39 km2. Wood (1970), on the basis of 1969 fieldwork and aerial photographs, sketched the glacier extent (fig. 3) and made a very rough estimate that at least one-third of the glacier area had disappeared between 1939 and 1969. Using aerial photography from 1957 and 1974, Jordan and others (1989) gave a preliminary estimate of total glacier area of 16.26 km2 (table 2). This author measured the ice- and snow-extent in a 1973 Landsat image and estimated a total area of 14.1 km2 (fig. 4; table 3). Although the measurement techniques used by each author differed, everyone is in agreement that the deglaciation is continuing.
Figure 2.--Extent of the glacierized area (green) on the Sierra Nevada de Santa Marta in 1940 drawn from aerial photographs (modified from Raasveldt, 1957).

Figure 3.--Extent of the glacierized area (green) on the Sierra Nevada de Santa Marta in 1969 drawn on the "Cabot" map (Wood, 1941) by using oblique aerial photographs (modified from Wood, 1970).

| Figure 4.--Glaciers and snowfields of the Sierra Nevada de Santa Marta. A, Area of glaciers and snowfields, shown in green, calculated from a Landsat 1 MSS image acquired on 1 January 1973, band 7. B, Enlargement of northwestern part of a Landsat 1 MSS image (1162-14421; 1 January 1973; Path 8, Row 53) from the EROS Data Center, Sioux Falls, S. Dak. | |

|

|
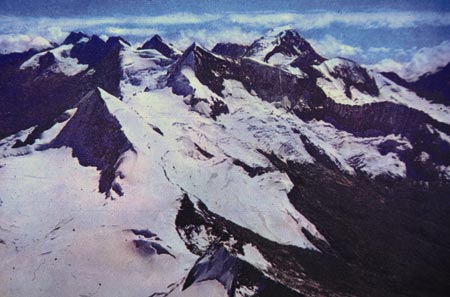
Kraus and Van der Hammen (1959, 1960) reported elevations of glacier termini during 1958, and Van der Hammen (1984) gave corrected elevations (-75 m for each) of 4,745 m for the glacier between Picos Tayrona and El Guardián, 4,855 m for the glacier descending from Pico La Reina, and 4,830 m for the glacier descending between Picos Ojeda and Simón Bolívar. A comparison of these elevations with the earlier maps and later reports indicates that the mass wasting of the glaciers seems to have been more severe on the south-facing slopes and below the 5,100-m elevation. The glaciers of Nevado Parra Lleras and the Méndez, Ruiz Wilches, and Tayrona peaks had disappeared, as had most of the ice-and-snow cover of the south slopes of the Ojeda-La Reina twin ridges. The equilibrium line altitude (ELA) here is estimated to be about 5,100 m. Figure 5 is an oblique aerial photograph of the Sierra Nevada de Santa Marta seen from the east.
Figure 5.--Oblique aerial photograph of the highest peaks of the Sierra Nevada de Santa Marta seen from the east. Photograph courtesy of Movifoto.

| Home | Next |
U.S. Geological Survey, U.S.Department of the Interior