|
| Professional Paper 1643: FIGURES 8-17 |
Figures 8-17
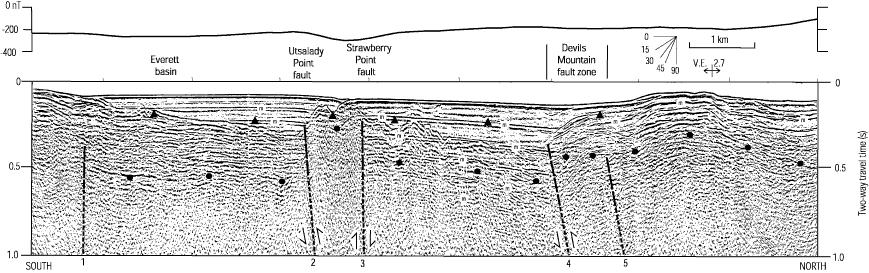
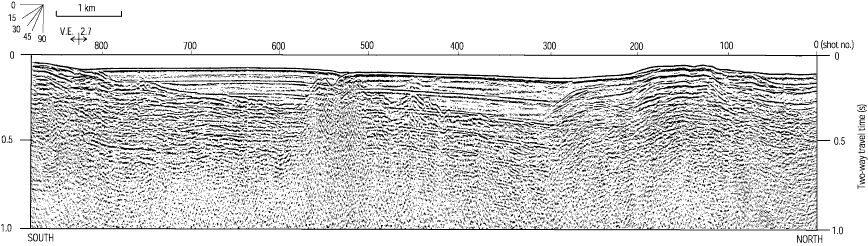
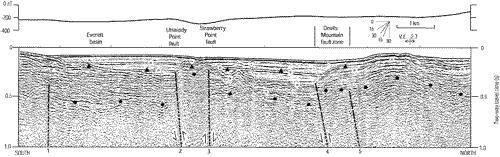
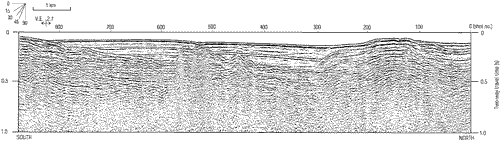
U.S. Geological Survey, Geological Survey of Canada, and industry seismic-reflection profiles from the eastern Strait of Juan de Fuca area (figure 5). For all profiles, tops of dots indicate inferred base of uppermost Pliocene(?) to Pleistocene deposits; tops of triangles indicate inferred base of uppermost Pleistocene to Holocene (postglacial) deposits; and prominent water-bottom multiples are shown by "m." Long dashed bold lines show inferred faults constrained by seismic reflections; short-dashed lines show inferred deeper continuation of faults based on trends in shallower data. Anticline and syncline axes are shown above the profiles. Vertical ticks (numbered on uninterpreted sections) on tops of profiles show shot locations and correspond to the ticks on figure 5 tracklines. Numbered labels on faults refer to text discussion and are not correlative between seismic-reflection profiles.
Next—>
Use BACK button to return
Contact: Susan Rhea
This page is brought to you by the Earthquake Hazards Program