

Integrated Science Strategy for Assessing and Monitoring Water Availability and Migratory Birds for Terminal Lakes Across the Great Basin, United States
Links
- Document: Report (10.5 MB pdf) , XML
- Data Releases:
- USGS data release - Bibliography of hydrological and ecological research in the Great Basin terminal lakes, USA
- USGS data release - Protected areas database of the United States (PAD-US) 3.0
- Version History: Version History (2 KB txt)
- NGMDB Index Page: National Geologic Map Database Index Page (html)
- Download citation as: RIS | Dublin Core
Executive Summary
In 2022, the U.S. Geological Survey (USGS) established the Saline Lake Ecosystems Integrated Water Availability Assessment (IWAAs) to monitor and assess the hydrology of terminal lakes in the Great Basin and the migratory birds and other wildlife dependent on those habitats. Scientists from across the USGS (with specialties in water quantity, water quality, limnology, avian biology, data science, landscape ecology, and science communication) formed the Saline Lake Ecosystems IWAAs Team. The team has developed this regional strategic science plan to guide data collection and assessment activities at terminal lakes in the Great Basin.
The U.S. Congress requested the USGS to establish the Saline Lake Ecosystems IWAAs in response to historically low water levels at terminal lakes and associated wetlands across the Great Basin (Wilsey and others, 2017; Wurtsbaugh and others, 2017). Not all Great Basin terminal lakes have high salinity; however, all terminal lakes occur in endorheic, closed, basins with no surface-water outflow. Low lake levels across the Great Basin are the result of increased water use for agriculture and municipalities, drought conditions, and a warming climate. Great Basin terminal lake water extents have decreased by as much as 90 percent over the last 150 years (Larson and others, 2016; Wilsey and others, 2017), and terminal lake wetlands have decreased in area by as much as 47 percent since 1984 (Wurtsbaugh and others, 2017; Donnelly and others, 2020). Lake elevations and wetland areas are primarily supported by freshwater inputs from snowmelt feeding upgradient rivers, streams, and springs. These freshwater inputs have been severely reduced because of continued and increased surface-water diversions and surface-water capture through groundwater pumping for agriculture, mining, and public supply (Wurtsbaugh and others, 2017; Donnelly and others, 2020) as well as unprecedented drought conditions (Martin and others, 2020; Overpeck and Udall, 2020) and warming temperatures related to climate change (Dettinger and others, 2015; Udall and Overpeck, 2017; Hall and others, 2023).
Water quality, specifically salinity, is highly variable for terminal lakes of the Great Basin, and this variability is a result of the balance between freshwater inflow and evaporation. Variability of salinity at each of the terminal lakes can be affected by lake morphology, hydrogeologic features of the basin, annual variability in weather patterns, and changes in upgradient water use. Hypersaline terminal lakes provide abundant food resources such as brine shrimp and brine flies that support nesting and migrating birds. The density and composition of invertebrates are closely tied to lake salinity (Herbst, 1999). Increased salinity can exceed the tolerance of invertebrates, severely limiting their biomass (Herbst, 2006; Senner and others, 2018; Donnelly and others, 2020). In contrast, decreased salinity can lead to altered invertebrate community composition, reducing the abundance of optimal avian prey resources (Senner and others, 2018).
Great Basin terminal lake ecosystems, including open-water and adjacent aquatic and terrestrial environments, provide resources necessary to sustain many animal populations throughout the year. Although a variety of taxa use terminal lakes, these ecosystems are of acute importance for the millions of migratory waterbirds (for example, shorebirds, wading birds, and waterfowl) dependent on the network of terminal lakes and their associated wetlands. Migratory birds transiting the Pacific and Central Flyways use Great Basin terminal lake ecosystems throughout the year to feed, nest, and transit between wintering and breeding ranges (Wurtsbaugh and others, 2017; Haig and others, 2019; Donnelly and others, 2020). As such, successful conservation of birds and their habitats requires coordinated management of water and habitats across the Great Basin network of terminal lakes and wetlands.
The linkages between water availability and ecosystem vulnerability of terminal lakes in the Great Basin are not well understood. The vulnerability of terminal lakes is related to the factors driving change and adaptive capacity of the lake ecosystem. Saline lake ecosystems are vulnerable when changes in water quantity affect ecosystem function. Water quantity affects salinity, which affects food webs and habitat; these linkages can be investigated with water-quality and food web monitoring. Water quantity also affects inundated habitat, which can be quantified through remote sensing (Donnelly and others, 2020). It is necessary to quantify hydroclimatic and water use controls on water availability to terminal lakes to assess the response of the ecosystems. Remotely sensed data can provide a broad-scale and long-term synoptic view of terminal lake hydrologic characteristics, but ground observations are required to interpret changes in water quality and ecological functions. Some terminal lakes have continuous hydrologic monitoring and modeling efforts within the Great Basin (for example, Great Salt Lake, Carson River valley), yet most monitoring locations are hydrologically upgradient and too far away from lake inflows to provide an accurate assessment of hydrological trends (app. 1) for the lake ecosystems. Other terminal lakes have no long-term hydrological monitoring in their respective watersheds (for example, Lake Abert).
Ecological data collection in the Great Basin is also insufficient to understand how many birds exist on the landscape, how birds use the mosaic of terminal-lake habitats as an interconnected system, and how Great Basin terminal lakes are linked to the larger continental system of the Pacific and Central Flyways. Across agencies and organizations, tracking bird movement, abundance, and diversity is inconsistent, with some lakes having once- or twice-a-year bird survey efforts and a few locations having more intensive ecological data-gathering efforts (for example, Great Salt Lake, Lake Abert). Bridging hydrological and ecological information gaps will improve understanding of the trends in water supply and water quality, habitat availability and usage, and impacts on vulnerable waterbird species, all of which would be used by managers in coordinated conservation of this unique network of terminal-lake habitats.
The terminal lakes of the Great Basin are part of the Basin and Range physiographic province that extends from the Colorado Plateau on the east to the Sierra Nevada on the west, and from the Snake River Plain on the north to the Garlock fault and the Mojave block on the south (Dickinson, 2006). The Great Basin is larger than 650,000 square kilometers (Coates and others, 2016) and encompasses most of the State of Nevada but also extends to western Utah, eastern California, southeastern Idaho, southwestern Wyoming, and southeastern Oregon. The climate is arid to semiarid with a hydrologic regime that is snowmelt dominated, providing as much as 75 percent of total annual runoff for the region (Dettinger, 2005; Fritze and others, 2011). Terminal lakes of the Great Basin occupy the lowest areas of closed (endorheic) drainage basins, such that lake levels and water quality respond rapidly to surface-water inflow. Terminal lakes provide local and regional economic value to the States in the Great Basin, including mineral extraction, aquaculture, public works, and recreational uses. As an example, assessments of Great Salt Lake’s ecological health and economic impact find hemispheric importance for the former and regional importance for the latter (Bioeconomics, Inc., 2012; SWCA, 2012). Great Salt Lake creates about 7,000 jobs and $2 billion of economic output per year, most of which would be lost with further declines in lake level (Bioeconomics, Inc., 2012; ECONorthwest, 2019).
The objectives of this Science Strategy are threefold: (1) to identify how changing water availability affects the quality, diversity, and abundance of habitats supporting continental waterbird populations; (2) to highlight the scientific monitoring and assessment needs of Great Basin terminal lakes, and (3) to support coordinated management and conservation actions to benefit those ecosystems, migratory birds, and other wildlife. There are long-term hydrological, ecological, and societal challenges associated with terminal lakes ecosystems in the Great Basin. This Science Strategy benefits partners by providing a conceptual model, nested at different spatial extents, that identifies key scientific information needs to inform coordinated implementation of management and conservation plans within and among hydrologic basins to address these complex challenges.
Introduction
Terminal—or endorheic—lakes are aquatic systems with no outlet (Wang and others, 2018). They are often characterized by unique water-quality and aquatic habitats resulting from the long-term accumulation of salts and nutrients (Galat, 1990). The Great Basin in the Western United States is an arid to semiarid region with a network of terminal lakes, containing a range of salinities from fresh to hypersaline. This network of terminal lakes and associated diverse habitats support millions of migratory waterbirds as they traverse the continent along the Pacific and Central Flyways. Terminal lakes provide habitats throughout the Great Basin, supporting dozens of species that use these environments through all stages of their life history (Haig and others, 2019; Donnelly and others, 2020; Tavernia and others, 2021).
There are almost 4 million people living in the Great Basin (U.S. Census Bureau, 2023a, 2023b, 2023c, 2023d, 2023e) with most along the Wasatch Front, Utah, which encompasses the cities of Salt Lake City and Provo, Davis and Weber County communities (62 percent; U.S. Census Bureau, 2023a, 2023c, 2023e), and the Reno and Carson City, Nevada metropolitan areas (15 percent; U.S. Census Bureau, 2023b). Most of the other communities are small rural population centers spread across the six States: California, Idaho, Wyoming, Nevada, Oregon, and Utah (fig. 1). Many boundaries depict the Great Basin, including hydrological boundaries and ecological boundaries (Coates and others, 2016). For the purposes of this Science Strategy, the Great Basin study area represents a reduced contiguous “regional spatial extent” to emphasize relevant terminal lakes and their watersheds, with a total area of 423,000 square kilometers (km2).
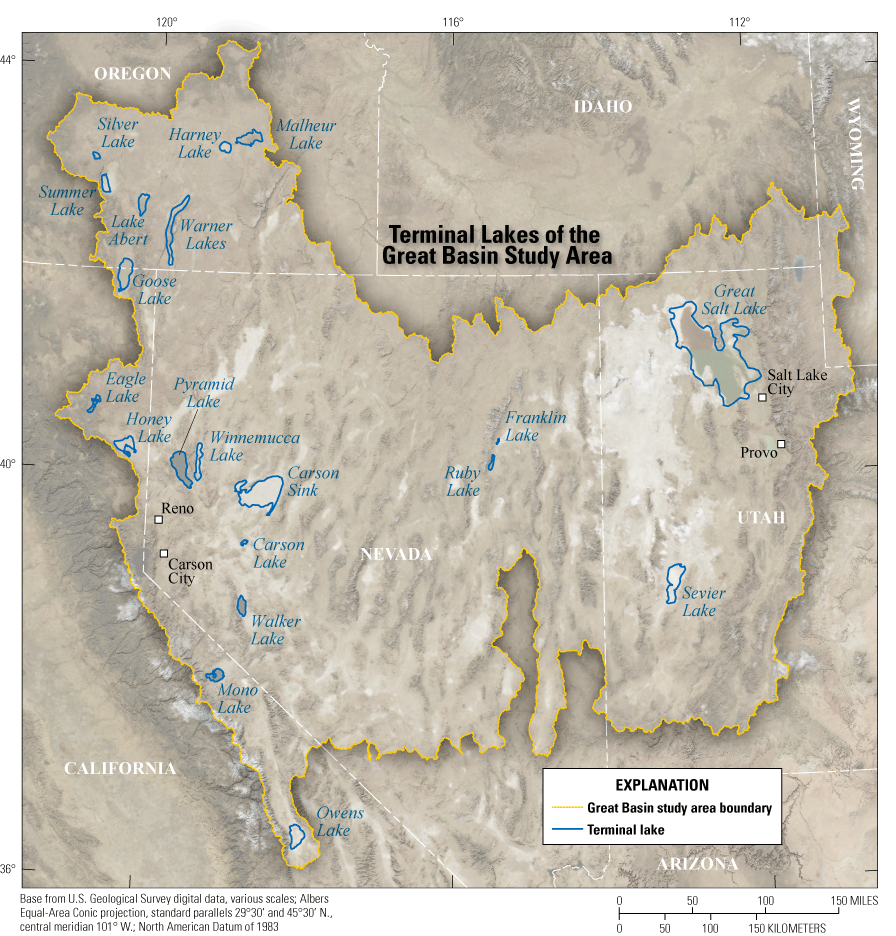
Great Basin study area and terminal lakes initially identified by U.S. Geological Survey partners.
Societal water uses across the Great Basin serve numerous purposes, including agricultural, municipal, military, and mining uses, as well as recreation. Irrigated lands occupied more than 6,400 km2 (1.5 percent of total area) in the Great Basin from 2002 to 2017 (Shrestha and others, 2021), yet accounted for about 75 percent of water use in 2015 (Dieter and others, 2018). Agricultural producers rely on networks of highly managed rivers and canals, as well as groundwater, to supply water for irrigation. The timing and amount of surface-water deliveries are controlled by Federal, State, and Tribal entities. Growing communities and industry also rely on these same sources for drinking water and industrial supply.
Management jurisdictions of water and land across the Great Basin are a checkerboard of Federal, State, and Tribal agencies, private landowners, and water right holders (fig. 2). In total, the Federal government manages the largest land area at 73.5 percent. State and local municipalities own 4.2 percent, and Native American Tribes own 1.1 percent (U.S. Geological Survey [USGS] Gap Analysis Project [GAP], 2022). The Department of the Interior (DOI) manages almost 57 percent of the land in the Great Basin study area, which is divided among bureaus, including the Bureau of Land Management (BLM; 55.1 percent), the U.S. Fish and Wildlife Service (USFWS; 1.3 percent), the National Park Service (0.2 percent), and the Bureau of Reclamation (Reclamation; 0.1 percent). Within DOI, each management entity has differing and sometimes competing mandates and missions that make developing a regional land- and water-management strategy challenging. The mission of the USFWS is to “conserve, protect, and enhance fish, wildlife, plants, and their habitats” (U.S. Fish and Wildlife Service, 2023), which can benefit but also compete with Reclamation’s mission “to manage, develop, and protect water and related resources in an environmentally and economically sound manner” (Bureau of Reclamation, 2023). Perhaps the most complicated single mandate is BLM’s multiple-use mandate, “Congress tasked the BLM with a mandate of managing public lands for a variety of uses such as energy development, livestock grazing, recreation, and timber harvesting while ensuring natural, cultural, and historic resources are maintained for present and future use” (Bureau of Land Management, 2023). Overlaying the Federal missions and mandates are the State agencies that manage water, land, and wildlife with dual focus on conservation and economics as well as the different groups that these Federal, State, and Tribal agencies serve, including public water suppliers, water boards, agricultural districts, private landowners, a wide variety of water rights holders, non-governmental organizations, recreators, and the public.
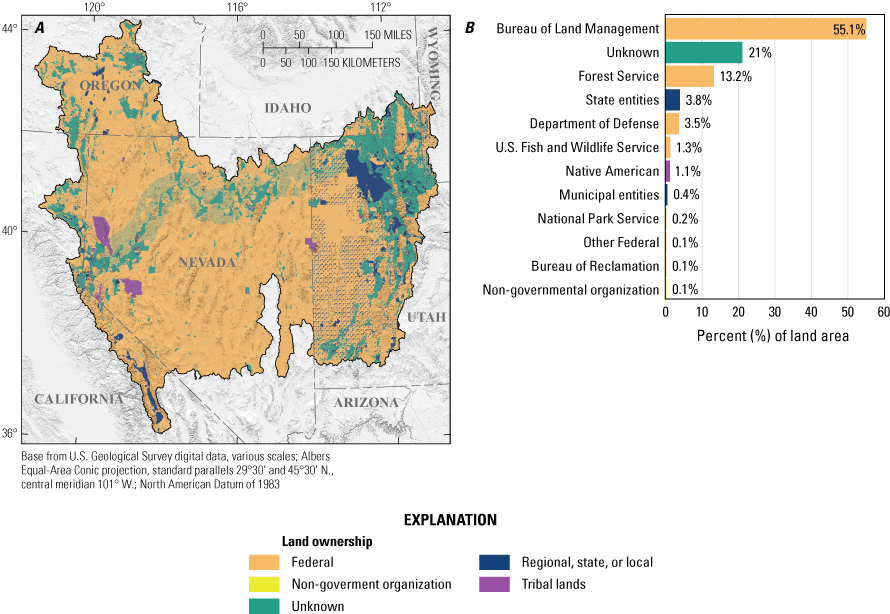
Land ownership within the study area by organizational category (left) and graph showing percentage of land area owned by individual landowners (right). Data from U.S. Geological Survey (USGS) Gap Analysis Project (GAP), 2022.
Inflows to most terminal lakes in the Great Basin are regulated, and thus can be actively managed. The timing and quantity of water releases to terminal lakes is the primary control that managers possess to support migratory bird habitat in the Great Basin. Management decisions and actions are regulated by complex Federal, State, Tribal, and private mandates, proceedings, judgments, agreements, leases, and sales. For example, in Nevada, Reclamation’s Lahontan Basin Area Office contracts and coordinates the management of water and infrastructure on the Truckee and Carson Rivers, which support about 60,000 acres of farmland (Bureau of Reclamation, 2022). The hydrologically separated Truckee and Carson Rivers discharge through a series of reservoirs and canals. The Truckee Canal, built in 1903, diverts Truckee River water across hydrologic basin boundaries for water to enter the lower Carson River Basin. Both rivers discharge to Lahontan Reservoir. The Lahontan Reservoir stores and releases water to the privately owned Newlands Project irrigation areas and agricultural return flows feed into the Stillwater Point Reservoir and the Carson Sink wetlands. The Truckee-Carson Irrigation District operates and maintains the Truckee Canal, the Lahontan Reservoir, and the Newlands Project irrigation areas but these are owned and administered by Reclamation’s Lahontan Basin Area Office. The Carson-Truckee Water Conservancy District, a political subdivision of the State of Nevada, operates and maintains substantial infrastructure upgradient of the Truckee Canal and Lahontan Reservoir, including several water-storage reservoirs. The USFWS Stillwater National Wildlife Refuge is the largest water rights holder within the Newlands Project irrigation area (Lahontan Valley Environmental Alliance, 2009) and manages the water exiting the Stillwater Point Reservoir to provide habitat for migratory birds. Other organizations associated with the Lahontan Basin Area represent hydrological and ecological perspectives and include agencies and Tribes that own, manage, and regulate agriculture, water, wildlife, and other cultural and natural resources. These organizations include the Pyramid Lake Paiute Tribe, Carson Water Subconservancy District, the State of Nevada, and non-governmental organizations (NGOs), including The Nature Conservancy. Additionally, individuals, families, and groups of private landowners and water rights holders have complex lineages of water rights seniority to Lahontan Basin Area resources. Research and recreation organizations also represent specific public interests, including State and private research institutes, the Audubon Society, and hunting and outdoor clubs such as Ducks Unlimited. The example of the Truckee and Carson River systems shows the complexities of managing hydrological and ecological resources seen across the Great Basin, where upgradient management affects downgradient resources. The differing roles, responsibilities, and competing mandates that Federal and State agencies have at specific extents of the Great Basin landscape increase the complexity of integrated regional management.
Terminal lakes in the Great Basin are highly sensitive to changes in water availability (Wurtsbaugh and others, 2017) because they are relatively shallow (table 1) and because of the region’s aridity (Hall and others, 2023). Agricultural and municipal water use, worsening drought conditions, and a changing climate have resulted in historically low water levels at many terminal lakes and their associated adjacent and upgradient aquatic environments across the Great Basin. In fact, surface-water extents of terminal lakes in the Great Basin have decreased by as much as 90 percent (Larson and others, 2016; Wilsey and others, 2017) over the last 150 years, with associated wetland area losses of as much as 47 percent (Wurtsbaugh and others, 2017; Donnelly and others, 2020). The declining availability of terminal lake aquatic habitats threatens the ability of these lakes to support diverse human and ecological needs (Fritze and others, 2011; Dettinger and others, 2015).
Table 1.
Classifications for Great Basin terminal lakes.[State: CA, California; NV, Nevada; OR, Oregon; UT, Utah. Surface-area class: Small, less than 140 square kilometers (km2); Medium 140–350 km2; Large, greater than 350 km2. Salinity: Freshwater, less than 0.3 percent; Hyposaline, 0.2–2.0 percent; Mesosaline, 2–5 percent, Hypersaline, more than 5 percent. Hydrologic regime: Perennial, surface water for more than 8 months per year; Seasonal, surface water 2–8 months per year; Temporary, surface water less than 2 months per year; Dry, no surface water for any period over a year (after Donnelly and others, 2022). Watershed-area class: Small, less than 4,740 km2; Medium, 4,740–10,300 km2; Large, greater than 10.300 km2]
Water use across the Great Basin is highly managed by Federal, State, and Tribal regulations and some hydrologic systems are fully allocated, leading to reduced or mistimed water availability for migrating birds. There is limited accounting of surface-water and groundwater usage across the Great Basin because States have differing reporting requirements for surface-water diversions or groundwater pumping. Since 1984, 7 percent of irrigated fields for agriculture have been shown to provide two-thirds of the wetland resources in terminal lake watersheds (Donnelly and others, 2020, 202218). Yet there is no regional regulatory framework to manage water resources for timing and quality of habitats for migrating bird populations.
Waterbirds rely on terminal lakes and wetlands of the Great Basin for vital resources across their life-history stages, including migration, breeding, molting, and overwintering. Migratory behavior in such a dynamic system requires that birds navigate diverse and changing habitat and food resources across large areas (Skagen and others, 2005; Haig and others, 2019). Reductions of water inputs could affect water quality and reduce in size or even eliminate lakes and associated wetlands. These alterations to water availability—including the quantity, quality, and timing of water to these systems—directly and indirectly affect the terminal lakes’ capacity to support waterbird populations (Haig and others, 2019) (fig. 3). For example, salinity is one of the primary determinants of lake and wetland invertebrate community composition, and water quantity is one of the primary factors influencing salinity in these systems (Moore, 2016; Wurtsbaugh and others, 2017). Thus, changes to water availability can indirectly control waterbird distributions by causing salinity-controlled changes in food availability (Herbst, 2006; Haig and others, 2019).
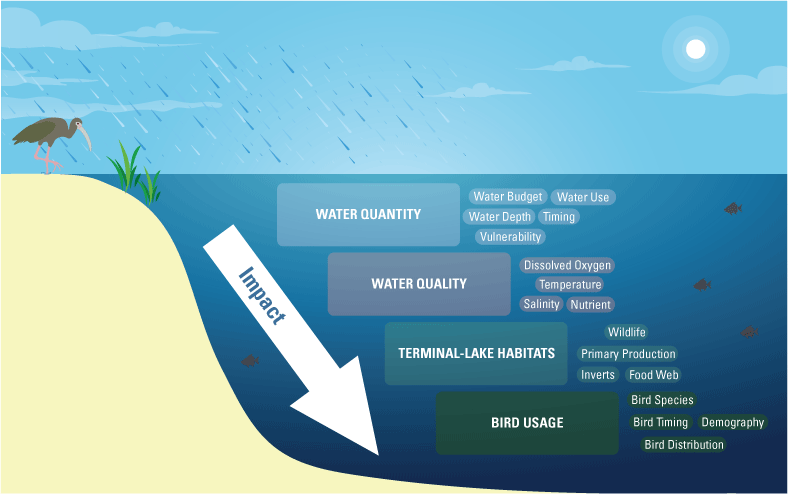
Conceptual diagram showing proposed connections between water quantity, water quality, terminal-lake habitats, and bird usage. This figure is for basic illustrative purposes only and does not represent the full conceptual model.
The U.S. Geological Survey (USGS) has established the Saline Lake Ecosystems Integrated Water Availability Assessment (IWAAs) to monitor and assess water availability to the Great Basin terminal lakes and the migratory birds and other wildlife that depend on these habitats, as directed by the U.S. Congress. The USGS provides scientific tools and information to support the land and resource-management mission but is not a land or resource-management bureau. A subset of representatives terminal lakes to be more closely studied was identified by USGS partners, including the U.S. Fish and Wildlife Service (fig. 1).
Water Availability
Water availability is defined by the USGS as the spatial and temporal distribution of water quantity and quality in surface water and groundwater, as related to human and ecosystem needs, and as affected by human and natural influences (modified from Evenson and others, 2013). The USGS is conducting a series of regional water availability studies—including the Saline Lake Ecosystems assessment—in different parts of the Nation, each addressing a particular water-availability issue of importance in the region. The regional assessments will provide detailed case studies to better understand patterns identified in national-scale assessments of water availability throughout the United States. For the Saline Lake Ecosystems assessment, elements of water availability (for example, water quantity, water quality, and timing of delivery) are treated separately because of their complex relationships in Great Basin terminal lake ecosystems (fig. 3).
Water availability and hydrological vulnerability of the terminal lakes in the Great Basin are not as well understood as in, for example, the Colorado River Basin (Solander and others, 2019; Miller, Miller, and others, 2021; Miller, Putman, and others, 2021). Vulnerability is a function of the sensitivity of a particular system to changes, its exposure to those changes, and its adaptive capacity (Intergovernmental Panel on Climate Change, 2007). For terminal lakes, the water quality and ecology of the ecosystem depend on the amount of inflowing water from the surrounding watershed and the amount that evaporates from the lake surface. The inflows are especially vulnerable to climate change and anthropogenic factors that affect the balance between water influx and a variety of water outflux pathways (Zadereev, 2018). Demands on water resources have prompted monitoring and modeling efforts for some terminal lakes and watersheds (for example, Great Salt Lake and the Carson River Basin), yet monitoring locations are often upgradient and too far from lake inflows to provide accurate trends analyses. Other terminal lakes have no long-term hydrological monitoring in the watershed (for example, Lake Abert).
Targeted data and information-gathering practices are fundamentally important to informing decision-makers about the status and trends of water resources. Long-term data and information gathering can support efforts to determine the resilience of any given lake to stressors on the hydrological system. Resilience is the amount of disturbance that a system can withstand before it shifts into a new state (Holling, 1973; Allen and others, 2016). Specifically, long-term hydrological trends could help identify thresholds in hydrologic systems that, when approached, would require action by resource managers. Improved understanding of the trends in water quantity and quality, habitat availability, and the effects on vulnerable waterbird species will support coordinated management of this network of terminal-lake habitats.
Water Budget and Components
Accounting of water inputs to and outputs from a hydrologic system is understood by quantifying the water-budget components. Fluxes across the hydrologic system may be defined across different scales, from the lake and adjacent aquatic environments to the contributing watersheds that surround the lake of interest—the scale of an endorheic basin (fig. 4). The most salient water budget components that control the amount of water in terminal lakes and adjacent aquatic and terrestrial environments are surface-water and groundwater inflows, evaporation from the lake surface, evapotranspiration from lake margin environments, and consumptive water use by agriculture and municipal sectors. Lake storage declines, which occur during periods of prolonged deficit between total inflows and total losses, contribute to the degradation of lake water quality, ecosystem function, and loss of aquatic habitats.
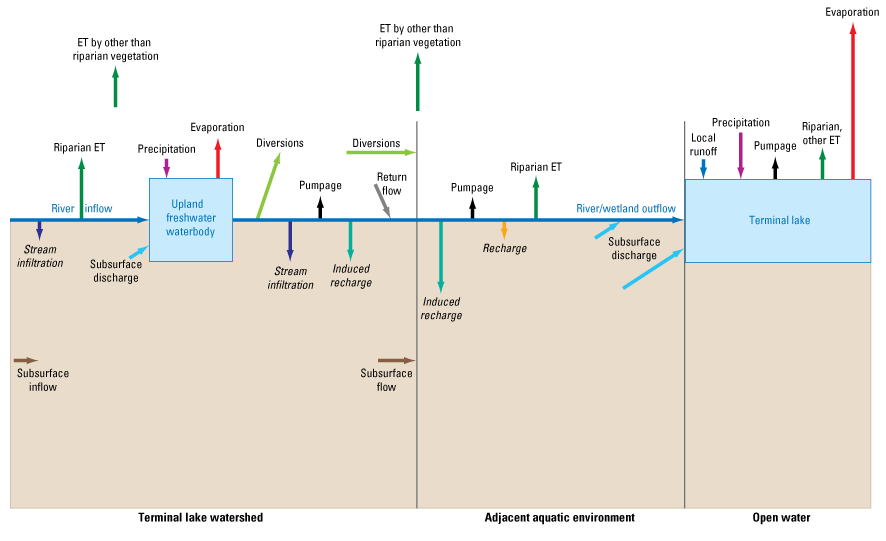
Diagram showing hydrologic fluxes (inputs and outflows) for water budgets of terminal lakes and their watershed spatial extent. Lake spatial extent includes the adjacent aquatic environments and open water. River inflow is the major input to the water budget in both spatial extents. Evapotranspiration (ET) is the only outflow and includes evaporation from open water, standing water in riparian and wetland systems, and soil water and transpiration from plants (modified from Lopes and Allander, 2009).
Water use is a major component of the water budget. The Great Basin has some of the highest per-capita water use in the Nation and, given that most Great Basin surface-water resources are fully allocated, groundwater resources are used to support increasing water needs (Dieter and others, 2018). An understanding of human dimensions and water-use efficiency is an important component of water budgets. Since the early 2000s to present (2023), the demands on water resources have also been aggravated by increasingly prolonged periods of drought (Dai, 2013), increased air temperatures, and changes in the timing of peak streamflow. Although the amount of irrigated land has remained stable in the Great Basin (Shrestha and others, 2021), the increases in air temperature (Snyder and others, 2019) and changes to snowpack and timing of seasonal runoff (Dettinger, 2005; Hall and others, 2023) affect water availability during the growing season. Agriculture generally uses more water to maintain crop yields under higher temperatures (Donnelly and others, 2020), leading to a reliance on more surface water and groundwater to meet irrigation demands. Because of the reduced snowpack and increased demand for groundwater resources, inflow to streams and subsequently to terminal lakes has decreased (Davies and Naranjo, 2022). The magnitude of streamflow losses to each terminal lake watershed is uncertain because groundwater pumping records are limited and reporting regulations vary by State and activity. Increases in air temperature caused by climatic change have led to changes in seasonal evaporation and transpiration, but limited data collection activities have hindered a full understanding of these components of the water budget.
Water Quality
The physical, chemical, and biological characteristics of water vary across terminal lakes in the Great Basin (table 1) and are closely tied to landscape characteristics and available water. Seasonal and long-term changes in terminal lake water volumes cause fluctuations in water quality, which can shift distributions of habitat types and alter productivity of aquatic environments in ways that affect the suitability of habitat for birds. Water-quality constituents that affect the character and productivity of terminal-lake habitats include salinity, alkalinity, dissolved oxygen, pH, turbidity, and nutrients. Salinity is a critical water-quality parameter because it controls the distribution, diversity, and abundance of aquatic life based on their osmoregulatory capacity and (or) salinity tolerances (Herbst, 1999; Vidal and others, 2021).
Terminal Lake Classification
Terminal lakes in the Great Basin can be classified with average annual metrics related to ecosystem functions: salinity, surface area, hydrologic regimes, and watershed area (table 1; “Terminal Lakes Classification” sidebar). Although these metrics do not capture seasonal lake dynamics, or bird usage, these classifications (1) describe general conditions of terminal lakes across the Great Basin; (2) help to categorize lakes along gradients that have hydrological, ecological, or management implications: and (3) can be used to direct and prioritize science activities.
Terminal Lake Classification
Key metrics of terminal lakes:
-
• Salinity is a fundamental characteristic of water that affects Great Basin terminal lake ecosystems. We use four categories to define salinity conditions for the Great Basin lakes from Hammer (1986): (1) salinity less than 0.3 percent; (2) hyposaline, 0.3- to 2-percent salinity; mesosaline, 2- to 5-percent salinity; and (4) hypersaline, more than 5-percent salinity.
-
• Surface area is the total lake extent area derived from lake polygons in the National Hydrography Dataset (Buto and Anderson, 2020). We use three categories to define surface area: (1) small, surface area less than 140 km2; (2) medium, 140- to 50-km2 surface area; and (3) large, surface area more than 350 km2.
-
• Hydrologic regimes, in the context of classifying the Great Basin terminal lakes, are taken from Donnelly and others (2022) and are defined using the monthly presence of surface water in a year. The four classifications are (1) dry, no surface water for any period of more than a year; (2) temporary, surface water for 2 months or less; (3) seasonal, surface water from 2 to 8 months; and (4) perennial, surface water for more than 8 months (Donnelly and others, 2022, fig. 10).
-
• Watershed is land area where precipitation runs off into various waterbodies—such as creeks, streams, rivers, and reservoirs—that eventually flow to a Great Basin terminal lake. Watersheds are derived from the Watershed Boundary Dataset, a component of the National Hydrography Dataset (Buto and Anderson, 2020). Resulting watershed areas are classified into three groups based on statistical percentiles: (1) small, watershed area less than the 50th percentile of 4,740 km2; (2) medium, watershed area from the 50th to 75th percentiles of 4,740 and 10,300 km2; and (3) large, watershed area more than the 75th percentile of 10,300 km2.
Terminal-Lake Habitats
Great Basin terminal lakes are ecologically important because of the habitat diversity created by the substantial gradients in hydrology, water quality, and lake morphometry. At a coarse scale, five common aquatic habitat types are associated with many of the lakes, including open water, wetlands, mudflats, peripheral shallows, and upgradient freshwater. Each of these habitats provide an assortment of resources for visiting birds, including food, cover, and resting space. A mosaic of wetland and plant communities is important for supporting diverse bird populations (Downard and others, 2017) and the variation in timing and depth of habitat inundation supports this mosaic.
The proportion and suitability of associated habitats for each terminal lake varies across the region and is greatly influenced by lake morphometry and water quality. Deep, steep-sided lakes, such as Pyramid and Walker Lakes in Nevada, contain a limited amount of shallow, mudflat environments and are instead dominated by open water areas. Relatively shallow lakes, such as Great Salt Lake and Lake Abert, have substantial open-water habitat with extensive shorelines and shallow slopes that support extensive mudflats. Landscape characteristics also set the patterns for intraannual and interannual dynamics in aquatic habitat extent and conditions. Among these conditions, differences in water quality support different food-web assemblages, with salinity as one of the most important water-quality factors (Vidal and others, 2021).
Bird Guilds and Their Habitat Types
Terminal lakes provide a network of habitats that support a variety of waterbird taxa. Over 600 bird species have been documented in the Great Basin, nearly all (94 percent) occupy drainage basins containing Great Basin terminal lake systems (Global Biodiversity Information Facility [GBIF] occurrence download; GBIF, 2022). Most species (64 percent) specifically use terminal lakes or associated adjacent aquatic environments (GBIF occurrence download; GBIF, 2022). Three bird guilds rely exclusively on these systems: (1) shorebirds and wading birds (order Charadriiformes; for example, American avocet [Recurvirostra americana], phalaropes [Phalaropus sp.], and white-faced ibis [Plegadis chihi]), (2) diving birds (order Podicipediformes; for example, grebes), and (3) waterfowl (order Anseriformes; for example, ducks and geese). These three bird guilds account for as much as 95 percent of all individual birds documented within these lakes and associated habitats (GBIF, 2022). Some examples of the different uses of terminal lakes and associated habitats, by different species, highlight the complexity of avian reliance on terminal lakes in the Great Basin (see “Terminal Lakes Support Different Life Stages and Multiple Bird Groups” sidebar). A more detailed description for how bird guilds use different habitats is available in appendix 2 and will guide the integration of hydrological and bird data collection.
Terminal Lakes Support Different Life Stages and Multiple Bird Groups
Seasonality of bird use:
-
• During spring and fall migration, millions of waterbirds travel through the Central and Pacific Flyways, relying on the abundant food resources produced at the network of terminal lakes across the Great Basin (Wilsey and others, 2017; Haig and others, 2019) (fig. 5).
-
• During spring and summer, some species reside in terminal lakes to nest and rear their young (Haig and others, 2019).
-
• Terminal lakes provide food and protection in summer, when many waterbirds are molting and unable to fly, leaving them particularly vulnerable to deteriorating lake conditions (Jehl, 1988; Kohl and others, 2022).
-
• Overwintering birds rely on habitats in terminal lakes to provide food resources and refugia from predation and disturbance.
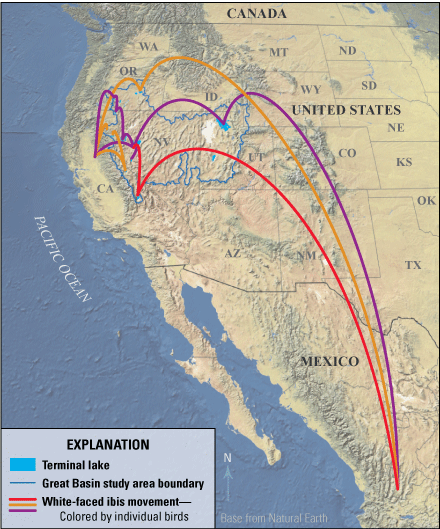
White-faced ibis (Plegadis chihi) spring migration for three individuals (example data courtesy of P. Donnelly, U.S. Fish and Wildlife Service, 2023). Each line shows the northward movement of a white-faced ibis; Great Basin terminal lakes offer seasonal habitats and stopover sites during migration.
Diversity of bird use (fig. 6):
-
• Wading birds like ibis, herons, and egrets often feed in shallow water or marsh edges and even adjacent upland fields during the day, before moving to emergent vegetation in open water areas for nighttime roosting habitat.
-
• Shorebirds use shallow open-water habitats, upland areas, sandflats, sand beaches, evaporation ponds, mudflats, and shorelines for all aspects of their daily behavior.
-
• Waterfowl feed, roost, and seek protection from predators in shallow-to-deep wetland areas with vegetation cover ranging from none to fully covered. Waterfowl also use adjacent upland habitats for nesting during the breeding season.
-
• Some birds—such as grebes, diving ducks, and coots—are open-water specialists that rarely leave the open water or shoreline to support their life-history needs.
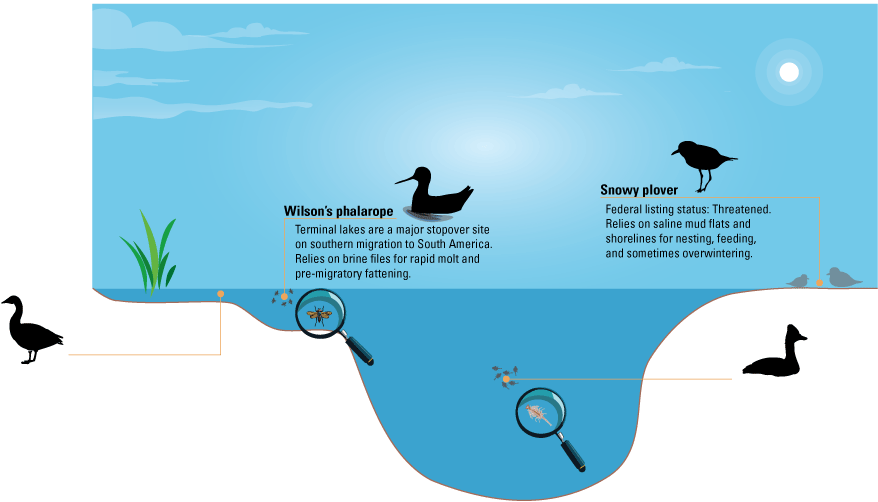
Cross-section diagram showing lake and adjacent wetland with habitat use and life-history information on tule white-fronted goose (Anser albifrons elgasi), Wilson's phalarope (Phalaropus tricolor), snowy plover (Charadrius nivosus), and eared grebe (Podiceps nigricollis).
Effects of a Changing Climate
Climate change is causing aridification across the Great Basin, which affects migratory birds. Aridity is a consequence of warmer average temperatures, hotter weather extremes, reduced precipitation, and drier air and soil conditions compared to historical conditions, and increasing aridity exacerbates severe drought (Overpeck and Udall, 2020). Surface-water quantity, including annual average lake levels, have been decreasing since the early 2000s (Wurtsbaugh and others, 2017; Wang and others, 2018; Foroumandi and others, 2022). Current “megadrought” conditions include reduced precipitation, which drastically alters hydrologic regimes in terminal lakes (Dai, 2013), and this alteration is expected to worsen (Martin and others, 2020; Overpeck and Udall, 2020). Average temperatures in the Great Basin have increased by 0.7 to 1.4 degrees Celsius (°C) since 1985 (Snyder and others, 2019), which has increased regional aridity with fewer days of snow cover (Hall and others, 2023), earlier snowmelt (Snyder and others, 2019), and decreased streamflow (Dettinger, 2005; Hidalgo and others, 2009). Human water use results in surface-water diversions and groundwater pumping that affect terminal lakes (Wang and others, 2018; Foroumandi and others, 2022). Regionally, climatic air temperature increases are likely to further stress migratory birds and other wildlife and their habitats. The management of water resources to maintain sustainable ecosystems will be challenged by rapid shifts between extreme meteorologic and hydrologic drought and intensified precipitation regimes.
Science Strategy for Terminal Lakes of the Great Basin
The Terminal Lakes of the Great Basin Science Strategy (hereinafter referred to as Science Strategy) uses an integrated science approach to identify the causes and effects of changing water availability on terminal lakes and migratory birds and other wildlife that depend on a mosaic of aquatic and terrestrial habitats at local and regional scales. The integrated approach uses experts from multiple scientific disciplines from Federal, State, Tribal, and NGO interests, includes proactive and coordinated partner engagement, and uses FAIR data principles—Findability, Accessibility, Interoperability, Reusability—coupled with advanced technology to co-develop actionable science outcomes to inform management decisions. Overarching goals for implementation of Saline Lake Ecosystems IWAAs identified, and partially fulfilled in this document, include scientific leadership and collaborative implementation (see “Terminal Lakes of the Great Basin Science Strategy Goals” sidebar).
Terminal Lakes of the Great Basin Science Strategy Goals
The USGS Terminal Lakes Science Strategy team identified the following five primary goals to be achieved collectively with partners:
-
Goal 1. Provide a scientific and strategic direction for this multidisciplinary initiative.
-
Goal 2. Formulate an adaptive implementation framework that is informed by ongoing partner coordination and data interpretation, and that allows for continual assessment of science priorities and objectives.
-
Goal 3. Identify integrated science priorities that are relevant to partner needs and that provide timely and actionable science to inform decision-making.
-
Goal 4. Use clearly defined and transparent data sharing, integration, and management practices that foster accessibility for partners.
-
Goal 5. Promote science communication and partner engagement across the Great Basin.
Integrated Science Approach for Complex Challenges
The Saline Lake Ecosystems IWAAs integrated science approach includes co-developing actionable science outcomes that leverage partners’ knowledge and can adapt to new information and evolving prioritization. Actionable science requires established adaptive-feedback mechanisms to support use of science by resource managers as they address complex problems. Hydrological and ecological data and integrated interpretations of these data are needed to further our understanding of the resilience of terminal lake ecosystems. Adaptive management actively engages with partners to (1) frame critical decisions and articulate key uncertainties (Runge and others, 2011; Rushing and others, 2020; Stantial and others, 2023), (2) design monitoring approaches that provide high-value data (Lindenmayer and Likens, 2009), (3) foster innovation, (4) collaboratively set goals, and (5) assist interagency teams in evaluation and iteration efforts during planning and implementation phases (Williams and others, 2009). Actionable science includes not only published science products, such as data and tools, but also includes working with partners to offer guidance and solicit input about how they might use scientific information (Beier and others, 2017). Partners have indicated that integrated hydrological and ecological knowledge can help to inform management decisions about the timing, amount, and quality of water inflow to different terminal lake ecosystems required to support healthy ecosystems for migratory birds. Partners are integral members of a team and co-create actionable science by jointly establishing research priorities and designing and implementing science activities (Beier and others, 2017).
Advanced Data Science and Information Technology
Advanced data science and information technology (defined here as cloud-based data exploration, visualization, and processing) support co-production and actionable science by using the best available data management, analysis, and dissemination to address complex multicomponent problems (Carter and others, 2020). Additionally, advanced data science and information technology incorporate FAIR data principles—Findability, Accessibility, Interoperability, and Reusability. Findability relies on data-generating organizations to establish persistent identifiers that point to their data, which are described in sufficient detail to support Reusability. Accessibility means that the data are easily accessed by others in open online formats. Interoperability means that the data are formatted or harmonized in ways that include shared languages that describe similar data between data-generating organizations to facilitate combination of the data in meaningful ways. Reusability provides clear understanding of data provenance, attributes, and usage (Wilkinson and others, 2016). Benefits of incorporating advanced data science and information technology at scale, including the FAIR principles, include reduced cost, increased efficiency, increased transparency, and timely and reliable delivery of science information.
Conceptual Model of an Interconnected System
The Science Strategy is built from a hierarchical spatial framework at three nested scales (spatial extents) for terminal lakes in the Great Basin: (1) lake, (2) watershed, and (3) regional (figs. 7 and 8). Lake spatial extent is the open water part of the lake and adjacent aquatic environments. Water availability foci at this extent are related to water quality. Habitat foci are related to the types, amount, and resources at lake habitats. Bird foci are evaluation of bird behavior and life stages. Watershed spatial extent includes all water that exists within the defined watershed. Water availability foci are related to natural and human water use. Habitat foci are composition, including species diversity and distribution. Bird foci are selection—or how the birds use the watershed. Regional spatial extent is the Great Basin study area. Water availability foci are related to the spatial distribution and timing of water inflows. Habitat foci are related to how habitats are configured and repeated across the region. Bird foci are related to how birds move throughout the region. This conceptual model is offered to provide a unified understanding that identifies the components of water availability that most significantly influence processes and functions of habitats and birds at each of the spatial extents. This conceptual model is focused on the Great Basin, but it is important to recognize that the Great Basin is part of the larger Central and Pacific Flyways for migrating birds and therefore is not considered a closed system such that birds exit and enter the region and rely on different habitats for different life stages.
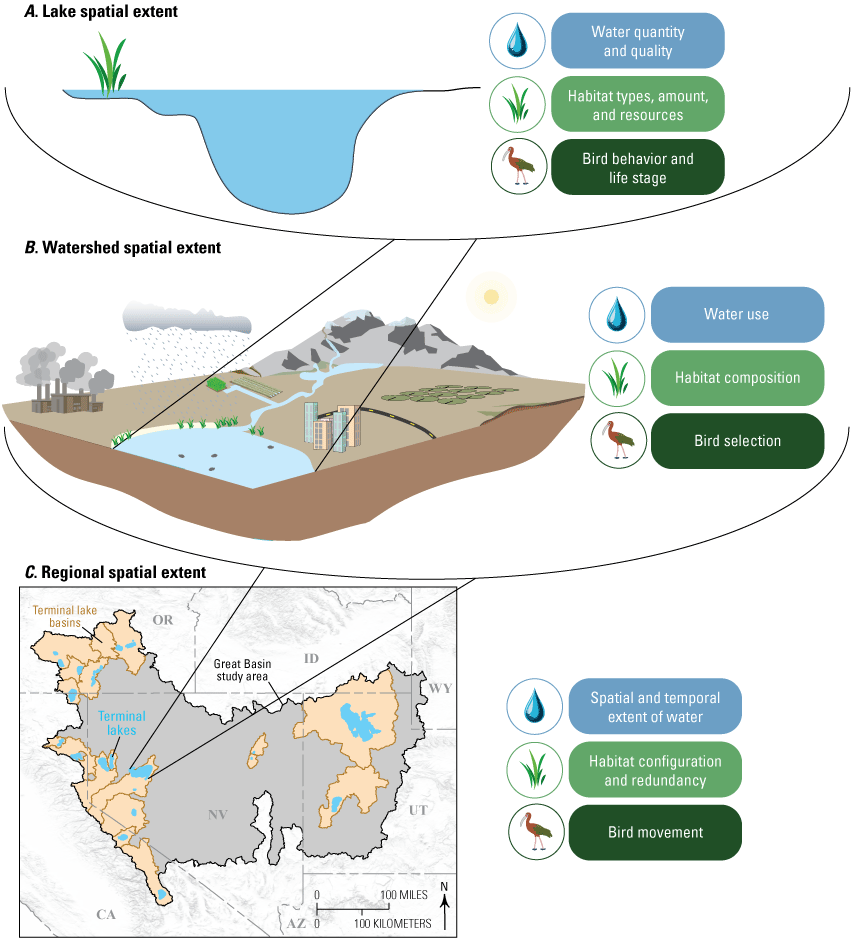
Three diagrams showing (A) lake, (B) watershed, and (C) regional spatial extents and water availability, habitat, and bird foci at each extent.
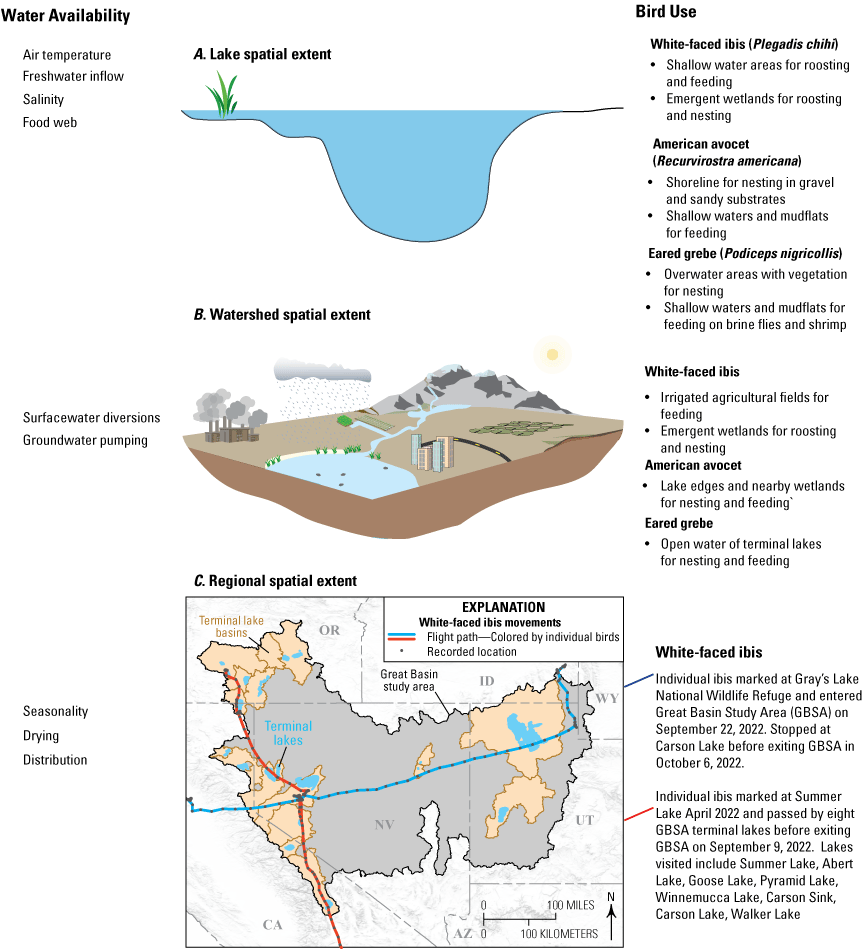
Three diagrams showing (A) lake, (B) watershed, and (C) regional spatial extents that include details on water availability and bird use based on the foci of each extent. Diagrams present details on how three bird species—white-faced Ibis (Plegadis chihi), American avocet (Recurvirostra americana), and eared grebe (Podiceps nigricollis)—use habitats across each of the three spatial extents.
The focus at the lake spatial extent is to understand the linkages between water quantity and water quality and how these linkages influence the type and amount of habitats and the resources they provide, which ultimately influences bird usage at different life stages (fig. 7A). In the terminal lakes of the Great Basin, changes in water quality are commonly associated with fluctuations in water quantity, where less water results in the concentration of dissolved constituents that can change the character of water and its ability to sustain productive and healthy ecosystems (fig. 8A). For example, increases in salinity as lake levels decline changes the ability of lake habitats to support bird populations as food webs are altered. Other physical relations linking water quantity to water quality include lake circulation, mixing, stratification, sedimentation, and reduction-oxidation processes.
At the watershed spatial extent, lakes exist within a defined watershed and water availability is affected by water use across the watershed. Water is primarily used for agriculture in watersheds of the Great Basin. Agricultural fields also act as waterbird habitat in these watersheds (Donnelly and others, 2020). The size, distribution, and permanence of natural or man-made aquatic habitats are unique to each watershed and are influenced by water use in the watershed. How water is used affects the watershed, as it can alter habitat composition of wetlands and may alter birds’ habitat selection (fig. 8B).
The regional spatial extent is characterized by water availability across the network of lakes and watersheds over space and time. Water availability influences the distribution and persistence of aquatic habitats across the Great Basin (fig. 7C). Habitat conditions at terminal lakes and associated aquatic habitats are often highly variable seasonally and across years, affecting the availability of necessary bird resources such as food and or cover. Similarly, life-history stages of birds also vary seasonally and across years, and often result in overlapping or different ecological needs through time. With diverse populations of birds using the mosaic of open water and wetland habitats throughout the seasons for different purposes, documenting these birds’ dependence on different parts of the regional ecosystem in space and time across the Great Basin will aid in identifying conservation actions for these bird populations.
Hydrological and ecological traits across Great Basin terminal lakes create a mosaic of habitats that can operate as a network that supports various species and their life-history needs. Variation in habitat conditions, bird population demography, and individual bird selection for specific lakes or habitats manifest through bird movements. Tracking bird movements of unique species establishes how remote areas are connected (fig. 8C). Changes in the timing of water available to habitats, resilience of the habitats to changes, or complete loss of habitat functions jeopardizes stability of bird populations dependent on flyway connectivity. A view of the region’s spatial extent for the Great Basin terminal lake system from the perspective of bird movement shows the context of management and conservation actions across the region (fig. 8C).
Priorities for an Integrated Science Strategy
The suite of habitats available to birds and other wildlife associated with terminal lakes in the Great Basin is tied to water availability. Changing climate and other factors create multiple stressors at lake, watershed, and regional spatial extents. Changes to one process in the coupled hydroecological system can ultimately have effects on all subsequent processes in and across the system. For example, reductions in water quantity can affect water quality and salinity, and in turn, affect habitats and ultimately various bird species by changing habitat value (fig. 3). Identifying factors that produce changes at and between scales may help to inform management actions to reduce disturbances.
Thresholds and tipping points are also factors influencing ecosystem state and productivity at lake, watershed, and regional scales. Thresholds indicate when changes in the functional response of ecosystems (macroinvertebrates, plants, and birds) are expected (Dakos, 2018; van Wijk and others, 2023). Tipping points indicate abrupt and sometimes irreversible changes in ecosystem state and can represent catastrophic failure in ecosystem function (Dakos, 2018). For example, increases in turbidity and nutrient availability can shift shallow lakes from macrophyte-dominated to phytoplankton-dominated (van Wijk and others, 2023), a transition that partners described as having occurred during the early 1990s in Malheur Lake, which likely reduced optimal food availability for waterbirds. Shared understanding of hydrologic and ecologic thresholds and tipping points at each of and between the nested scales helps to determine system responses but can also help to identify actions to avoid catastrophic failures. As an example, phragmites (Phragmites sp.; a common reed grass) invading 25 percent of the area of a wetland would represent a state where treatment options remain feasible, whereas phragmites invading 100 percent of the area of a wetland would represent an irreversible shift in habitat function where management action is unrealistic. Similarly, critical turbidity and nutrient levels may be present where management options remain feasible to promote macrophyte re-establishment (van Wijk and others, 2023). These examples highlight specific issues that fit within thematic science priorities (see “Science Questions” sidebar).
Science Questions
Based on the outcomes of the literature review, gap analysis, and partner engagements, we identified five thematic science questions that together capture the breadth of inquiry necessary to adequately understand the terminal lakes ecosystems, the dynamics of change, and implications for resource management. An integrated hydroecological characterization of the terminal lake ecosystems is lacking across the Great Basin; understanding what resources are available and how these resources change over seasons and over longer periods would help to identify areas that may be more resilient or more vulnerable. Mechanistic understanding of change would help researchers to target specific monitoring and information gathering for increased value of information. Combining this information would help to identify locations on the landscape where management activities would have the longest or greatest effect on conservation or restoration of habitat.
Thematic science priorities:
-
1. What is the water budget for each terminal lake, adjacent aquatic environments, and basin-wide water use?
-
2. What are the hydrologic vulnerabilities of the lakes and what lakes are susceptible to different vulnerabilities?
-
3. What are the primary resources used by representative bird taxa at terminal lakes and how are these resources changing over time?
-
4. What causes change in bird distribution/abundance/densities and bird use of terminal lakes?
-
5. How much water is needed to sustain quality habitat for birds and other wildlife now and in the future?
State of the Science for the Great Basin
The Science Strategy has been informed by assessing available literature and engaging with partners across the Great Basin. Current and past hydrological and ecological data collection and scientific assessments, coupled with management decision points, help to identify current understanding and information gaps. Integrating the scientific knowledge with future management priorities helps to ensure that this strategy will target studies that provide actionable information.
To assess current and historical understanding of the hydrology and ecology of the terminal lakes in the Great Basin, a group conducted an extensive literature review and synthesis. To capture the publicly available information on Great Basin terminal lakes, we searched Google Scholar and Scopus using hydrological search terms (such as evapotranspiration, surface water, water use, and bathymetry) and ecological search terms (such as waterbird, shorebird, eared grebe, and Wilson's phalarope). This provided more than 900 relevant publications that were fully reviewed. Hydrological and ecological scientific reports were topically categorized to identify available information (app. 1). Data, including a list of all manuscripts reviewed, are available in Herring and others (2023).
The engagement of partners across the Great Basin enabled their ongoing scientific work to inform the Science Strategy and for that strategy to incorporate an understanding of information needs. Three partner workshops were held with State and Federal land and resource-management agencies; universities; NGOs; Tribes; and associated conservation, agricultural, and land-use groups (number [n] = 122 total non-USGS participants). The three meetings covered different geographic areas where terminal lakes are located and included California and Nevada (October 18–19, 2022), Utah (November 1–2, 2022), and Oregon (November 8–9, 2022). Partner workshops were used to (1) meet terminal lakes interest groups, (2) identify ongoing environmental data-collection activities, and (3) determine scientific monitoring and assessment needs. A more complete description of the partner engagement workshops is available in appendix 3.
The partner workshops and other engagements helped to identify what scientific information is needed to inform management decisions. Workshop participants identified specific needs related to the understanding of ecological responses to reducing or increasing the amount of water available to the terminal lakes ecosystems and understanding the response time to management actions such as upstream water retention. Managers also identified the need for comprehensive information on a wider variety of bird species and an understanding of where, when, and why birds are using different areas of the landscape. Additional information about water use in a terminal lake watershed and what constitutes a quality habitat was also important to managers. Managers expressed concerns that global climate prediction models were not suitable for the terminal lakes and watershed scales. Partners also identified data-science challenges, noting that each location or action requires different data to inform management decisions, but that too much data makes data management and synthesis difficult.
During the partner meetings, participants ranked five topical hydrologic and ecologic priorities informed by the literature review and comprising multiple components. Participants were asked to rank in importance different hydrologic topics, including water budgets, water use, lake/wetland surface water, hydrologic vulnerability, and water quality. Partners also ranked five ecologic topic priorities: (1) habitat, (2) waterbird dispersal among terminal lakes, (3) waterbird population abundance/trend, (4) food/prey availability, and (5) species of concern. A more detailed description of the priority identification and ranking processes in available in appendixes 1 and 3.
Information and knowledge gaps at different spatial and temporal scales were identified by combining results from the literature review and partner engagements (app. 1 and 3). The gaps are presented at the three conceptualized spatial extents. Translatable knowledge acquired from individual lakes and watersheds can be applied to other lakes and watersheds, contributing to understanding across the region. Because partner feedback is qualitative, this list of information gaps is not prioritized.
Prioritization of science activities will necessarily be an iterative process accomplished through collaboration with partners. The identification of priorities should include an analysis of the magnitude of information gaps, the value of the information to be gained, and the relevance for management decisions (Runge and others, 2011; Rushing and others, 2020; Stantial and others, 2023). Implementation of the science activities should be completed in a coordinated effort that allows for different organizations to match their priorities with their capabilities and leverages all organizations’ capabilities.
Monitoring and Assessment Science Needs
The scientific objectives of this assessment are to identify how changing water quantity affects the quality and abundance of habitats supporting continental waterbird populations, and to clarify the scientific monitoring and assessment needs of Great Basin terminal lakes. To accomplish scientific objectives, three paths for information gathering have been identified, including (1) long-term and regionally coherent hydrological and ecological monitoring, (2) targeted research and data collection activities, and (3) evaluation of management actions. Developing an actionable science plan requires consistency and flexibility to be able to understand trends and identify new patterns. Data made available by cooperating partners, as well as data disseminated through the Saline Lake Ecosystems assessment, will be leveraged to advance scientific understanding of terminal lakes and their watersheds.
Operational challenges related to field conditions, logistical constraints, and available equipment can limit increases in scientific knowledge. Data are limited for many of the terminal lakes in the Great Basin because the lakes are generally located in rural areas, far from concentrated populations. Additionally, many of these shallow, playa lakes—such as Harney Lake and Lake Abert in Oregon—are undeveloped, and access infrastructure does not exist, making it difficult to collect hydrological or ecological data. Similarly, unconsolidated mud surrounding the open water parts of terminal lakes can be extensive and thick, impeding access and data collection. Certain lakes can be accessed by airboat; however, this requires highly specialized training to operate and maintain the vessel. Finally, in large terminal lakes, such as Great Salt Lake, during winter, ice sheets can move across the lake surface, destroying platforms or other deployment infrastructure, requiring reestablishment each year. Future efforts to collect hydrological and ecological data at these terminal lakes will require flexibility in how sampling is conducted and solid logistics plans prior to initiating scientific activities.
Long-Term Hydrological and Ecological Monitoring
Long-term co-located hydrological and ecological data collection at strategic locations across the Great Basin will help to disaggregate the effects of changing climatic conditions and management actions on the terminal lakes (Lindenmayer and Likens, 2009). Regional hydrological and ecological fixed-location monitoring networks—comprising stream- and lake-level gages, meteorological stations, water-quality and ecological instrumentation, and individual bird movement tracking equipment—can be used to evaluate patterns in water availability, water suitability, connectivity among the terminal lakes; and patterns of selection among alternative habitat types at scales relevant to management. The co-location of high-frequency data recording and telemetry instrumentation is ideal for measuring and transmitting a variety of parameters—simultaneously, in real time—to examine trends in water and ecological resources in critical areas such as open water extent and depth, agricultural and urban land-use effects, habitat characteristics, impacts from floods and droughts, and wildlife response to management actions.
Other long-term and consistent data collection activities could include comprehensive bird population surveys and extensive habitat/resource quantification. Population survey methods that include evaluations of site occupancy and relative abundance estimates are generally spatially and temporally explicit and can provide seasonal habitat use and be used to model habitat-association patterns across populations; trends can be estimated from repeated surveys. The development of consistent animal movement data will complement habitat use information, showing how birds respond to natural or intended changing conditions across multiple scales. Resource quantification includes measurement or classification methods to categorize and map habitat types, quantify habitat value, and determine food webs.
To understand system dynamics at large scales requires consistent hydrological and ecological monitoring across similarly long time frames, but ideally, data would target key information gaps and uncertainties that provide high-value information (Runge and others, 2011; Rushing and others, 2020; Stantial and others, 2023). To be successful, monitoring efforts for the Saline Lake Ecosystems assessment should be conducted in service to science priorities. Data collection should be based on tractable questions that help to refine conceptual models (Lindenmayer and Likens, 2009, 2010), and partner knowledge and partner data should be integrated to leverage resources. A combination of hydrological and ecological data at relevant scales can provide insight into the water availability and ecological factors that affect bird movement, including occupancy of individual lakes or use of specific habitats.
Targeted Research Activities
In addition to baseline hydrological and ecological monitoring across the Great Basin, non-static, targeted data collection and assessment activities should be conducted to inform process understanding of terminal lake ecosystems. Targeted applied research identifies mechanisms and tests assumptions in order to refine conceptual understanding of terminal lake ecosystems. Identification of these research questions will be informed by the gap analysis (app. 1). Specific research investigations conducted at selected sites will enable greater understanding of fundamental hydrological and ecological processes that can be translated to other sites or scaled up across the region.
Targeted research activities can also help to refine long-term hydrological and ecological monitoring objectives. Targeted research activities can establish reliable proxies for water-quality monitoring and can link remote sensing observations to data-collection activities. Targeted research is also used to guide coordinated field data collection by determining what is necessary to build out coupled hydroecological models based on remotely sensed observations such as indices of land-cover and surface-water extent and quality. A general monitoring and assessment strategy will guide the implementation of integrated research activities (see “Targeted USGS Integrated Research Activities” sidebar).
Targeted USGS Integrated Research Activities
The U.S. Geological Survey (USGS) conducts a wide variety of science that improves understanding of water availability and its effects on ecosystems and society. This work includes data collection and monitoring of aquatic and terrestrial systems; assessment and analysis of patterns, trends, and linkages of hydrological and ecological systems; development and application of predictive models; and delivery of information and decision-making tools to partners. Partners—which include Federal, Tribal, State, and local agencies, non-governmental organizations, and others—use this information to anticipate, assess, react to, and mitigate conditions and effects on changes to water availability. For the Saline Lake Ecosystems Integrated Water Availability Assessment (IWAAs), the USGS has identified integrated research activities—informed by Congressional legislation, partner collaboration, and an extensive gap analysis—to develop short- and long-term solutions to the complex challenges of historically low water levels at terminal lakes and the effects on migratory birds and other wildlife.
Monitoring Strategy
A combination of hydrological and ecological data at relevant scales can provide insight into the water availability and ecological factors that precipitate bird movement, affect occupancy of individual lakes, or use of habitats. The following integrated monitoring activities, at specific study sites, will be targeted by USGS:
-
• Hydrological and ecological lake characterizations across Great Basin terminal lakes to determine the magnitude of seasonal and annual changes to water availability and how these changes affect habitat quantity and quality for bird populations.
-
• Characterization of waterbird movements and habitat use throughout the region for key waterbird species.
Integrated Science Assessments
Integrated science assessments include the development of (1) water budgets, (2) refined conceptual models of the hydrogeologic function at the watershed and lake scale, and (3) a mechanistic understanding of the linkages between water availability and ecological responses. The following USGS integrated research activities will develop tools that:
-
• Estimate the hydrological and ecological resilience of terminal lakes across the Great Basin;
-
• Identify thresholds and tipping points influencing ecosystem state and productivity at lake, watershed, and regional scales; and
-
• Couple existing knowledge with new field data, eco-hydrologic models, and remotely sensed products to inform prioritization of future work across the region.
Additional planning should use the adaptive implementation framework from the Science Strategy to work with partners to determine what actionable science plans USGS could initiate. High priority would ideally be placed on interpretative products from USGS data collection efforts that help to quantify the linkages between water availability, habitat suitability, and bird selection, and to link these data to remotely sensed products. Additional priority science activities that USGS has the capability to target include the following:
-
• Development of methods to track the activities and monitoring results of management actions—such as water management, spraying, grazing, invasive species removal, restoration, and rehabilitation—to help land and species managers determine the effectiveness of their treatments over space and time.
-
• Use of predictive models of water availability, water use, and management actions to understand effects of these actions as well as the effects of climate change on the hydrological and ecological systems at the lake, watershed, and regional scale.
-
• Development of an understanding of mechanism(s) causing spatial heterogeneity in waterbird resource selection and distribution.
-
• Initiation of movement/migratory connectivity studies of waterbirds to understand how they use the Great Basin terminal lakes as a network.
-
• Examination of how factors such as decreased freshwater inflow impact prey densities and prey availability, trophic linkages between salinity-invertebrate abundance, and waterbird habitat selection.
-
• Identification of factors influencing waterbird fitness or demographic consequences in response to spatiotemporal variation in prey within and across terminal lakes.
-
• On-going gap assessment of available bird, habitat, and water data for addressing science priorities.
Assessment of Management Actions
Every year, land- and resource-management agencies carry out hundreds of land treatments throughout the Great Basin for a wide range of reasons. Examples of land treatments include muck removal, species reintroduction, dam removal, invasive species control, post-wildfire rehabilitation, grazing management, and recreational use management. These treatments generate a wealth of information called “management action data.” Specific examples include implementation reports; the monitoring of data before, during, and after treatment; and spatial data files, maps, and images of land treatments. These management actions could be more fully assessed to determine effectiveness of treatment, and results could be more fully shared across the Great Basin to inform future management actions.
Partner Communication and Data Management
Effective communications and data management were highlighted as a priority by partners. This included the priority for timely information sharing to decision-makers in the form of actionable science. Workshop discussions identified a need for integrated data and communication solutions that summarize large amounts of data and deliver information quickly for decision-making. Integrated access to hydrological and ecological data among organizations would increase data accessibility and facilitate information sharing. The workshops identified data from landowners, water boards, State agencies, and researchers as priorities for improved data accessibility. Online portals, data catalogs and repositories can be developed with role-based access to bird, habitat, and water data for analyses to support land and resource management decisions. Some of these online portals already exist and could be expanded to incorporate and integrate information from Saline Lake Ecosystems partners. Additionally, science communication products that describe scientific activities and results are needed to facilitate shared understanding and access to diverse audiences. Increased awareness and understanding of how scientific information is being used to inform decisions will help internal and external audiences see the value, utility, and applicability of the scientific work.
Adaptive Implementation Framework
The Adaptive Implementation Framework (fig. 9) describes the iterative and collaborative process by which partners work together to refine the proposed Saline Lake Ecosystems conceptual model of an interconnected system (figs. 7 and 8) through the co-development of actionable science outcomes that address the complex challenges of limited and highly variable water availability and resultant effects on waterbirds across the Great Basin. The adaptive framework begins with partners identifying key uncertainties from the proposed conceptual model and prioritizing science and information needs that have high value (Lindenmayer and Likens, 2009; Runge and others, 2011) (fig. 9). Workplans are then co-developed and partners conduct science activities, integrate derived information across collaborative science activities, and incorporate scientific findings and partner feedback to adjust subsequent activities (Williams and others, 2009). This adaptive framework provides flexibility for partner organizations to adjust and reprioritize efforts and leverage others’ activities to most effectively address science and information needs to inform management activities and guide policy decisions. For the Saline Lake Ecosystems IWAAs, Stage 1 was initiated by an extensive literature review and gap analysis (app. 1) coupled with partner engagement (app. 3).
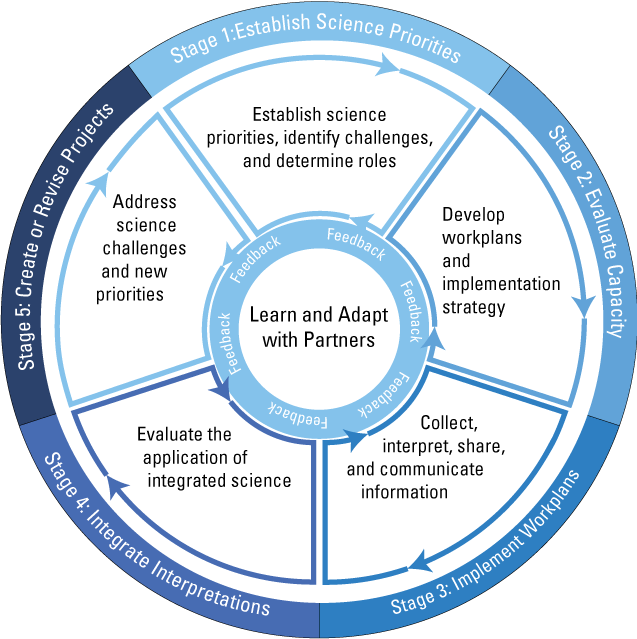
Diagram showing the Adaptive Implementation Framework. The framework is a circle divided into five wedges with directional arrows around the circle and within each wedge to represent a feedback loop. The five stages are (1) Establish Science Priorities, (2) Evaluate Capacity, (3) Implement Workplans, (4) Integrate Interpretations, and (5) Create or Revise Projects. These five stages all meet in the middle at the statement “Learn and Adapt with Partners” surrounded by a ring of “Feedback.”
The problems of water availability to the terminal lake ecosystems of the Great Basin, with their effects on waterbirds and their habitats, are much larger and more complex than any one bureau or institution can address alone. The expertise of Federal agencies, States, NGOs, researchers, Tribes, and other organizations are needed to inform, develop, and carry out relevant and feasible science that will inform land and resource management decisions (fig. 10).
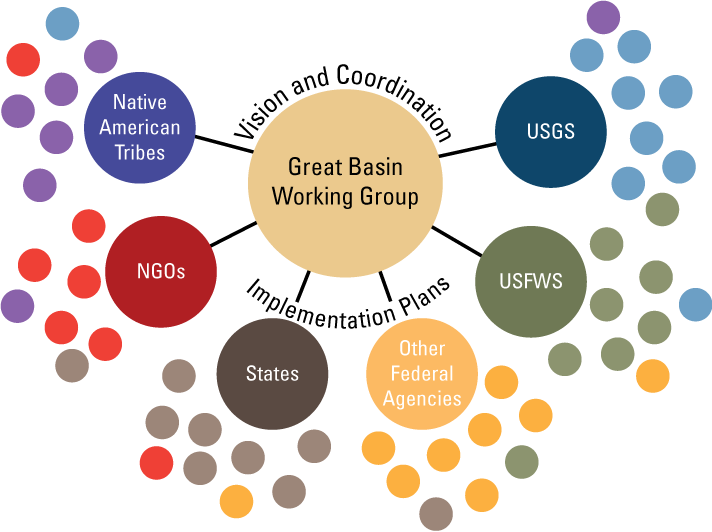
Diagram showing the interconnections between the Great Basin Working Group, partner organizations, and smaller teams. The Great Basin Working Group would be an entity that ties all partners and teams together. Connections would exist at the partner (large circles) and team (small circles) levels around workplans and integrated collaborations. Teams and workplans from multiple partners could be connected in various ways, or multi-partner teams could address a single or multiple related workplans. All Implementation Plans would be connected through the Great Basin Working Group, which would guide the vision and coordination for the scientific activities for terminal lakes of the Great Basin. [NGOs, non-governmental organizations; USFWS, U.S. Fish and Wildlife Service; USGS, U.S. Geological Survey.]
The success of the Adaptive Implementation Framework is dependent on collaborations and co-produced work with partners. Therefore, USGS supports the creation of a Great Basin Working Group that helps to guide the vision and coordinate science activities across the region, agencies and groups, and disciplines to enhance understanding system-wide processes. The Great Basin Working Group would be a non-funded collaborative opportunity for agencies, bureaus, and organizations to identify and work on co-developed priorities. The Great Basin Working Group is a concept and has no charter that outlines shared roles and responsibilities. Primary cooperators do not fund or solely maintain the Great Basin Working Group but should include Federal partners such as the USFWS; BLM; USGS; U.S. Forest Service; Natural Resources Conservation Service; Tribal entities; the States of Utah, Nevada, California, and Oregon; and some regional and local NGOs.
To support the Great Basin Working Group, a regional implementation plan could be co-developed. Regional planning would include identification of key uncertainties to prioritize science activities, determination of partners who are working in the watersheds, and co-development of workplans. Workplans include a compilation of agency and inter-agency work that describe the data collection activities (such as the lakes where discrete and continuous data will be collected, frequency of data collection, etc.), the tools that will be developed (such as water budgets), and the analyses that will be completed (such as food web characterization). Following the Adaptive Implementation Framework, the workplans could change iteratively over time based on new understandings of key uncertainties. The Great Basin Working Group would be tasked to coordinate activities, leverage knowledge and information, iterate and refine the proposed conceptual models (figs. 7 and 8), key uncertainties, and achieve overall partner objectives across the region. Roles and responsibilities for the Great Basin Working Group would be established during the chartering of the group and would serve to establish regional plans that leverage the expertise and capability of the different agencies, bureaus, groups, and Tribes.
We emphasize that within any organizational framework, real or proposed, the iterative process of understanding scientific priorities and capabilities leads to thoughtful application of science. One conceptualization of this process, highlighted in figure 9, is summarized as follows.
Stage 1—Establish Science Priorities
In collaboration with partners, a regional implementation plan will be co-developed to establish a vision for the data, assessment, and tools needed for resource managers. Information needs and science questions would be best based on the current understanding of the proposed conceptual model (fig. 7). Prioritization of science activities will be based on data and information gaps, identification of key uncertainties, relevance for management decisions, and feasibility to accomplish science needs based on resource requirements (see Runge and others, 2011). Through continued partner input and gap analyses, this process will be iteratively updated and prioritized with each cycle of the Adaptive Implementation Framework.
Stage 2—Evaluate Capacity
Agencies will work together to develop workplans to describe general science objectives and outline science activities based on the regional vision. Task-specific workplans will be developed to provide the structure and direction to conduct science activities. Workplans will detail each agency’s roles and responsibilities, what objectives will be accomplished, and timelines for these objectives. Resource requirements—such as general cost, labor, and equipment to address each science priority—will determine whether the collective capacity exists.
Stage 3—Implement Workplans
Teams will conduct multidisciplinary data-collection and assessment activities identified in their workplans. Workplans will be integrated into a broader regional implementation plan that collectively describes the integrated science efforts. Data analyses and interpretations will be communicated broadly across workplans and among the partner working group to facilitate integrated science application.
Stage 4—Integrate Interpretations
The USGS and other partners will combine analyses and interpretations across regional and watershed workplans to integrate information and determine how knowledge can be translated to other areas or across the proposed conceptual model spatial extents (fig. 7). Data-science initiatives may help to provide context and frameworks for evaluating the integration process. At this stage, the Great Basin Working Group will work closely to ensure the synthesized information is adequately addressing key uncertainties and that newly developed tools are understandable and applicable to management at the lake and watershed scale. This process will also identify remaining science gaps.
Stage 5—Create or Revise Projects
Science gaps and partner needs will be used to synthesize remaining science challenges and revisit and identify science priorities. Regional implementation plans and targeted workplans will be evaluated and updated to either continue science activities or initiate new ones to address revised science priorities. Ideally, these evaluations would occur annually with the Great Basin Working Group and would be used to refine the proposed conceptual model (figs. 7 and 8), prioritize key uncertainties, and target resource manager information needs.
Data sharing and communications are paramount in achieving integrated science goals. A proactive, strategic, and continuous dialog with Working Group partners is needed to support a clear understanding of roles, priorities, and activities. Data-management and sharing strategies will be defined by a data management plan and will be designed to facilitate broad participation by leveraging existing data resources and integrating proposed new data-collection efforts, and by targeting communications that support the Great Basin Working Group. The most effective communications would be tailored to reflect information needs of identified audiences through continuous partner engagement. Communication efforts need to be closely coordinated with partners to ensure consistent messaging and timely and reliable delivery of science.
Effective execution of the Saline Lake Ecosystems IWAAs Adaptive Implementation Framework will occur if the Great Basin Working Group and related partners are able to integrate research findings, data streams, and data communication tools into management and monitoring actions or policy planning. This will require flexible application of research and monitoring efforts in response to unforeseen conditions or urgent needs, integration of research and management information obtained by numerous partners, and effective communication of data and findings that are relevant to multiple user groups. Successful adoption of science into partner decision-making processes will also be evident when their identified knowledge gaps and information requirements are updated. This may indicate that research findings, best management practices, and delivery of data interpretation have been sufficient to change partner perceptions or understanding of the system. It may also mean that the study system is changing more rapidly than it can be understood. In either case, adaptive implementation allows incorporation of evolving needs.
Summary
The network of terminal lakes across the Great Basin provides critical habitat for millions of migratory birds and other wildlife. The region also supports people, agriculture, and industry; as an example, the economic value of the Great Salt Lake has been estimated to be about $2 billion per year. These systems are in peril primarily because of reduced freshwater availability at the lake, watershed, and regional scale, resulting from prolonged drought, a warming climate, and surface-water and groundwater use. Understanding how water use decisions have affected terminal lakes and associated watersheds will help guide partners by providing a greater understanding of the likely outcomes of different scenarios. Gathering relevant hydrological and ecological data to inform future actions will be critical to the success of any science strategy. Through a comprehensive literature review, consultation with partners across the region, and existing hydrological and ecological knowledge and expertise, the USGS developed a Science Strategy that is inclusive and forward looking. Success will be measured by iterative refinement of conceptual models, a reduction in key uncertainties, and co-production of new information and scientific tools that support decisions.
References Cited
Allen, C.R., Garmestani, A.S., and Angeler, D.G., 2016, Resilience: Bethesda, Maryland, Oxford University Press [from Environmental Science], accessed November 12, 2023, at https://www.oxfordbibliographies.com/display/document/obo-9780199363445/obo-9780199363445-0048.xml.
Beier, P., Hansen, L.J., Helbrecht, L., and Behar, D., 2017, A how-to guide for coproduction of actionable science: Conservation Letters, v. 10, no. 3, p. 288–296, accessed November 12, 2023, at https://doi.org/10.1111/conl.12300.
Bioeconomics, Inc., 2012, Economic significance of the Great Salt Lake to the State of Utah: Prepared for State of Utah by the Great Salt Lake Advisory Council, Salt Lake City, Utah, 50 p., accessed October 3, 2023, at https://deq.utah.gov/great-salt-lake-advisory-council/activities-great-salt-lake-advisory-council.
Bureau of Land Management, 2023, Our mission—A multiple-use and sustained yield mission: Bureau of Land Management web page, accessed September 29, 2023, at https://www.blm.gov/about/our-mission.
Bureau of Reclamation, 2022, Lahontan Basin Area Office: Bureau of Reclamation web page, accessed April 9, 2023, at https://www.usbr.gov/mp/lbao/programs/newlands-project.html.
Bureau of Reclamation, 2023, Bureau of Reclamation—About us: Bureau of Reclamation web page, accessed September 29, 2023, at https://www.usbr.gov/main/about/mission.html.
Buto, S.G., and Anderson, R.D., 2020, NHDPlus High Resolution (NHDPlus HR)—A hydrography framework for the Nation: U.S. Geological Survey Fact Sheet 2020–3033, 2 p., accessed November 12, 2023, at https://doi.org/10.3133/fs20203033.
Carter, S.K., Pilliod, D.S., Haby, T., Prentice, K.L., Aldridge, C.L., Anderson, P.J., Bowen, Z.H., Bradford, J.B., Cushman, S.A., DeVivo, J.C., Duniway, M.C., Hathaway, R.S., Nelson, L., Schultz, C.A., Schuster, R.M., Trammell, E.J., and Weltzin, J.F., 2020, Bridging the research-management gap—Landscape science in practice on public lands in the western United States: Landscape Ecology, v. 35, no. 3, p. 545–560, accessed November 12, 2023, at 10.1007/s10980-020-00970-5.
Coates, P.S., Ricca, M.A., Prochazka, B.G., Brooks, M.L., Doherty, K.E., Kroger, T., Blomberg, E.J., Hagen, C.A., and Casazza, M.L., 2016, Wildfire, climate, and invasive grass interactions negatively impact an indicator species by reshaping sagebrush ecosystems: Proceedings of the National Academy of Sciences of the United States of America, v. 113, no. 45, p. 12745–12750, accessed November 12, 2023, at https://doi.org/10.1073/pnas.1606898113.
Dai, A.G., 2013, Increasing drought under global warming in observations and models: Nature Climate Change, v. 3, no. 1, p. 52–58, accessed November 12, 2023, at https://doi.org/10.1038/nclimate1633.
Dakos, V., 2018, Ecological transitions— Regime shifts, thresholds, and tipping points: Oxford University Press [from Environmental Science], accessed November 12, 2023, at https://www.oxfordbibliographies.com/display/document/obo-9780199363445/obo-9780199363445-0108.xml.
Davies, G.E., and Naranjo, R.C., 2022, Estimated effects of pumping on groundwater storage and Walker River stream efficiencies in Smith and Mason Valleys, west-central Nevada: U.S. Geological Survey Scientific Investigations Report 2022–5123, 49 p., accessed November 12, 2023, at https://doi.org/10.3133/sir20225123.
Dettinger, M., 2005, Changes in streamflow timing in the western United States in recent decades: U.S. Geological Survey Fact Sheet 2005–3018, 4 p., accessed November 12, 2023, at https://pubs.er.usgs.gov/publication/fs20053018.
Dettinger, M., Udall, B., and Georgakakos, A., 2015, Western water and climate change: Ecological Applications, v. 25, no. 8, p. 2069–2093, accessed November 12, 2023, at https://doi.org/10.1890/15-0938.1.
Dickinson, W.R., 2006, Geotectonic evolution of the Great Basin: Geosphere, v. 2, no. 7, p. 353–368, accessed November 12, 2023, at https://doi.org/10.1130/GES00054.1.
Dieter, C.A., Maupin, M.A., Caldwell, R.R., Harris, M.A., Ivahnenko, T.I., Lovelace, J.K., Barber, N.L., and Linsey, K.S., 2018, Estimated use of water in the United States in 2015: U.S. Geological Survey Circular 1441, 65 p., accessed November 12, 2023, at https://doi.org/10.3133/cir1441. [Supersedes USGS Open-File Report 2017–1131.]
Donnelly, J.P., King, S.L., Silverman, N.L., Collins, D.P., Carrera-Gonzalez, E.M., Lafon-Terrazas, A., and Moore, J.N., 2020, Climate and human water use diminish wetland networks supporting continental waterbird migration: Global Change Biology, v. 26, no. 4, p. 2042–2059, accessed November 12, 2023, at https://doi.org/10.1111/gcb.15010.
Donnelly, J.P., Moore, J.N., Casazza, M.L., and Coons, S.P., 2022, Functional wetland loss drives emerging risks to waterbird migration networks: Frontiers in Ecology and Evolution, v. 10, 18 p., accessed November 12, 2023, at https://doi.org/10.3389/fevo.2022.844278.
Downard, R., Frank, M., Perkins, J., Kettenring, K., and Larese-Casanova, M., 2017, Wetland plants of Great Salt Lake—A guide to identification, communities, and bird habitat: Logan, Utah State University Extension. [Also available at https://digitalcommons.usu.edu/extension_curall/1761.]
ECONorthwest, 2019, Assessment of potential costs of declining water levels in Great Salt Lake: Prepared for State of Utah by the Great Salt Lake Advisory Council, Salt Lake City, Utah, 86 p., accessed October 3, 2023, at https://deq.utah.gov/great-salt-lake-advisory-council/activities-great-salt-lake-advisory-council.
Evenson, E.J., Orndorff, R.C., Blome, C.D., Böhlke, J.K., Hershberger, P.K., Langenheim, V.E., McCabe, G.J., Morlock, S.E., Reeves, H.W., Verdin, J.P., Weyers, H.S., and Wood, T.M., 2013, U.S. Geological Survey water science strategy—Observing, understanding, predicting, and delivering water science to the Nation: U.S. Geological Survey Circular 1383G, 63 p., accessed November 12, 2023, at https://doi.org/10.3133/cir1383G.
Foroumandi, E., Nourani, V., and Kantoush, S., 2022, Investigating the main reasons for the tragedy of large saline lakes—Drought, climate change, or anthropogenic activities? A call to action: Journal of Arid Environments, v. 196, 11 p., accessed November 12, 2023, at https://doi.org/10.1016/j.jaridenv.2021.104652.
Fritze, H., Stewart, I.T., and Pebesma, E., 2011, Shifts in Western North American snowmelt runoff regimes for the recent warm decades: Journal of Hydrometeorology, v. 12, no. 5, p. 989–1006, accessed November 12, 2023, at https://doi.org/10.1175/2011JHM1360.1.
Galat, D.L., 1990, Seasonal and long-term trends in Truckee River nutrient concentrations and loadings to Pyramid Lake, Nevada—A terminal saline lake: Water Research, v. 24, no. 8, p. 1031–1040, accessed November 12, 2023, at https://doi.org/10.1016/0043-1354(90)90126-Q.
Global Biodiversity Information Facility [GBIF], 2022, GBIF occurrence download: Copenhagen, Denmark, GBIF database, accessed October 3, 2022, at https://doi.org/10.15468/dl.fyt6w4.
Haig, S.M., Murphy, S.P., Matthews, J.H., Arismendi, I., and Safeeq, M., 2019, Climate-altered wetlands challenge waterbird use and migratory connectivity in arid landscapes: Scientific Reports, v. 9, 10 p., accessed November 12, 2023, at https://doi.org/10.1038/s41598-019-41135-y.
Hall, D.K., Kimball, J.S., Larson, R., DiGirolamo, N.E., Casey, K.A., and Hulley, G., 2023, Intensified warming and aridity accelerate terminal lake desiccation in the Great Basin of the Western United States: Earth and Space Science, v. 10, no. 1, 20 p., accessed November 12, 2023, at https://doi.org/10.1029/2022EA002630.
Herbst, D.B., 1999, Biogeography and physiological adaptations of the brine fly genus Ephydra (Diptera: Ephydridae) in saline waters of the Great Basin: The Great Basin Naturalist, v. 59, no. 2, p. 127–135, accessed November 12, 2023, at https://www.jstor.org/stable/41713096.
Herbst, D.B., 2006, Salinity controls on trophic interactions among invertebrates and algae of solar evaporation ponds in the Mojave Desert and relation to shorebird foraging and selenium risk: Wetlands, v. 26, no. 2, p. 475–485, accessed November 12, 2023. https://doi.org/10.1672/0277-5212(2006)26[475:SCOTIA]2.0.CO;2
Herring, G., Aldridge, C.L., Whipple, A.L., Eagles-Smith, C.A., Pulver, B.A., Inman, R.D., Matchett, E.L., Monroe, A.P., Orning, E.K., Robb, B.S., Shyvers, J.E., Tarbox, B.C., Van Schmidt, N.D., Smith, C.D., Holloran, M.J., Overton, C.T., O’Leary, D.R., Casazza, M.L., and Frus, R.J., 2023, Bibliography of hydrological and ecological research in the Great Basin terminal lakes, USA: U.S. Geological Survey data release, accessed November 12, 2023, at https://doi.org/10.5066/P9G5CGA7.
Hidalgo, H.G., Das, T., Dettinger, M.D., Cayan, D.R., Pierce, D.W., Barnett, T.P., Bala, G., Mirin, A., Wood, A.W., Bonfils, C., Santer, B.D., and Nozawa, T., 2009, Detection and attribution of streamflow timing changes to climate change in the Western United States: Journal of Climate, v. 22, no. 13, p. 3838–3855, accessed November 12, 2023, at https://doi.org/10.1175/2009JCLI2470.1.
Holling, C.S., 1973, Resilience and stability of ecological systems: Annual Review of Ecology and Systematics, v. 4, no. 1, p. 1–23, accessed November 12, 2023, at https://doi.org/10.1146/annurev.es.04.110173.000245.
Intergovernmental Panel on Climate Change, 2007, Impacts, adaptation and vulnerability—Contribution of Working Group II to the Fourth Assessment Report of the Intergovernmental Panel on Climate Change: Cambridge, United Kingdom, Cambridge University Press, 976 p., accessed November 12, 2023, at https://www.ipcc.ch/report/ar4/wg2/.
Jehl, J.R., Jr., 1988, Biology of the eared grebe and Wilson’s phalarope in the nonbreeding season—A study of adaptions to saline lakes: San Diego, California, Sea World Research Institute, Studies in Avian Biology No. 12, p. 1–74. [Also available at https://sora.unm.edu/sites/default/files/journals/sab/sab_012.pdf.]
Kohl, J.D., Casazza, M.L., Overton, C.T., Herzog, M.P., Ackerman, J.T., Feldheim, C.L., and Eadie, J.M., 2022, Postbreeding movements and molting ecology of female gadwalls and mallards: Journal of Wildlife Management, v. 86:e22314, no. 8, accessed November 12, 2023, at https://doi.org/10.1002/jwmg.22314.
Lahontan Valley Environmental Alliance, 2009, The Truckee Canal—Water for a sustainable future: Prepared by the Truckee Canal White Paper Working Group for the Lahontan Valley Environmental Alliance, accessed April 11, 2023, at https://www.leg.state.nv.us/App/NELIS/REL/77th2013/ExhibitDocument/OpenExhibitDocument?exhibitId=8455&fileDownloadName=h0404ab310r_grat.pdf.
Larson, R., Eilers, J., Kreuz, K., Pecher, W.T., DasSarma, S., and Dougill, S., 2016, Recent desiccation-related ecosystem changes at Lake Abert, Oregon—A terminal alkaline salt lake: Western North American Naturalist, v. 76, no. 4, p. 389–404, accessed November 12, 2023, at https://www.jstor.org/stable/44651214.
Lindenmayer, D.B., and Likens, G.E., 2009, Adaptive monitoring—A new paradigm for long-term research and monitoring: Trends in Ecology & Evolution, v. 24, no. 9, p. 482–486, accessed November 12, 2023, at https://doi.org/10.1016/j.tree.2009.03.005.
Lindenmayer, D.B., and Likens, G.E., 2010, The science and application of ecological monitoring: Biological Conservation, v. 143, no. 6, p. 1317–1328, accessed November 12, 2023, at https://doi.org/10.1016/j.biocon.2010.02.013.
Lopes, T.J., and Allander, K.K., 2009, Water budgets of the Walker River Basin and Walker Lake, California and Nevada: U.S. Geological Survey Scientific Investigations Report 2009–5157, 44 p., accessed November 12, 2023, at https://pubs.usgs.gov/sir/2009/5157/pdf/sir20095157.pdf.
Martin, J.T., Pederson, G.T., Woodhouse, C.A., Cook, E.R., McCabe, G.J., Anchukaitis, K.J., Wise, E.K., Erger, P.J., Dolan, L., McGuire, M., Gangopadhyay, S., Chase, K.J., Littell, J.S., Gray, S.T., George, S.S., Friedman, J.M., Sauchyn, D.J., St-Jacques, J.M., and King, J., 2020, Increased drought severity tracks warming in the United States’ largest river basin: Proceedings of the National Academy of Sciences of the United States of America, v. 117, no. 21, p. 11328–11336, accessed November 12, 2023, at https://doi.org/10.1073/pnas.1916208117.
Miller, O.L., Miller, M.P., Longley, P.C., Alder, J.R., Bearup, L.A., Pruitt, T., Jones, D.K., Putman, A.L., Rumsey, C.A., and McKinney, T., 2021, How will baseflow respond to climate change in the Upper Colorado River Basin?: Geophysical Research Letters, v. 48, no. 22, 11 p., accessed November 12, 2023, at https://doi.org/10.1029/2021GL095085.
Miller, O.L., Putman, A.L., Alder, J., Miller, M., Jones, D.K., and Wise, D.R., 2021, Changing climate drives future streamflow declines and challenges in meeting water demand across the southwestern United States: Journal of Hydrology X, v. 11, 16 p., accessed November 12, 2023, at https://doi.org/10.1016/j.hydroa.2021.100074.
Moore, J.N., 2016, Recent desiccation of Western Great Basin saline lakes—Lessons from Lake Abert, Oregon, USA: Science of the Total Environment, v. 554–555, p. 142–154, accessed November 12, 2023, at https://doi.org/10.1016/j.scitotenv.2016.02.161.
Overpeck, J.T., and Udall, B., 2020, Climate change and the aridification of North America: Proceedings of the National Academy of Sciences of the United States of America, v. 117, no. 22, p. 11856–11858, accessed November 12, 2023, at https://doi.org/10.1073/pnas.2006323117.
Runge, M.C., Converse, S.J., and Lyons, J.E., 2011, Which uncertainty? Using expert elicitation and expected value of information to design an adaptive program: Biological Conservation, v. 144, no. 4, p. 1214–1223, accessed November 12, 2023, at https://doi.org/10.1016/j.biocon.2010.12.020.
Rushing, C.S., Rubenstein, M., Lyons, J.E., and Runge, M.C., 2020, Using value of information to prioritize research needs for migratory bird management under climate change—A case study using federal land acquisition in the United States: Biological Reviews, v. 95, p. 1109–1130, accessed November 12, 2023, at https://doi.org/10.1111/brv.12602.
Senner, N.R., Moore, J.N., Seager, S.T., Dougill, S., Kreuz, K., and Senner, S.E., 2018, A salt lake under stress—Relationships among birds, water levels, and invertebrates at a Great Basin saline lake: Biological Conservation, v. 220, p. 320–329, accessed November 12, 2023, at https://doi.org/10.1016/j.biocon.2018.02.003.
Shrestha, D., Brown, J.F., Benedict, T.D., and Howard, D.M., 2021, Exploring the regional dynamics of U.S. irrigated agriculture from 2002 to 2017: Land, v. 10, no. 4, article 394, accessed November 12, 2023, at https://doi.org/10.3390/land10040394.
Skagen, S.K., Brown, S., and Johnson, R., 2005, Implications of different shorebird migration strategies for habitat conservation, in Bird conservation implementation and integration in the Americas—Proceedings of the Third International Partners in Flight Conference: U.S. Forest Service, Pacific Southwest Research Station, p. 680–683. [Also available at https://www.fs.usda.gov/psw/publications/documents/psw_gtr191/psw_gtr191_0680-0683_skagen.pdf.]
Snyder, K.A., Evers, L., Chambers, J.C., Dunham, J., Bradford, J.B., and Loik, M.E., 2019, Effects of changing climate on the hydrological cycle in cold desert ecosystems of the Great Basin and Columbia Plateau: Rangeland Ecology and Management, v. 72, no. 1, p. 1–12, accessed November 12, 2023, at https://doi.org/10.1016/j.rama.2018.07.007.
Solander, K.C., Bennett, K.E., Fleming, S.W., and Middleton, R.S., 2019, Estimating hydrologic vulnerabilities to climate change using simulated historical data—A proof-of-concept for a rapid assessment algorithm in the Colorado River Basin: Journal of Hydrology—Regional Studies, v. 26, 100642, 16 p., accessed November 12, 2023, at https://doi.org/10.1016/j.ejrh.2019.100642.
Stantial, M.L., Lawson, A.J., Fournier, A.M.V., Kappes, P.J., Kross, C.S., Runge, M.C., Woodrey, M.S., and Lyons, J.E., 2023, Qualitative value of information provides a transparent and repeatable method for identifying critical uncertainty: Ecological Applications, v. 33, no. 4, 15 p., accessed November 12, 2023, at https://doi.org/10.1002/eap.2824.
SWCA, 2012, Definition and assessment of Great Salt Lake health: Prepared for State of Utah Great Salt Lake Advisory Council, Salt Lake City, Utah, 90 p., accessed October 3, 2023, at https://deq.utah.gov/great-salt-lake-advisory-council/activities-great-salt-lake-advisory-council.
Tavernia, B.G., Meehan, T., Neill, J., and Luft, J., 2021, Hydrology affects shorebirds, waterfowl, and other waterbirds at Bear River Bay, a globally important bird area: Journal of Field Ornithology, v. 92, no. 4, p. 388–401, accessed November 12, 202, at. https://doi.org/10.1111/jofo.12381.
Udall, B., and Overpeck, J., 2017, The twenty-first century Colorado River hot drought and implications for the future: Water Resources Research, v. 53, no. 3, p. 2404–2418, accessed November 12, 2023, at https://doi.org/10.1002/2016WR019638.
U.S. Census Bureau, 2023a, Davis County, Utah: U.S. Census Bureau database, accessed February 21, 2023, at https://data.census.gov/profile/Davis_County,_Utah?g=0500000US49011.
U.S. Census Bureau, 2023b, Reno, NV metro area: U.S. Census Bureau database, accessed February 21, 2023, at https://data.census.gov/profile/Reno,_NV_Metro_Area?g=310XX00US39900.
U.S. Census Bureau, 2023c, Salt Lake County, Utah: U.S. Census Bureau database, accessed February 21, 2023, at https://data.census.gov/profile/Salt_Lake_County,_Utah?g=0500000US49035.
U.S. Census Bureau, 2023d, Utah County, Utah: U.S. Census Bureau database, accessed February 21, 2023, at https://data.census.gov/profile/Utah_County,_Utah?g=0500000US49049.
U.S. Census Bureau, 2023e, Weber County, Utah: U.S. Census Bureau database, accessed February 21, 2023, at https://data.census.gov/profile/Weber_County,_Utah?g=0500000US49057.
U.S. Fish and Wildlife Service, 2023, Mission and vision: U.S. Fish and Wildlife Service web page, accessed September 29, 2023, at https://www.fws.gov/about/mission-and-vision.
U.S. Geological Survey (USGS) Gap Analysis Project, (GAP), 2022, Protected areas database of the United States (PAD-US) 3.0: U.S. Geological Survey data release, accessed March 1, 2023, at https://doi.org/10.5066/P9Q9LQ4B.
van Wijk, D., Chang, M., Janssen, A.B.G., Teurlincx, S., and Mooij, W.M., 2023, Regime shifts in shallow lakes explained by critical turbidity: Water Research, v. 242, 13 p., accessed April 13, 2023, at https://doi.org/10.1016/j.watres.2023.119950.
Vidal, N., Yu, J.L., Gutierrez, M.F., de Mello, F.T., Tavsanoglu, U.N., Cakiroglu, A.I., He, H., Meerhoff, M., Brucet, S., Liu, Z.W., and Jeppesen, E., 2021, Salinity shapes food webs of lakes in semiarid climate zones—A stable isotope approach: Inland Waters, v. 11, no. 4, p. 476–491. [Also available at https://doi.org/10.1080/20442041.2020.1859290.]
Wang, J.D., Song, C.Q., Reager, J.T., Yao, F.F., Famiglietti, J.S., Sheng, Y.W., MacDonald, G.M., Brun, F., Schmied, H.M., Marston, R.A., and Wada, Y., 2018, Recent global decline in endorheic basin water storages: Nature Geoscience, v. 11, no. 12, p. 926–932, accessed November 12, 2023, at https://doi.org/10.1038/s41561-018-0265-7.
Wilkinson, M.D., Dumontier, M., Aalbersberg, I.J., Appleton, G., Axton, M., Baak, A., Blomberg, N., Boiten, J.W., Santos, L.B.D., Bourne, P.E., Bouwman, J., Brookes, A.J., Clark, T., Crosas, M., and others, 2016, Comment—The FAIR guiding principles for scientific data management and stewardship: Scientific Data, v. 3, 9 p., accessed November 12, 2023, at https://doi.org/10.1038/sdata.2016.18.
Williams, B.K., Szaro, R.C., and Shapiro, C.D., 2009, Adaptive management—The U.S. Department of the Interior technical guide: U.S. Department of the Interior Federal Government Series Report, 72 p., accessed November 12, 2023, at https://pubs.er.usgs.gov/publication/70194537.
Wilsey, C.B., Taylor, L., Michel, N., and Stockdale, K., 2017, Water and birds in the arid West—Habitats in decline: New York, National Audubon Society, 51 p., accessed November 12, 2023, at https://media.audubon.org/wbaw_report_5july17_updated.pdf.
Wurtsbaugh, W.A., Miller, C., Null, S.E., DeRose, R.J., Wilcock, P., Hahnenberger, M., Howe, F., and Moore, J., 2017, Decline of the world’s saline lakes: Nature Geoscience, v. 10, no. 11, p. 816–821, accessed November 12, 2023, at https://doi.org/10.1038/ngeo3052.
Zadereev, E., 2018, Salt lakes, surrounding environments and environmental management, in Introduction to salt lake sciences: Beijing, China, Science Press Beijing, p. 172–179. [Also available at https://www.researchgate.net/publication/329362271_Salt_Lakes_Surrounding_Environments_and_Environmental_Management.]
Appendix 1. Great Basin Terminal Lakes Gap Analysis
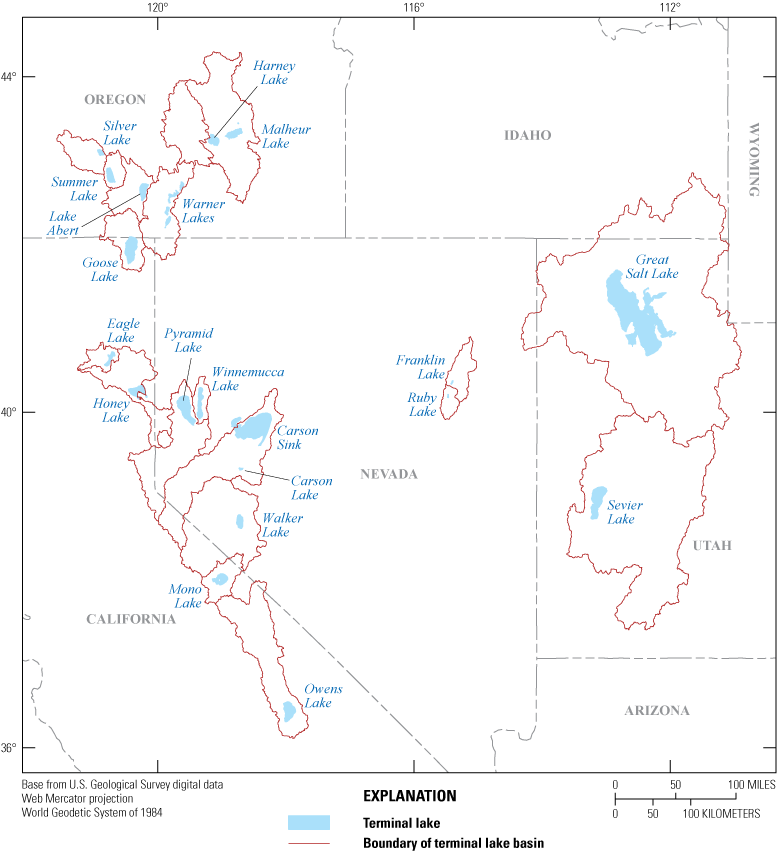
Twenty terminal lake watersheds across the Great Basin that were evaluated during this literature synthesis and gap assessment.
Literature Review
This literature synthesis is being used to inform the USGS Saline Lake Ecosystems IWAAs Science Strategy and Adaptive Implementation Framework about current gaps related to science and data needs. A primary goal of the gap analysis and literature synthesis is to leverage existing information and develop an integrated science assessment that can be used to identify information on topics related to water availability and waterbirds.
Methods
A keyword search on terminal lake ecology and hydrology in Google Scholar (using Publish or Perish software; Harzing, 2007) and Scopus (using BiblioSearch software; Kleist and Enns, 2022) was completed. The keyword search was used to gather relevant peer-reviewed publications, including journal articles, agency, or non-governmental organization (NGO) reports, books, theses, and dissertations (hereinafter publications). Both search engines look for key terms in the title, abstract, and keywords, but Google Scholar also searches for key terms within the full text. Three topical areas were explored for our queries: waterbird ecology (and waterbird species), hydrology, and aquatic species. All topical area queries included search terms for terminal lake systems –(saline lake[s], hypersaline, hypersalinity, terminal lake[s], or alkaline lake[s]; geographical area); Great Basin or Intermountain West; and (or) 20 terminal lake names (table 1.1). Eleven lakes are collectively known as the Warner Lakes; therefore Warner Lake(s) was used in the search and counted as just one lake. The waterbird topical area included a query of general waterbird terms (n = 4, table 1.2) as well as separate queries of each scientific and/or common name of 15 waterbirds of interest. The hydrologic topical area included a query of general hydrology and hydrogeology, water sources, water chemistry, and water monitoring types (n = 21 searched hydrologic terms). The aquatic species topical area included a query of scientific and/or common names of aquatic insects, fish, and crustaceans of interest (n = 28 searched terms: table 1.2). Queries were not restricted by publication date. Key terms were identical for Google Scholar and Scopus searches, except for the query of waterbird scientific and common names, which was only queried in Scopus to avoid full-text searches that would likely capture species lists on websites instead of targeted research. Queries were executed for waterbird and aquatic species on June 23, 2022, and for the hydrology query on July 1, 2022. Notably, some literature that used less common scientific terms (for example, underground water instead of groundwater) or alternative lake names (for example, Abert Lake instead of Lake Abert) may have been missed. However, if those publications identified the current commonly used lake name in the title, abstract, or keywords, our search would have still identified it.
Search terms included as a Boolean (AND/OR) to each topical area query (waterbird ecology, hydrology, and aquatic species).
[Searches were conducted in Google Scholar and Scopus]
Table 1.2.
Search terms for relevant peer-reviewed publications on terminal lake ecology and hydrology.[Searches were conducted in Google Scholar and Scopus]
For each query topic (waterbird, hydrology, and aquatic species), results were combined into one database, and duplicate titles were removed. Output included information on literature source, title, authors, document type (for example, article, book chapter, website), year published, digital object identifier, uniform resource location (url) link, and journal name. The waterbird query resulted in 2,650 publications, the hydrology query returned 6,368 publications, and the aquatic species query returned 4,797 publications. Most of the publications returned by the aquatic species query were studies of crustaceans (2,899 publications) and insects (1,786 publications), and very few were of fish (112 publications). Because our focus was generally on waterbirds, and because the interconnectedness between waterbirds and aquatic species was well represented in the waterbird query, the output from the aquatic species query was dropped from the synthesis. Therefore, the waterbird query represents the ecology literature review. Moving forward with just the hydrology and ecology topical queries (9,018 publications), a team of USGS hydrologists (n = 23) and ecologists (n = 13) conducted a rapid review of the publications (title and abstract only) to determine if each publication might be relevant to the overall goal of identifying literature that would inform an understanding of the hydrology and ecology of terminal lakes in the Great Basin. The rapid review included classifying the publications as research, results, or data (1) related to the 20 queried terminal lakes in the Great Basin, (2) related to terminal lakes throughout North America, or (3) associated with terminal lakes in other regions of the world. Upon completing the rapid review, 935 publications were deemed relevant.
The relevant publications were fully reviewed and categorized into hydrologic and ecologic research topics. Broad topical areas for classifying hydrological and ecological information from the relevant publications were used to avoid subtle differences across research areas and to help create a common ontology across disciplines and publications. In addition to classifying the research topics for each paper, the following also was gathered: information on the name(s) of the lake(s) on which the paper focused, the geographic location (usually a U.S. State), name(s) of focal waterbird species and associated guilds (for the waterbird literature), and main hydrologic issues presented (for the hydrology literature). Ten additional publications were identified during the review process because of changes to lake names or because they were associated with the specific wildlife species names.
An information density analysis (Wilkinson and Friendly, 2009) was used to identify knowledge and information gaps associated with each topical category across the hydrological and ecological literature related to the queried terminal lakes within the Great Basin. The density analysis focused on the number of publications related to publication date, specific topical areas, specific lakes, and partner priorities. Although the number of publications is useful to identify potential research/data gaps, the relevance and quality of those publications are also important. Because terminal lake systems are in flux, publications from the last 20 years (hereinafter recent) likely provide more applicable information regarding current conditions and associated responses to those conditions. However, literature published in prior decades may provide a foundational understanding of how species, food webs, and (or) lake ecosystems functioned prior to more recent extreme conditions. Data associated with terminal lakes in the Great Basin (n = 779; fig. 1.2) were plotted using heatmaps in the R library, ggplot2 (Wickham, 2018) using the median age of the research literature for each terminal lake to represent the temporal relevance of the literature synthesis information (fig.1.3A–1.3B).
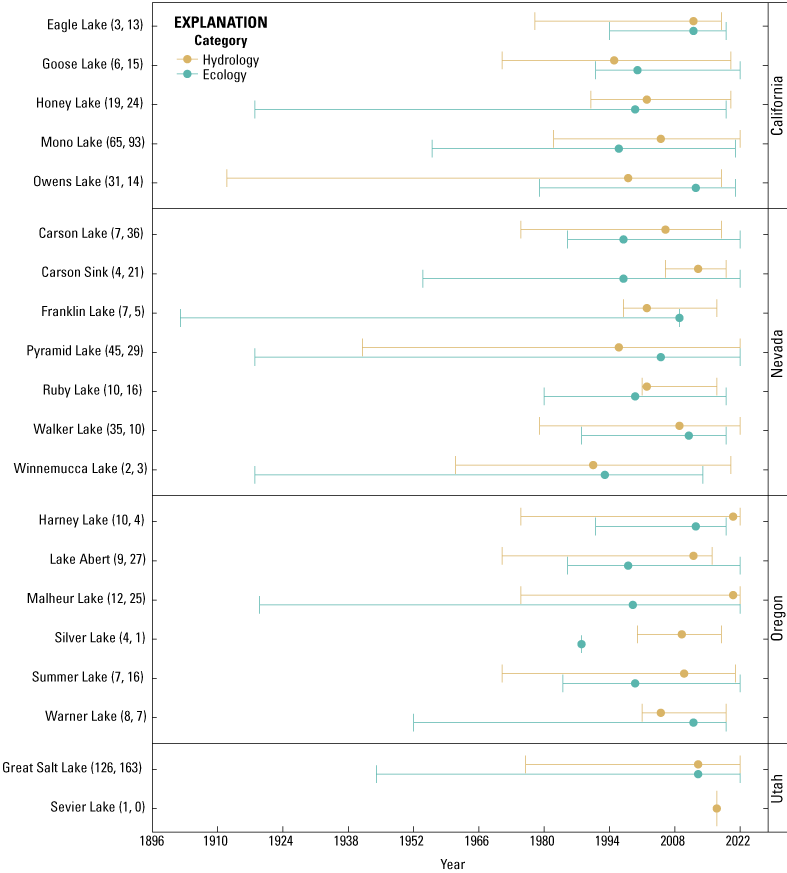
Temporal range of publications that were reviewed in the hydrologic (n = 392) and ecologic (n = 347) topics from each of the queried terminal lakes in the Great Basin (see Herring and others, 2023). The median publication year is represented as a dot for each lake, with bars representing the range. The y-axis shows the lake name and the number of publications in the hydrology or ecology category, respectively, in parentheses. Note that the combined numbers of papers in parentheses exceed the total number of papers on the hydrologic and ecologic topics because some papers pertained to multiple lakes and (or) both topics. [n, number.]
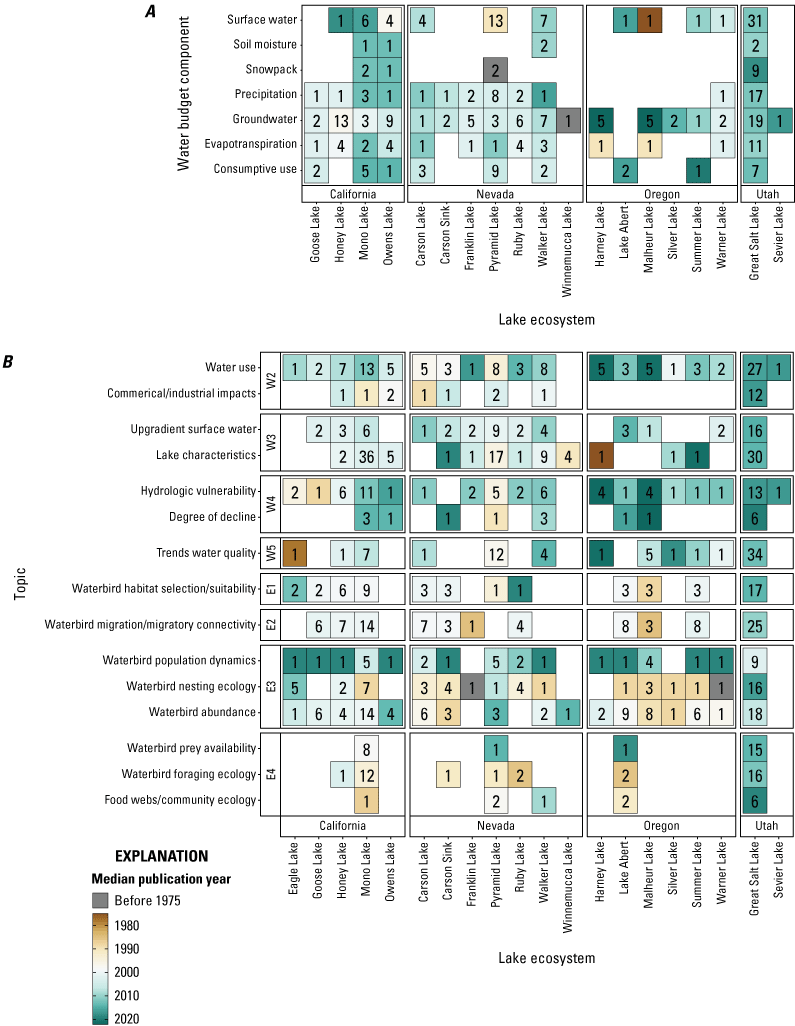
Distribution of research literature addressing (A) water budget components and (B) hydrology and ecology topics across the Great Basin sorted by lake. The top partner hydrologic priority of water budget (A) is shown here with hydrologic components that are used to establish water budgets. Classifications on the y-axis indicate priorities ranked by partners (water use [W2], lake/wetlands surface water [W3], hydrologic vulnerability [W4], water quality [W5], habitat [E1], bird dispersal among terminal lakes [E2], bird population abundance/trend [E3], and food/prey availability [E4]). The threatened species/species of concern category (E5) is included in ecologic topics E1–E5. The color scheme in the boxes reflects the median publication year and the number in the box indicates the number of publications. Note: Blank spaces indicate no literature associated with that hydrologic and ecologic topic and (or) that lake.
Partner Engagement
Partner workshops were used to identify and document environmental data-collection activities and scientific monitoring and assessment needs that can be used to inform management decisions for terminal lake watersheds and the wildlife that depend on them. A detailed description of partner workshops is in appendix 3. Participants were asked to rank the importance of waterbird guilds (open-waterbirds, shorebirds, wading birds, and waterfowl) across the Great Basin terminal lakes. The partner rankings were used to organize literature data (figs. 1.3A–1.3B, and 1.4). The highest-ranked categories and guilds were those identified as needing additional understanding to inform conservation and management efforts. Partners were asked to rank specific hydrologic and ecologic information needs separately. Responses were grouped into similar ecologic and hydrologic topic types within the top partner rankings to facilitate the evaluation of potential research gaps (table 1.3).
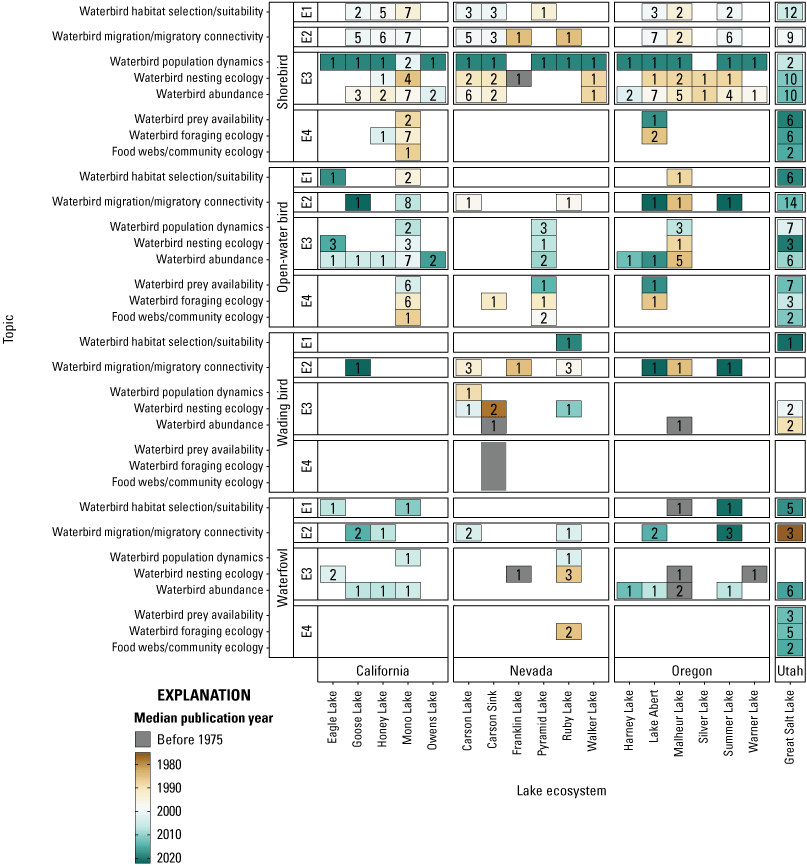
Distribution of ecological literature topical areas across the Great Basin sorted by waterbird guild, lake, and ecologic topic. Classifications on the y-axis (E1–E4) of literature review categories are assigned for each waterbird guild in descending priority based on partner rankings (habitat [E1], bird dispersal among terminal lakes [E2], bird population abundance/trend [E3], and food/prey availability [E4]). Waterbird guilds were defined as open-waterbirds, shorebirds, wading birds, and waterfowl. The color scheme in the boxes reflects the median publication year and the number in the box indicates the number of publications. Blank spaces indicate no literature associated with that ecologic topic and (or) that lake. Sevier Lake was not included because there were no ecologic topic publications for that lake.
Table 1.3.
Partner priority ranks and grouping of literature review categories.[Priorities identified in the partner workshops also led the team to perform additional reviews and analyses of the identified literature. E1 represents the priority ranking of 1 for the ecosystem topics. W1 represents the priority ranking of 1 for the water availability topics]
Because the hydrologic topic “water budget” is a multifaceted category and was ranked as the highest priority by our partners (table 1.3), for the literature synthesis this topic was separated into individual components of water budgets. An automated search of the hydrologic literature’s keywords was based on the defined components of water budgets. These components included surface water inflows, soil moisture, snowpack, precipitation, groundwater inflows, evapotranspiration, and consumptive use. The distribution of documents related to the water budget components to the specific terminal lakes were assessed To more closely evaluate potential information and knowledge gaps over space and time by topic in the literature related to water budgets (fig 1.3A).
Ecological Data Availability
To understand interactions between ecological and hydrological processes, a data integration process was used to link disparate sources of ecological data with established warehouses of hydrological data. These efforts are ongoing and have focused on identifying data reflecting three categories of information: population surveys, individual locations, or resources/habitat quantification. Survey information may also reflect taxa abundance or occupancy/occurrence. Location data from marked individuals may include repeated relocations through telemetry or single-recovery locations (for example, banding data). Resource-quantification data reflect some aspect of habitat generally as a vector of quality or value such as food density, or relative probability of occurrence among a suite of habitat types. Applicable datasets need to be digital and machine-readable to be easily incorporated into built-for-purpose data-storage and analysis environments. To assess the ease and suitability of incorporating datasets into other data environments, data characteristics and metadata availability were considered. Three sources were queried to identify suitable datasets: (1) large-scale and domain-specific data repositories, (2) relevant literature identified in this review, and (3) regional partner groups (for example, State and Federal wildlife and natural resource agencies and non-governmental organizations; table 1.4). Many datasets (for example, eBird) were cross-referenced, however, in multiple repositories requiring identification to avoid duplication. To date, 189 potentially relevant datasets have been identified and 122 unique sets have established processes to access publicly available data or for which authorization for use and summary has been received (table 1.4). Most datasets identified thus far represent population survey data (n = 162; 86 percent), but these data often reflect single species occupancy without spatial or temporal replication or estimates of effort, which limits their usefulness for future integration and meta-analysis.
Table 1.4.
Data repositories that were queried for relevant ecologic data on migratory birds within the Great Basin.[Identified datasets represent those that were found from data repository queries, relevant literature, and partner agencies. Accessed datasets are a subset of the identified datasets and include those that have been authorized to be used in summary fashion]
Water-Data Review
A review of the surface-water, groundwater, and water-quality data available in the USGS National Water Information System (NWIS; U.S. Geological Survey, 2022) and Water Quality Portal (WQP; National Water Quality Monitoring Council, 2022) was done to inform the gap analysis of water-data availability. Data from partner organizations were not included in this literature review and the gap analysis identified the need to include partner data and information in future steps. To assess the available water data, the watershed boundaries for each terminal lake were defined using the USGS National Hydrography Dataset (NHD plusHiRes; Buto and Anderson, 2020) in consultation with subject-matter experts on the Saline Lake Ecosystems Team. The sites were then inventoried with groundwater, surface-water, and water-quality records using the dataRetrieval package in R (DeCicco and others, 2022; R Core Team, 2022), which uses programmatic access to NWIS and the WQP.
To determine recently active monitoring sites, water-data records from January 1, 2000, to November 27, 2022, were queried for selected variables measuring surface water, groundwater, and water quality of surface-water sites (hereinafter referred to as water quality). Spatial queries for water data were made within the extent of each lake watershed to capture data attributed to the lake and inflowing rivers and streams. For surface-water and water-quality sites, the location of each site returned was recorded as located along a primary tributary (stream order 3 or above; see Strahler, 1957), on a headwater stream (stream order 1 or 2), or along a primary lake waterbody. This categorization was not determined for groundwater because not all well locations are directly associated with a specific stream or lake. For groundwater and surface-water sites, a minimum threshold of two measurements in a given year over the focal period (2000–22) was used to identify sites. In contrast, any sites collecting water-quality data were included in the water-data review because of the more variable nature of sampling water quality (for example, typically discrete field sampling).
Continuous groundwater and surface-water data from NWIS were obtained. Surface-water measurements included streamflow, stream stage, and lake stage. Daily and instantaneous values were pulled for surface-water and groundwater variables. A daily value captures the parameter condition on any given day and is a statistical summary value (for example, mean) taken from the instantaneous values of that day. For this gap analysis, daily values were used to summarize data coverage across the watersheds because they capture the breadth of active sites across all parameters (figs. 1.4–1.8). Discrete field measurement values of surface-water streamflow and depth to groundwater level were also extracted and evaluated from NWIS. Field measurements are the discrete records measured manually by USGS staff that help supplement the automatically recorded continuous measurements. In all, the addition of discrete surface-water and groundwater records adds value to the data coverage of certain lake watersheds in the Great Basin.
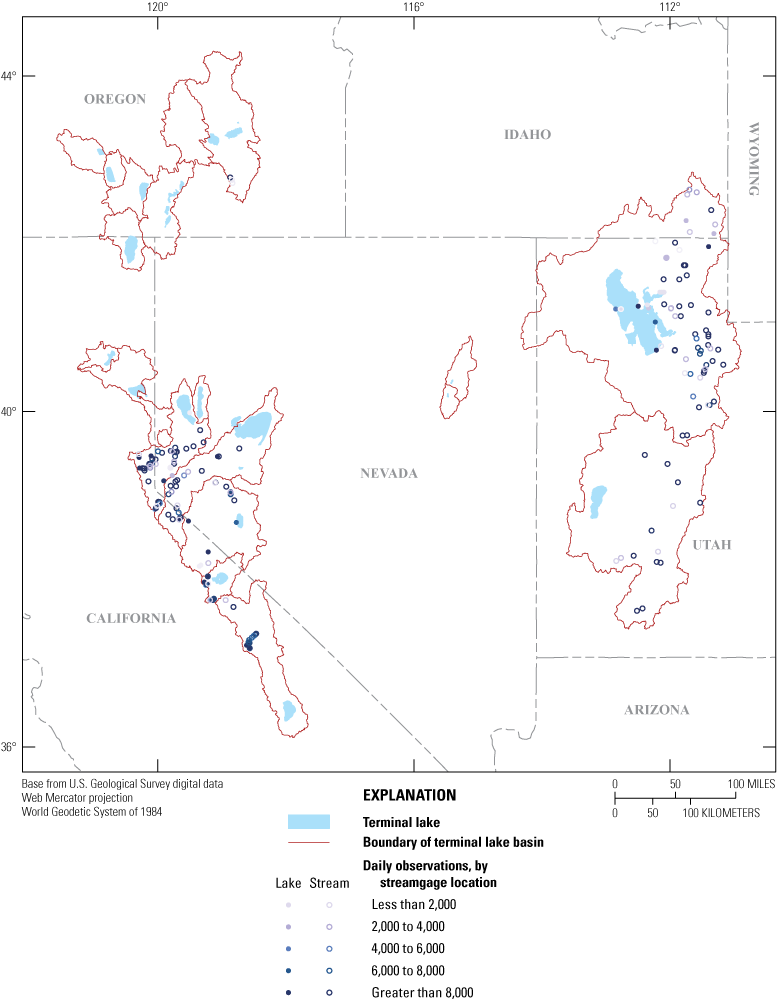
Streamgage and lake-elevation gage sites with at least three measurements each year, in the Great Basin, 2000–22. Sites are shown as colored circles to indicate the total number of daily measurements at each gage site, with a maximum of 8,367 possible measurements per site over the focal period (2000–22). All streamgage sites shown are situated along the lake’s primary tributaries (defined here as stream order 3 or greater; see Strahler, 1957).
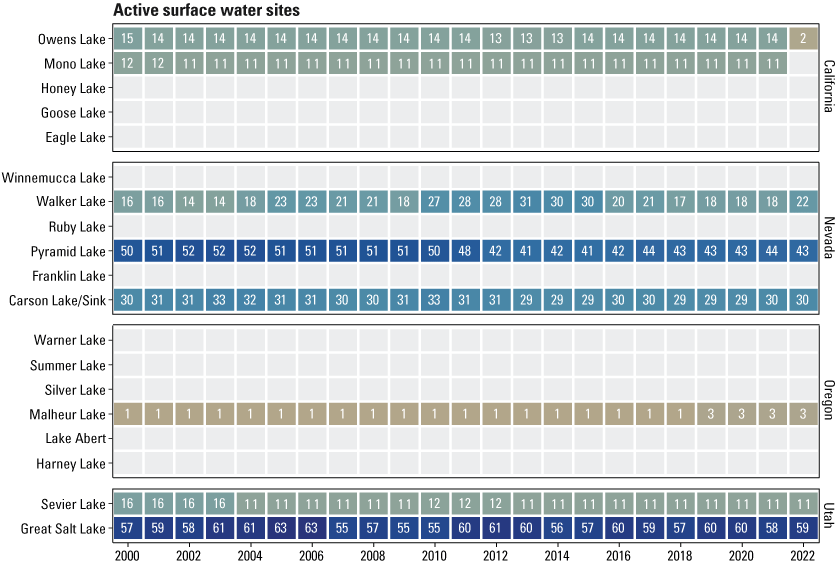
Surface-water sites and daily data coverage for each terminal lake watershed, in the Great Basin, 2000–22. Heatmap shows the number of surface-water sites with at least three streamflow measurements in a given year. Numbers in tiles are the total number of sites for that year.
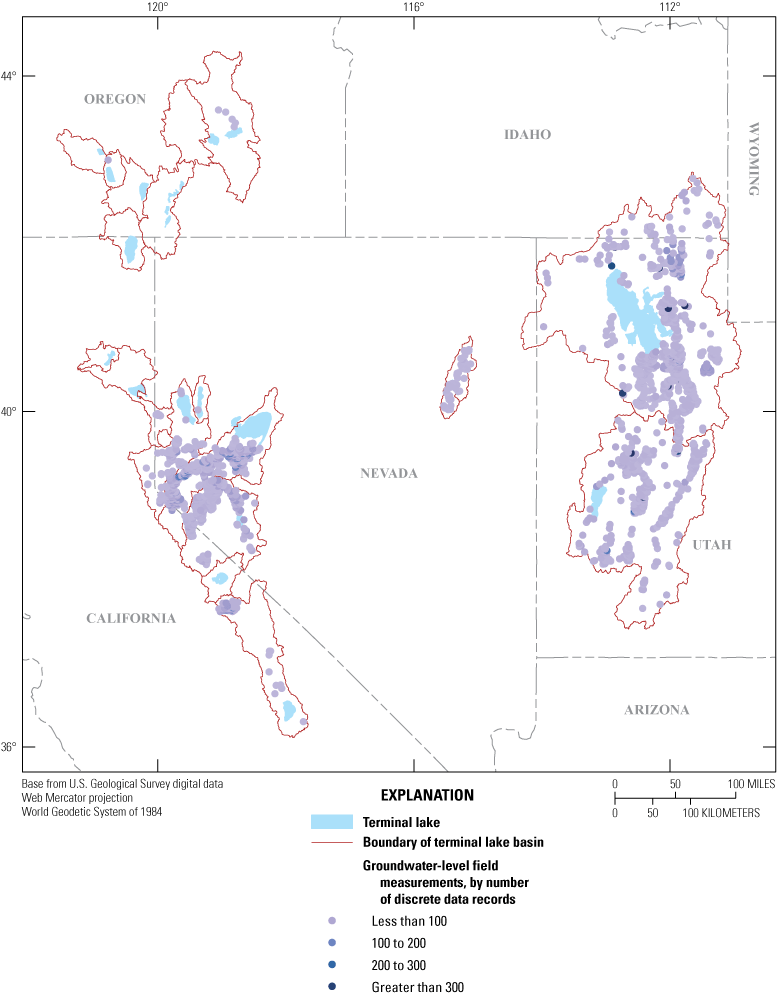
Groundwater-level measurement sites with at least two discrete measurements in at least 1 year, in the Great Basin, 2000–22. Sites are colored to indicate the total number of measurements at each well site. There was a total of 64,000 discrete groundwater-level records at 2,714 different sites in the queried watersheds of the Great Basin.
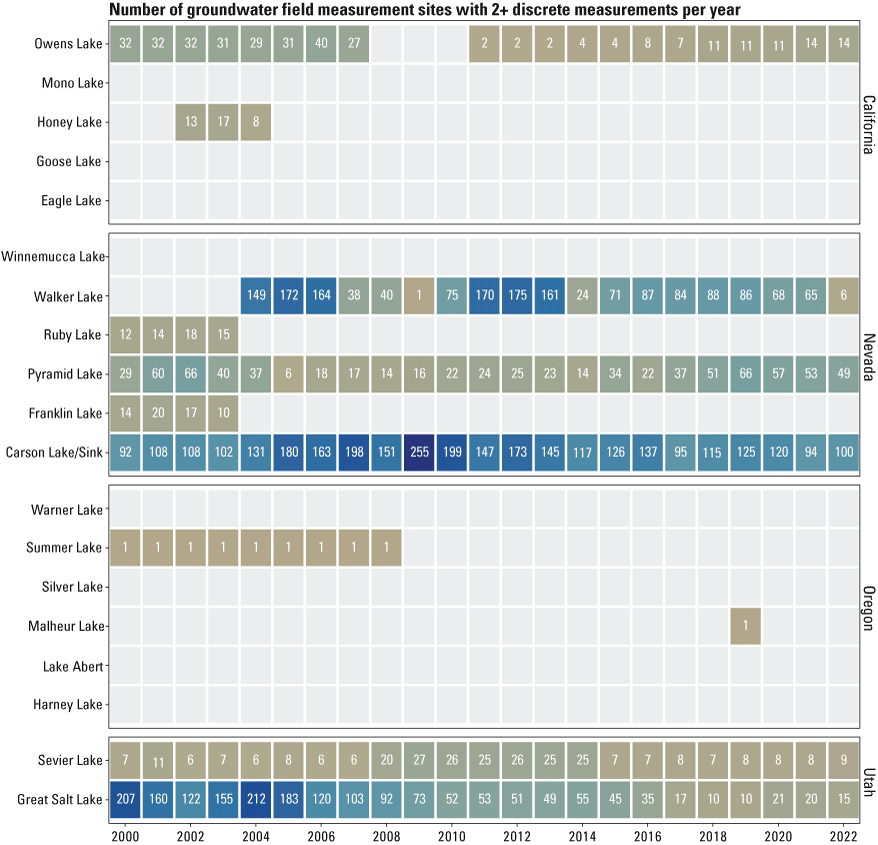
Groundwater sites and daily data coverage for each terminal lake watershed, in the Great Basin, 2000–22. Heatmap shows the number of groundwater sites with at least two measurements in a given year. Numbers in tiles are the total number of sites for that year.
Discrete water-quality data were queried from the WQP for each of the lake watersheds. In contrast to the parameter code approach available in NWIS, WQP data queries were pulled by the measurement name using the water-quality characteristic name attribute. To capture the water-quality data, our efforts were focused on the following measurements: water temperature, specific conductance, salinity, dissolved oxygen, pH, nitrate, nitrogen, and phosphorus. All selected measurement categories except for salinity are individual chemical constituent values in the WQP. By contrast, the salinity measurement category in our results combines WQP’s “Salinity” parameter, defined as the amount of salt in the water sample, and “Total Dissolved Solids,” which is the sum of all substances dissolved in the water sample. These two measurement categories were selected to expand our data coverage of salinity across our various watersheds because total dissolved solids are commonly used as a proxy for salinity in water. Specific gravity and density of water at 20 degrees Celsius were two additional proxy measurements of salinity that are used to expand the water-quality data query for salinity; however, those records were removed from the results because there were only records for Great Salt Lake.
The resulting data from NWIS and WQP were processed to remove missing and duplicate records. To assess gaps in data, the number of sites per year (with a minimum of two measurements each year) was used for each lake over the 22-year period of interest (fig. 1.9).
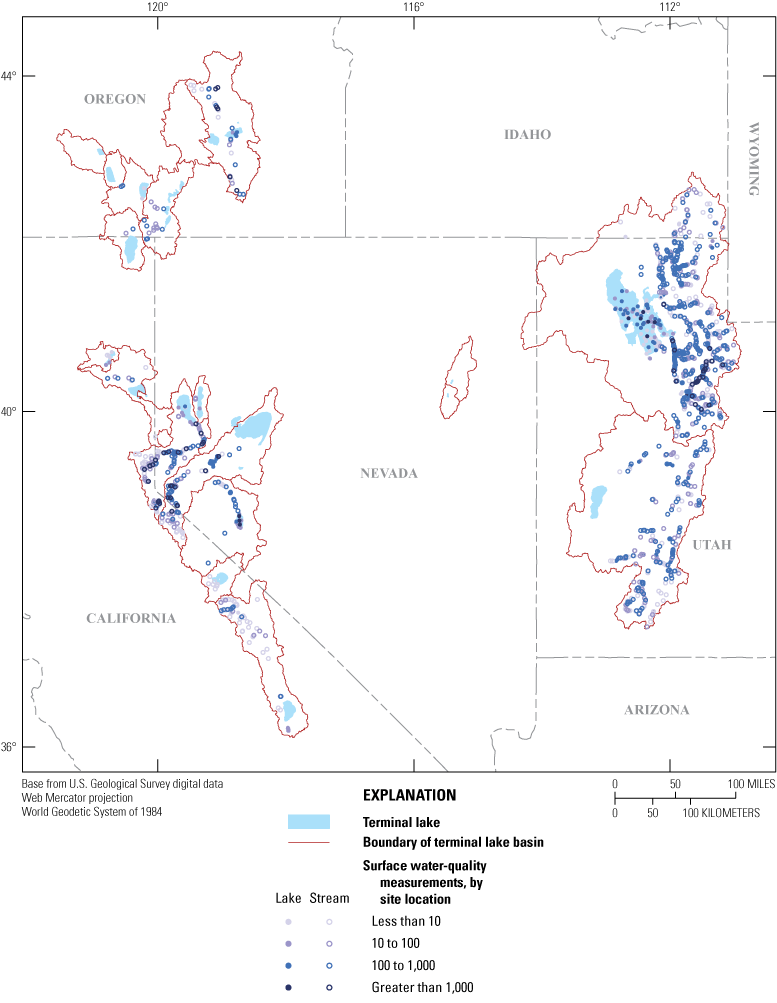
Surface-water-quality sites, in the Great Basin, 2000–22. Circle color indicates the number of measurements at each site. All stream sites shown are situated along the lake’s primary tributaries (defined here as stream order 3 or greater; see Strahler, 1957). Water-quality measurements included a suite of water chemistry variables (for example, nitrate, salinity, water temperature, etc.).
Hydrological and Ecological Knowledge and Information Gaps
The Saline Lake Ecosystems IWAAs Team used an integrated process to identify hydrological and ecological knowledge and information gaps at the different conceptual model spatial extents. The integrated process combined the results from an extensive literature review, USGS data review, and partner input received through one-on-one discussions and workshops with subject-matter experts and managers (app. 3). The integrated process highlights information gaps within and across spatial extents including individual terminal lakes (lake spatial extent), individual terminal lake watersheds (watershed spatial extent), and the interconnected system of terminal lakes across the Great Basin (regional spatial extent). Despite extensive literature review, data review, and numerous partner engagements, the gaps described in the sections that follow do not represent a comprehensive list. It is unclear if the documents compiled during the literature review provide foundational or relevant knowledge and information. The relevance and applicability of the literature will need to be determined during future study phases and the implementation of workplans. Additionally, the data review was limited in scope and does not necessarily account for data being collected by other bureaus and agencies. Future work could include assimilating accessible data from Federal, State, Tribal, and other organizations.
An iterative and collaborative process is needed by which partners work together to prioritize and identify additional gaps to develop actionable science outcomes for coming years to address the complex challenges of water availability and the effects on waterbirds across the Great Basin. The information and knowledge gaps identified by this process are not prioritized, given that the list is considerable in length and requires refinement. The process of addressing information gaps will rely on synthesizing new information and insights, including understanding similar systems from which knowledge can be translated. Thematic priorities from partner engagements are introduced in the spatial extent introductions, but the list is not prioritized because each year new information should be assimilated to understand evolving priorities.
Lake Spatial Extent
Information and knowledge gaps identified at the lake spatial extent highlight a lack of understanding about the linkages between water quantity and water quality, and how they influence the type, extent, and diversity of habitats, which ultimately impact bird behaviors at a terminal lake or in adjacent aquatic and terrestrial environments. Partners identified hydrologic and ecologic information priorities including (1) tracking individual bird movement to determine how habitats are used; (2) conducting coherent long-term hydrologic and ecologic monitoring to understand spatial and temporal patterns of individual water-budget components; (3) identifying key habitat characteristics and conditions to assess and forecast for future changes, including changes to freshwater inflows and climate changes; and (4) evaluating the effectiveness of restoration efforts.
Hydrological Data and Information Gaps
The following hydrological data and information gaps were identified at the lake spatial extent:
-
• Information on the different components of water budgets at specific terminal lakes has been identified as having gaps, including in the open-water and adjacent aquatic environments. Information gaps from specific terminal lakes highlight knowledge that is limited, older, and not representative of today’s current (2023) conditions, or missing.
-
o Great Salt Lake, Mono Lake, and Owens Lake are the only lakes associated with recent (approximately the last decade) documents covering all water-budget components for lake water budget estimates, but data are lacking on specific locations in the open-water and adjacent aquatic environments for these lakes.
-
o Malheur Lake is the subject of recent estimates of several water-budget components but at the Malheur Wildlife Refuge, there is a lack of information to understand key factors influencing water availability and habitat availability.
-
o At Ruby Lake National Wildlife Refuge, water-quality data is needed to evaluate effects from climate change and potential mining operation expansion.
-
o Pyramid Lake has a large amount of literature, but that literature tends to be older studies (>20 years old) or information that is not available to the public.
-
o Little to no data on water-budget components are available for Oregon lakes.
-
o Downgradient from Lahontan Dam at Carson Sink and Carson Lake (Nevada), there are almost no associated details for water budgets or associated hydrologic components.
-
-
• Active surface-water (streamgage and water elevation or stage) monitoring sites are needed near or within open-water and adjacent aquatic environments to understand fluctuations in extent and depth.
-
o Surface-water monitoring at some of the terminal lakes is undertaken by other Federal, State, Tribal, or non-governmental organizations. Cataloging and leveraging this accessible data can quickly fill data and information gaps.
-
o Continuous lake-stage data are only being collected at Great Salt Lake, Mono Lake, and Walker Lake.
-
o Discrete stage data are being collected weekly in the Carson Sink wetland and Stillwater Marsh, biweekly in Ruby Lake open-water and adjacent aquatic environments, and monthly in Pyramid Lake open water.
-
o Bathymetric data are lacking at a scale warranted for ecological or ecohydrological questions across most lakes including the following:
-
▪ Anaho Island National Wildlife Refuge, which needs updated bathymetry of Pyramid Lake to predict when a land bridge will form as lake levels decline.
-
▪ Ruby Lake, which needs improved bathymetry to understand depth-volume dynamics of the managed marsh system.
-
▪ Malheur Lake and other terminal lakes in Oregon, for which some data have been collected to understand bathymetry, but data are currently (2023) lacking interpretation.
-
-
-
• Water-quality data are spatially and temporally limited for terminal lakes and adjacent aquatic environments. These data gaps limit the understanding of linkages between water quantity, water quality, and habitat conditions, including what changes during lake-level fluctuations.
-
o Most water-quality measurements are collected in streams upgradient from the terminal lakes.
-
o Salinity is the least monitored water-quality variable, with measurements occurring at only 10 terminal lakes in the open water. Most “salinity” measurements are total dissolved solids.
-
o Data on freeze/thaw spatial information is lacking.
-
o Data are needed on wetting and re-wetting of surfaces during lake extent fluctuations and its influence on primary productivity.
-
-
• Open-water evaporation from hypersaline lakes is not being measured nor is the literature sufficient to characterize this. Information on open-water evaporation at hypersaline lakes helps to understand how changes in climate can reduce water availability.
-
• Information on different components of water budgets at specific terminal lakes, including open-water and adjacent aquatic environments, is limited, old, not representative of current conditions, or nonexistent.
Ecological Data and Information Gaps
The following ecological data and information gaps were identified at the lake spatial extent:
-
• Priority ecologic and avian literature availability is limited across the terminal lakes open-water and adjacent aquatic environments.
-
o Ecological literature associated with highly managed Owens Lake is limited.
-
o Harney Lake only has one type of ecological literature (waterbird abundance).
-
o Limited ecological literature associated with now-dry lakes (for example, Franklin Lake, Silver Lake, Lake Winnemucca, Sevier Lake) is available.
-
o Little information (<5 publications) is available across all ecologic science topics for Sevier Lake, Lahontan Basin (Carson Lake and Carson Sink), Eagle Lake, and Silver Lake.
-
-
• Long-term and regionally coherent open-water, wetland, and mudflat monitoring is lacking across the terminal lake wetlands to enable an understanding of habitat fluctuations and spatial extent. Examples include:
-
o National wildlife refuges, including Stillwater (Carson Lake/Carson Sink), Ruby Lake, and Anaho Island National Wildlife Refuges, and the Bear River Migratory Bird Refuge (Great Salt Lake), which are missing information on wetland-status and habitat-availability monitoring and assessments to determine influences of climate change and development; and
-
o Bear River Migratory Bird Refuge, which requires better understanding of invasive species treatments in wetlands including mapping, monitoring, and assessing treatment strategies to guide best practices.
-
-
• For open-water and adjacent aquatic and terrestrial environments, there is limited understanding of habitat distribution and suitability, including prey availability, foraging ecology, and food webs.
-
• Limited information on waterbird guilds (except for the shorebird guild) is available for all lakes in California, Nevada, and Oregon in our Great Basin study area. Additionally, much of the shorebird information is outdated.
-
• Comprehensive, long-term, and consistent bird-survey methods and associated data and analyses are not widely available or implemented across most lakes. These data gaps prevent accurate assessment of population change or demographic trends for most species and life-history stages.
-
• Individual use of habitats, management units, or residency in lake systems is poorly understood or absent for most species. This prevents identification of habitat selection/preference, assessments of resource needs, and effective adaptive habitat management.
-
• When lakes are spatially paired (for example, Harney and Malheur Lakes, Carson Lake and Carson Sink, Lake Abert, and Summer Lake), very limited ecological and hydrological information is available to enable an understanding of the ecologic significance of the adjacent lake (for example, migratory connectivity, short-term movements, abundance, nesting ecology).
Watershed Spatial Extent
Information and knowledge gaps identified at the watershed spatial extent highlight the lack of understanding about the relations between water use, water availability, and habitat composition, and use by bird communities within the watershed.
Hydrological Data and Information Gaps
The following hydrological data and information gaps were identified at the watershed spatial extent:
-
• Current assessments have not been reported in the literature of the hydrological condition of most of the watersheds, including water-budget components, interbasin transfers, important agricultural wetlands, and other elements affecting water conditions.
-
o Surface-water and groundwater monitoring sites in most of the terminal lake watersheds are needed to evaluate water use and to quantify water-budget components.
-
▪ Streamgages at the inlet to terminal lakes are lacking. The locations for most streamgages in terminal lake watersheds are upgradient from the stream inlet into the terminal lake, and in most cases are upgradient from surface-water diversions.
-
▪ This lack of monitoring makes it difficult to ensure delivery of water to terminal lakes with water rights (for example, Great Salt Lake).
-
▪ The U.S. Fish and Wildlife Service has a streamgage on the Donner und Blitzen River near the inlet to Malheur Lake, downgradient from all diversions; however, these data are not accessible to the public.
-
-
o Only 40 percent (eight lakes) of queried terminal lake watersheds contain permanent USGS streamgages collecting continuous streamflow data.
-
▪ The watersheds that have streamgages include Great Salt Lake (Utah), Pyramid Lake (Nevada), Carson Lake/Sink (Nevada), Walker Lake (Nevada), Owens Lake (California), Sevier Lake (Utah), Mono Lake (California), and Malheur Lake (Oregon) watersheds.
-
▪ Other Federal, State, Tribal, and non-governmental organizations collect streamgage data but access to these data is limited.
-
▪ Oregon Water Resources Department is operating streamgages on the Chewaucan River (Lake Abert) and on streams in the Goose Lake watershed.
-
-
o Where it exists, upgradient streamflow gaging is inconsistent at most of the terminal lake watersheds.
-
▪ The number of surface-water sites in the Pyramid Lake (Nevada) watershed decreased over time, with a large reduction in sites after 2010.
-
▪ Surface-water sites at Walker Lake (Nevada) increased during 2005–14 but more recently decreased by about 10 sites.
-
▪ Great Salt Lake and Sevier Lake watershed contained a consistent number of streamgages throughout the entire period of 2000–20.
-
-
o Only 30 percent (six lakes) of the focal terminal lake watersheds contain data on depth to groundwater, including Carson Lake/Sink (Nevada), Great Salt Lake (Utah), Owens Lake (California), Pyramid Lake (Nevada), Sevier Lake (Utah), and Walker Lake (Nevada).
-
▪ Literature on groundwater numerical or conceptual models is available for all terminal lake watersheds across the Great Basin study area, except for Harney Lake.
-
▪ During 2000–20, USGS groundwater wells were monitored in the terminal lake watersheds of Oregon, Mono Lake’s watershed, the California lake watersheds north of the Truckee River Basin, and Pyramid Lake (Nevada).
-
▪ Great Salt and Sevier Lakes (Utah) and Owens Lake (California) have the largest number of groundwater-monitoring sites.
-
-
o Evapotranspiration data across the different watersheds are lacking, especially for groundwater-dependent wetlands and irrigated fields.
-
o Data on precipitation and snowpack are lacking, especially for mountain ranges in remote parts of the Great Basin.
-
o Soil-moisture data across the terminal lake watersheds are missing; these data are an important component for the understanding of “snow-to-flow” dynamics.
-
-
• Data on commercial/industrial effects on lake water budgets are available for Great Salt, Walker, Pyramid, and Honey Lakes. It is unclear whether the remaining 16 lakes are affected by commercial/industrial water use.
Ecological Data and Information Gaps
The following ecological data and information gaps were identified at the watershed spatial extent:
-
• Limited work is reported in the literature on prey availability or food webs/community ecology at many of the terminal lake watersheds.
-
• There is a lack of recent understanding on how waterbirds use habitats across the watersheds for different life-history needs and how to characterize the suitability of different/changing landscapes to support different species/populations.
-
• There remains a poor understanding of the strength of philopatry (the tendency of an organism to stay in or habitually return to a particular area) across landscapes and of carryover impacts to philopatry resulting from prior-season/year conditions.
-
• Survey methods to index populations are often insufficient to estimate abundance or track population flux at sub-annual time scales and often do not completely represent constituent species.
-
• Responses of birds to watershed water use and habitat-management actions (for example, individual behaviors, habitat selection, and demographic consequences) are poorly understood.
Great Basin Regional Spatial Extent
Information and knowledge gaps identified at the regional spatial extent highlight the lack of understanding about (1) water availability across the network of lakes and watersheds over space and time; and (2) linking this information to bird movement, within the context of management and conservation actions across the region.
Hydrological Data and Information Gaps
The following hydrological data and information gaps were identified at the regional spatial extent:
-
• Information on snowpack and soil moisture characteristics was sparse in the literature reviewed, especially in Oregon terminal lake watersheds.
-
• Information on surface water is concentrated in specific basins and lacking in other basins.
-
• Evapotranspiration and precipitation information is limited across the Great Basin with very few studies for most of the terminal lake watersheds, especially for hypersaline lakes.
-
• Water-quality information (particularly salinity and alkalinity) in the open waters of most Great Basin terminal lakes is not available.
-
• Key hydrologic controls on invertebrate prey populations (for example, surface water, water quality, and water use) and information/data related to their populations are limited at the Great Basin terminal lakes.
-
• The impacts of surface-water and groundwater exportation and interbasin flow are poorly understood.
-
• Information on how terminal lake ecological and hydrological conditions are affected by climate variability (persistent drought to extreme wet conditions) is limited.
Ecological Data and Information Gaps
The following ecological data and information gaps were identified at the regional spatial extent:
-
• Metapopulation (that is, spatially separated populations) dynamics information is limited throughout the Great Basin terminal lakes, including:
-
o A limited understanding of the current patterns of dispersal, migration, philopatry, and the within- and between-year interconnectedness of the entire Great Basin terminal lakes network;
-
o A lack of habitat quality data for key taxa/bird guilds at terminal lakes across the Great Basin, including hypersaline lakes, that are critically important for waterbirds is needed (except at Great Salt Lake where information is relatively recent); and
-
o Almost no recent details on reproductive ecology for all waterbird guilds across the entire system. Many terminal lakes have no information at all.
-
-
• Food web/community ecology/prey availability information across much of the Great Basin is very limited and is outdated at the few lakes for which it is available, except for Great Salt Lake.
-
• Data are available for the shorebird guild for much of the Great Basin, but the publications are almost exclusively old (>20 years) except at Great Salt Lake.
-
• Similarly, across the open water waterbird/wading bird/waterfowl guilds, critical details related to habitat quality, the abundance of prey resources and food webs, population dynamics, movements, and nesting ecology are exceptionally limited.
Gap Analysis Next Steps
Ongoing gap analysis efforts will focus on the following tasks:
-
1. Identify and incorporate Federal, State, Tribal, and other organizations’ hydrological and ecological data to fully understand data gaps.
-
2. Co-develop a method to identify new and previously unreviewed literature and data to inform continued analyses and science planning.
-
3. Investigate linkages between water quantity, water quality, habitat suitability, and bird movement and abundance.
References Cited
Buto, S.G., and Anderson, R.D., 2020, NHDPlus High Resolution (NHDPlus HR)—A hydrography framework for the Nation: U.S. Geological Survey Fact Sheet 2020–3033, 2 p., accessed November 12, 2023, at http://doi.org/10.3133/fs20203033.
DeCicco, L.A., Lorenz, D., Hirsch, R.M., Watkins, W., and Johnson, M., 2022, dataRetrieval— R Packages for discovering and retrieving water data available from U.S. federal hydrologic web services: Vienna, Austria, R Core Team, data-retreival packge, accessed November 12, 2023, at https://code.usgs.gov/water/dataRetrieval.
Harzing, A.W., 2007, Publish or perish: Hazring.com web page, accessed November 12, 2023, at https://harzing.com/resources/publish-or-perish.
Herring, G., Aldridge, C.L., Whipple, A.L., Eagles-Smith, C.A., Pulver, B.A., Inman, R.D., Matchett, E.L., Monroe, A.P., Orning, E.K., Robb, B.S., Shyvers, J.E., Tarbox, B.C., Van Schmidt, N.D., Smith, C.D., Holloran, M.J., Overton, C.T., O’Leary, D.R., Casazza, M.L., and Frus, R.J., 2023, Bibliography of hydrological and ecological research in the Great Basin terminal lakes, USA: U.S. Geological Survey data release, accessed November 12, 2023, at https://doi.org/10.5066/P9G5CGA7.
Kleist, N.J., and Enns, K.D., 2022, USGS BiblioSearch—A Python tool to facilitate searching, cleaning, and compiling of literature citations from across multiple databases, Version 1.0.0: U.S. Geological Survey software release, accessed November 12, 2023, at https://doi.org/10.5066/P9EW8BO5.
National Water Quality Monitoring Council, 2022, Water Quality Portal: National Water Quality Monitoring Council database, accessed November 15, 2022, at https://www.waterqualitydata.us.
R Core Team, 2022, R— A language and environment for statistical computing: R Vienna, Austria, Foundation for Statistical Computing web page, accessed November 12, 2023, at https://www.R-project.org/.
Strahler, A.N., 1957, Quantitative analysis of watershed geomorphology: Eos, Transactions American Geophysical Union, v. 38, no. 6, p. 913–920, accessed November 12, 2023, at https://agupubs.onlinelibrary.wiley.com/doi/10.1029/TR038i006p00913.
U.S. Geological Survey, 2022, National Water Information System: U.S. Geological Survey Web interface, accessed November 15, 2022, at https://nwis.waterdata.usgs.gov/nwis.
Wilkinson, L., and Friendly, M., 2009, The history of the cluster heat map: The American Statistician, v. 63, no. 2, p. 179–184, accessed November 12, 2023, at https://doi.org/10.1198/tas.2009.0033.
Appendix 2. Generalized Ecological Characteristics of Representative Bird Guilds Associated with Terminal Lake Ecosystems in the Great Basin
Table 2.1.
Primary resources important for shorebirds guild.Table 2.2.
Primary resources important for wading birds (ibis, herons, egrets) guild.Table 2.3.
Primary resources important for waterfowl (dabbling ducks) guild.Table 2.4.
Primary resources important for waterfowl (geese) guild.Table 2.5.
Primary resources important for waterfowl (diving ducks) and waterbirds (eared grebes) guild.Table 2.6.
Primary resources important for waterbirds (pelicans) guild.Table 2.7.
Primary resources important for waterbirds (rails and gallinules) guild.Appendix 3. Saline Lake Ecosystems Integrated Water Availability Assessment Stakeholder Engagement Process
Engagement Approach
The USGS Saline Lake Ecosystems Team collaborated with staff from the Department of the Interior (DOI) Office of Collaborative Action and Dispute Resolution (CADR) to design a workshop protocol to elicit input from stakeholders on data gaps and monitoring priorities focused on three geographic regions across the Great Basin study area. Three identical workshops were offered, focused on gaining State and local perspectives related to knowledge gaps and assessment priorities. All three workshops were held in autumn 2022. CADR serves to improve the efficiency and effectiveness of DOI operations, enhance communication, and strengthen relationships within the DOI and with all customers, constituents, private organizations, and businesses, Federal, State, Tribal and local government entities, and local communities with which the Department interacts to accomplish its work.
Key individuals were identified in the USFWS associated with terminal-lake management and decision-making at the local refuge, regional, and national scale. Partners at USFWS were engaged at the onset of the effort and were key participants in the workshops and throughout the process. To identify workshop participants, USGS identified stakeholders that represented a diverse array of organizations, bureaus, and agencies from across the Great Basin. The list included about 200 individuals representing State and local organizations as well as individuals from Federal, Tribal, and non-governmental organizations. An invitation was sent to everyone on the stakeholder list. The invitation requested that organizations identify individuals who would act as representatives of their respective organizations to allow for equal representation of different thoughts and concerns. Figures 3.1–3.3 show the combined results of organizations represented at all three of the workshops. Many institutions had multiple representatives participating in the workshops, some representing different departments within an institution (for example, the State of Utah had representatives from the Utah Division of Water Resources, the Utah Division of Wildlife Resources, and Utah Department of Natural Resources—Division of Forestry, Fire and State Lands, etc.).

Workshop participation by representatives from State, Tribal, industry, and non-governmental organizations (NGOs).

Workshop participation by Federal government entities including the U.S. Forest Service, Natural Resources Conservation Service, Bureau of Reclamation, Bureau of Land Management, U.S. Fish and Wildlife Service, and U.S. Geological Survey.

Workshop participation by non-governmental organizations (NGOs).
State and Local Workshop Method
Each workshop was held virtually on two consecutive days from October 18 to November 9, 2022. The workshops were hosted by USGS working in the following three geographic regions: (1) northern Nevada and eastern California geographic region; (2) Great Salt Lake geographic region; and (3) southeastern Oregon geographic region. Each workshop featured USGS presentations about the Saline Lake Ecosystems IWAAs and had invited speakers from the geographic regions present in two sessions. The sessions were focused on data-collection activities and knowledge gaps at the Great Basin regional scale and on terminal lake-specific information (for example, Lake Abert science and knowledge gaps).
Data from the workshops consisted of notes from note takers, polling question responses, and white board material. During the 2-day workshop, participants took part in four breakout-group discussions, each 10–30 minutes in length. Prior to being assigned to a breakout group, participants were given breakout discussion guidelines and topics for the groups to discuss. Breakout session topics, which were addressed individually in each breakout session and targeted to the geographic region, were as follows:
-
• Given that the terminal lakes of the Great Basin act as an interconnected system, which Great Basin terminal lakes are of greatest concern today for you and your organization?
-
• What information and knowledge are missing to understand the interconnectedness of the Great Basin and its suitability for birds and other wildlife?
-
• What past or current relevant data-collection activities has your organization completed in the Great Salt Lake watersheds? Are the data available and accessible?
-
• What information and knowledge are missing in the Great Salt Lake watersheds that would be useful to help answer science questions?
-
• What science-based information is required to make decisions regarding land, resource, or wildlife actions? What science information is useful when taking management actions?
-
• What science information is missing for the Great Salt Lake watersheds and the migratory birds and other wildlife the watersheds support?
Each breakout-group discussion was facilitated by a USGS employee and had a USGS notetaker. Participants were encouraged to share their responses to discussion questions using electronic white boards, in the group chat, or verbally in their breakout room. At the end of each breakout session, facilitators were asked to share a summary of their group’s discussion with all workshop participants and follow-up discussion and questions took place. Additional large group discussion also occurred during the feedback sessions, facilitated by CADR.
Along with breakout-group discussions, participants were presented with a series of questions using a polling software application. Questions elicited open-ended feedback, word cloud responses, and prioritization of specific topics. The polling questions were intended to stimulate discussion in the large group and breakout sessions. Each session had similar questions that were targeted to the geographic region. The polling questions were as follows:
-
• What bird guild do you consider the highest priority when considering terminal lakes of the Great Basin?
-
• We have been introduced to some of the landscape-scale data collection and assessment activities. What are three words that represent key mechanisms that interconnect the Great Basin landscape?
-
• What are three reasons why Great Salt Lake is unique to the Great Basin?
-
• What decisions, relative to Great Salt Lake, do land, resource, and wildlife managers need science to inform?
-
• The literature review highlighted key hydrologic processes and information to consider as criteria for developing a prioritization framework for USGS saline lakes science planning. Please rank the topics to indicate your highest-to-lowest priorities (water use, water budget, water quality, bathymetry, upgradient surface water, lake/wetlands surface water, groundwater, watershed characteristics, hydrologic decline, hydrologic vulnerability).
-
• The literature review highlighted key ecologic, biologic processes and information to consider as criteria for developing a prioritization framework for USGS saline lakes science planning. Rank the following topics to indicate your highest-to-lowest priorities (primary production, food/prey availability, food/prey composition, aquatic fish and other wildlife, threatened species/species of concern, habitat [defined by species], bird population demographics, bird population abundance/trend, bird dispersal among saline lakes watersheds, disease/contaminant/health).
Workshop Outcome and Application
The workshop process resulted in a ranking of the importance of waterbird guilds (open-water birds, shorebirds, wading birds, and waterfowl) across the Great Basin terminal lakes. The highest-ranked categories and guilds were those identified as needing additional understanding to inform conservation and management efforts. Stakeholders also ranked hydrologic and ecologic information needs in the workshops. Results of the workshops were used as part of the Gap Analysis process, which combined a synthesis and assessment of available literature and data on hydrological and ecological information. Specifically, priorities identified in the stakeholder workshops also led the science planning team to conduct additional reviews and analyses of the identified literature (see app. 1, table 1.3). Complete documentation of the Gap Analysis process is available in appendix 1. Results of the Gap Analysis ultimately informed the overall Science Strategy. A summary of the State and local workshop outcomes is available on the USGS Saline Lake Ecosystems IWAAs website (U.S. Geological Survey, 2022a, 2022b85).
References Cited
U.S. Geological Survey, 2022a, Saline lakes ecosystems integrated water availability assessment: U.S. Geological Survey web page, accessed November 12, 2023, at https://www.usgs.gov/special-topics/saline-lakes-ecosystems-integrated-water-availability-assessment.
U.S. Geological Survey, 2022b, Documents: U.S. Geological Survey web page, accessed November 12, 2023, at https://www.usgs.gov/special-topics/saline-lakes-ecosystems-integrated-water-availability-assessment/documents.
Conversion Factors
Datum
Unless otherwise indicated, horizontal coordinate information is referenced to the North American Datum of 1983 (NAD 83).
Abbreviations
BLM
Bureau of Land Management
CADR
Department of the Interior Office of Collaborative Action and Dispute Resolution
DOI
Department of the Interior
GBIF
Global Biodiversity Information Facility
IWAAs
Integrated Water Availability Assessment
NGOs
non-governmental organizations
NHD
National Hydrography Dataset
NWIS
National Water Information System
Reclamation
Bureau of Reclamation
USFWS
U.S. Fish and Wildlife Service
USGS
U.S. Geological Survey
WQP
Water Quality Portal
For information about the research in this report, contact the
Director, Forest and Rangeland Ecosystem Science Center
U.S. Geological Survey
777 NW 9th Street, Suite 400
Corvallis, Oregon 97330
https://www.usgs.gov/centers/forest-and-rangeland-ecosystem-science-center
Director, Utah Water Science Center
U.S. Geological Survey
2329 West Orton Circle
Salt Lake City Utah 84119-2047
https://www.usgs.gov/centers/utah-water-science-center
Manuscript approved on November 22, 2023
Publishing support provided by the U.S. Geological Survey
Science Publishing Network, Tacoma Publishing Service Center
Edited by John Osias
Design and layout by Yanis Xavier Castillo
Illustration support by JoJo Mangano
Disclaimers
Any use of trade, firm, or product names is for descriptive purposes only and does not imply endorsement by the U.S. Government.
Although this information product, for the most part, is in the public domain, it also may contain copyrighted materials as noted in the text. Permission to reproduce copyrighted items must be secured from the copyright owner.
Suggested Citation
Frus, R.J., Aldridge, C.L., Casazza, M.L., Eagles-Smith, C.A., Herring, G., Hynek, S.A., Jones, D.K., Kemp, S.K., Marston, T.M., Morris, C.M., Naranjo, R.C., Nell, C.S., O’Leary, D.R., Overton, C.T., Pulver, B.A., Reichert, B.E., Rumsey, C.A., Schuster, R., and Smith, C.D., 2023, Integrated science strategy for assessing and monitoring water availability and migratory birds for terminal lakes across the Great Basin, United States (ver. 1.1, May 2025): U.S. Geological Survey Circular 1516, 80 p., https://doi.org/10.3133/cir1516.
ISSN: 2330-5703 (online)
Study Area
| Publication type | Report |
|---|---|
| Publication Subtype | USGS Numbered Series |
| Title | Integrated science strategy for assessing and monitoring water availability and migratory birds for terminal lakes across the Great Basin, United States |
| Series title | Circular |
| Series number | 1516 |
| DOI | 10.3133/cir1516 |
| Edition | Version 1.0: December 23, 2023; Version 1.1: April 2025 |
| Publication Date | December 22, 2023 |
| Year Published | 2023 |
| Language | English |
| Publisher | U.S. Geological Survey |
| Publisher location | Reston, VA |
| Contributing office(s) | Forest and Rangeland Ecosystem Science Center |
| Description | Report: v, 68 p.; 2 Data Releases |
| Country | United States |
| State | California, Idaho, Nevada, Oregon, Utah, Wyoming |
| Other Geospatial | Great Basin |
| Online Only (Y/N) | Y |