

Revised Marine Bird Collision and Displacement Vulnerability Index for U.S. Pacific Outer Continental Shelf Offshore Wind Energy Development
Links
- Document: Report (1.8 MB pdf) , XML
- Data Release: USGS data release - Data for the revised marine bird Collision and Displacement Vulnerability Index for Pacific Outer Continental Shelf offshore wind energy development
- Version History: Version History (2 KB txt)
- Download citation as: RIS | Dublin Core
Acknowledgments
This study was funded, in part, by the U.S. Department of the Interior, Bureau of Ocean Energy Management (BOEM), Pacific Regional Office, Camarillo, California, through Intra-Agency Agreement Number M20PG00028 with the U.S. Geological Survey. This report has been technically reviewed by BOEM and has been approved for publication. The views and conclusions contained in this document should not be interpreted as representing the opinions or policies of BOEM. Thank you to Dr. Ruth Dunn, Dr. Rueda-Uribe, and Deborah Jaques for providing additional Flight Activity information beyond what they had published, when requested. We would also like to acknowledge Darrin Thome and Tom Kimball of the U.S. Geological Survey for their support and feedback and Erika Sanchez-Chopitea and Christina Flora of the U.S. Geological Survey for data publication guidance. Thank you to our reviewers for their thorough and thoughtful feedback.
Abstract
The installation of offshore wind energy infrastructure (OWEI) at sea may affect marine birds by increasing the risk of mortality from collision with OWEI (Collision Vulnerability) and causing disturbance and displacement from important habitats (Displacement Vulnerability). In 2017, we published the first comprehensive database quantifying marine bird Collision Vulnerability and Displacement Vulnerability to potential OWEI in the region of the U.S. Pacific Outer Continental Shelf (POCS; waters within the Exclusive Economic Zone of California, Oregon, and Washington). We have updated this Vulnerability Index with new research and data, additional species present in the POCS, and an evolved understanding of the application and utility of the Index. Of the species assessed, phalaropes and Red-billed Tropicbird have the highest Collision Vulnerability, and gulls, terns, jaegers, skuas, and pelicans have moderately high Collision Vulnerability. Boobies, sea ducks, and pelicans have the greatest Displacement Vulnerability. The overall trends in ranked Vulnerability among marine birds in the POCS were consistent between Version 1 and Version 2 although new data and revised calculations updated the outcomes. Alcids, loons, storm-petrels, Brant, and phalaropes ranked higher for Collision Vulnerability in Version 2 compared to Version 1; sea ducks, cormorants, skua, and jaegers ranked lower for Collision Vulnerability in Version 2 compared to Version 1. Displacement Vulnerability ranks were higher in Version 2 for gulls, pelicans, sea ducks, and alcids and lower for albatrosses, terns, and loons. Vulnerability Index Version 2 is an up-to-date, representative, and transparent assessment of marine bird vulnerability to potential offshore wind energy development. This updated Vulnerability Index can assist resource managers and others in understanding and addressing potential interactions between OWEI and marine bird species that inhabit the POCS.
Introduction
Offshore wind energy is a rapidly developing renewable energy source for coastal communities. Seabirds are among the most threatened groups of birds, due in part to their exposure to cumulative anthropogenic threats (Croxall and others, 2012; Maxwell and others, 2013; Phillips and others, 2023). The installation of OWEI at sea may affect seabirds and other marine bird species in several ways, including adding potential collision with OWEI (Collision Vulnerability [CV]) and changing foraging and movement costs associated with disturbance and displacement of individuals within their habitats at sea (Displacement Vulnerability [DV]).
The U.S. Pacific Outer Continental Shelf (POCS; the Exclusive Economic Zone off California, Oregon, and Washington) supports diverse and abundant marine bird species that breed in or migrate to and through the California Current Large Marine Ecosystem (fig. 1). Marine bird species of conservation concern are found throughout the POCS, including several listed as threatened or endangered under the Endangered Species Act of 1973 (https://www.govinfo.gov/app/details/STATUTE-87/STATUTE-87-Pg884, as amended); several also listed as State species of conservation concern within California, Oregon, and Washington; and several long distance migrants that are recognized as endangered in other countries (for example, Pink-footed Shearwater [Adrenna creatopus]). In 2017, we published the first comprehensive database to quantify marine bird vulnerability to potential OWEI in the POCS (Adams and others, 2017; Kelsey and others, 2018). This Vulnerability Index Version 1 built upon similar indexes created for the OWEI in the North Sea and the U.S. Atlantic Outer Continental Shelf (Garthe and Hüppop, 2004; Desholm, 2009; Furness and Wade, 2012; Furness and others, 2013; Robinson Willmott and others, 2013). By drawing from metrics that quantified marine bird life history, characteristics, and behaviors, Version 1 generated relative Population Vulnerability (PV), CV, and DV for all marine bird species in the POCS.
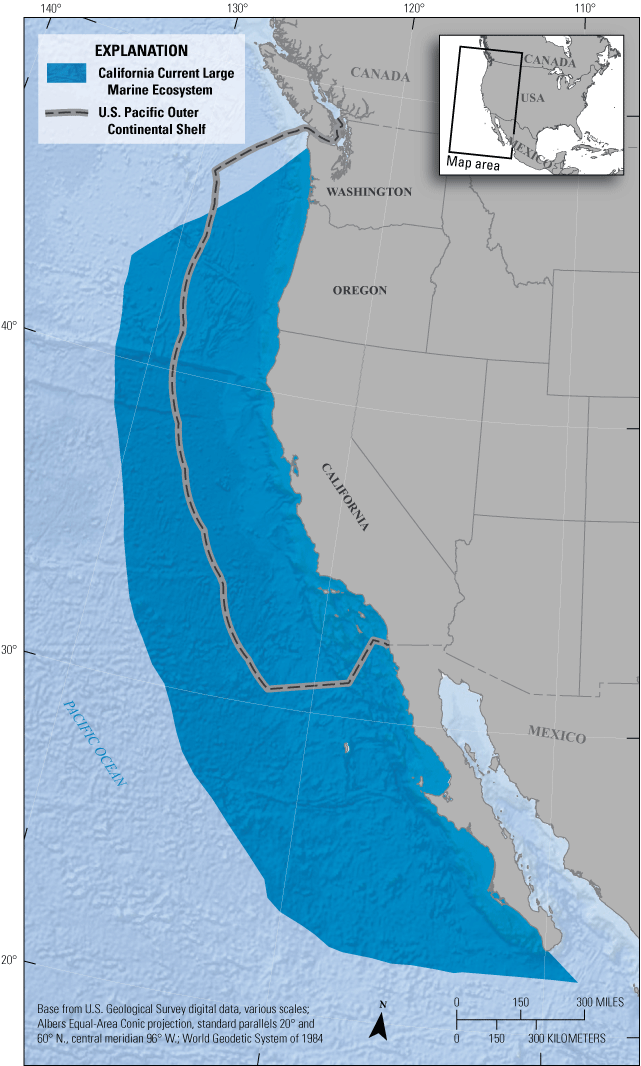
Map of the U.S. Pacific Outer Continental Shelf (gray line with dashed-black line) in relation to the California Current Large Marine Ecosystem (dark-blue shading) along the west coast of North America, including California, Oregon, and Washington.
Since Version 1 was completed, new research and data have become available, increasing our understanding of marine bird vulnerability to potential OWEI. In addition, changing oceanographic conditions have brought new species into the POCS. Furthermore, our understanding regarding the development and application of Vulnerability Indexes have evolved based on practitioners’ use of Version 1 within the POCS and studies in other parts of the world. Thus, to better inform potential offshore wind energy development in the POCS, we have updated the marine bird Vulnerability Index to include the following:
-
• New research and data
-
• Additional species present in the POCS
-
• Calculation updates to better reflect the application of the index
Herein, we present Version 2 of our Vulnerability Index, which provides a current (as of 2024), transparent, and representative quantification of marine bird vulnerability to potential OWEI in the POCS. In cooperation with BOEM and to support their management decisions, the Vulnerability Index Version 2 can be used to inform research, evaluation, and planning for offshore wind energy development in this region.
Methods
Herein, we describe general methodological updates since our Vulnerability Index Version 1, including species selection, literature used, and equation and metric updates. We also describe our specific methods for generating Collision Vulnerability and Displacement Vulnerability.
Vocabulary
The words “vulnerability” and “sensitivity” are used to describe the quantification of marine bird interactions with OWEI. Garthe and Hüppop (2004) used both terms, creating a Sensitivity Index that quantified metric values of marine bird interactions with OWEI and then applied it spatially to species distributions to generate “vulnerability” values. Desholm (2009) also used “sensitivity” to refer to their Index values. Furness and others (2013) used “vulnerability” to refer to their Index values. Robinson Willmott and others (2013) used the terms “sensitivity” and “vulnerability” in describing their marine bird index values; however, they use “sensitivity” to refer to their Index values (for example, Population Sensitivity, Collision Sensitivity, and Displacement Sensitivity). Since the publication of these indexes quantifying marine bird interactions with OWEI, as well as Version 1 of this index, these terms have continued to be used and defined in the context of marine bird interactions with OWEI (Goodale and Milman, 2016; Gușatu and others, 2021; Croll and others, 2022). We recognize that the way we use the term “vulnerability” to describe the indexes of Collision Vulnerability and Displacement Vulnerability presented in this study may differ from the use of the term in other studies; however, this usage is consistent with Version 1 and understood by outside user groups. The abbreviations, names, and definitions of the Vulnerability Indexes and their associated metrics are found in table 1.
Table 1.
Abbreviations, names, and definitions of Version 2 Vulnerability Indexes, and their associated metrics, used to quantify marine bird vulnerability to potential offshore wind energy infrastructure (OWEI) in the U.S. Pacific Outer Continental Shelf Region.[—, not available; m, meter]
We define marine birds as all species that spend a signification portion of their time in the waters of the POCS. We include additional, rarely-seen species (even if they are in low abundance) that rely on important habitats in the POCS. Refer to the “Species Selection” section below for more details.
Species Selection
In Version 1, we generated relative Vulnerability values for 81 marine bird species in the POCS. The selection of 81 species was based on historical survey records and was supplemented with species that did not appear on surveys but are known to exist in the POCS based on the available literature (K.T. Briggs, Pacific OCS Region Minerals Management Service, unpub. data, 1981; K.T. Briggs, Pacific OCS Region Minerals Management Service, unpub. data, 1983; Briggs and others, 1992; Mason and others, 2007; Adams and others, 2014). We added eight new species to Version 2 based on an improved understanding of some species’ distributions and range shifts that brought new species into the POCS (Orta and others, 2020; Kirwan and others, 2023; Mlodinow and Pyle, 2023; Howard and others, 2024). Along with the 81 species from Version 1, the 8 new species included in Version 2 are Guadalupe Murrelet (Synthliboramphus hypoleucus), Red-billed Tropicbird (Phaethon aethereus), Townsend’s Storm-Petrel (Hydrobates socorroensis), Red-footed Booby (Sula sula), Cocos Booby (Sula brewsteri), Masked Booby (Sula dactylatra), Nazca Booby (Sula granti), and Blue-footed Booby (Sula nebouxii). We also specify that only one subspecies of Northern Fulmar (Pacific Northern Fulmar [Fulmarus glacialis rodgersii]) is present in the POCS (Mallory and others, 2020). Herein, we provide updated vulnerabilities for 89 species in the POCS (table 2). Species are listed in the database and reported upon herein, based on the 2023 avian taxonomic order (Clements and others, 2023). In the database of POCS marine bird vulnerability associated with this report, we also provide the American Ornithological Society taxonomic ordering (Chesser and others, 2024; Kelsey and others, 2025).
Table 2.
The 89 marine bird species of the U.S. Pacific Outer Continental Shelf Region evaluated in the Vulnerability Index include species group, common name, scientific name, and 4-letter alpha code.Literature Used
We reviewed and added relevant literature published since Version 1 was published in 2017 (Adams and others, 2017). In 2016, we established a Google Scholar alert to receive notifications of any newly published literature using the following search terms: (1) seabird “offshore wind farm” and (2) seabird with either “vulnerab*” or “sensitiv*.”
Since 2016, we have saved any relevant literature identified with this Google Scholar alert. For Version 2, we also searched for sources in the Tethys Knowledge Base which is an up-to-date compilation of all documents, publications, and information relevant to the environmental effects of wind energy (Tethys, 2023). We filtered the Tethys Knowledge Base using the following keyword and timeframe filter options: (1) Technology: “Wind Energy”; (2) Receptor: “Seabirds,” “Waterfowl,” “Shorebirds”; and (3) Year published: “2016–23.”
We also performed focused literature searches for the eight new species added to the database in Version 2; all literature selected using these criteria were reviewed and data were added to the Version 2 database along with the appropriate citation for reference. When sources used to generate Version 1 metric values were still relevant, we maintained those values and associated citations. When we found pertinent review papers, we tried to seek out any relevant referenced sources and used available primary sources.
In some cases, recognizing literature unrelated to OWEI research can also inform metric values, we performed additional, metric-specific searches. The methods for metric-specific searches are described in the following four metric method sections: “Flight Activity,” “Time Spent in Rotor Swept Zone,” “Macro-Avoidance,” and “Habitat Specificity.”
Equation and Metric Updates
In Version 1, we quantified relative PV, CV, and DV values for marine bird species in the POCS. Since the publication of our Vulnerability Index Version 1, BOEM and others have used Version 1 to inform marine spatial planning (Carlton and others, 2024). By participating in and evaluating these marine spatial planning applications, we realized that PV (Adams and others, 2017; Kelsey and others, 2018), which used metrics such as population size and threat status to quantify a species relative population-level vulnerability, may confuse or complicate spatial applications. When applying the Vulnerability Indexes spatially, some PV metrics (for example, the proportion of the population present in the POCS and a species’ percentage of time spent in the POCS) were redundant with seasonally constrained spatial data. Spatial applications, such as Carlton and others (2024), represent an informed use of our marine bird Vulnerability Index. Some users may still find Version 1 PV useful; however, here we focused exclusively on updating the CV and DV Indexes.
Version 1 CV and DV values were calculated from metrics that quantified life history characteristics and behavior using ordinal ranked values (1–5). For example, metric values for FA (the amount of time a bird spends in flight over the ocean, as opposed to the time spent on land or floating on the water) ranged from 1 (0–20 percent of its time in flight) to 5 (81–100 percent of its time in flight). Shavykin and Karnatov (2022) demonstrated that using ordinal ranking and categorization of the quantitative measures in Vulnerability Indexes can be misleading and distort the results of mathematical computations used to generate Vulnerability Indexes. They suggested that Vulnerability Indexes be constructed using continuous, ratio scale values that are more quantitatively appropriate than ordinal scaling. Therefore, in Version 2, we used continuous, ratio scale data values derived from published data for all metrics. For example, the best available data indicated that Leach’s Storm-Petrel (Hydrobates leucorhoa) spend 62 percent of time in flight (Bonnet-Lebrun and others, 2021). In Version 1, these data would have resulted in a Leach’s Storm-Petrel FA score of 5; however, in our updated Version 2, these data results in an FA of 0.62. In Version 2, we updated all ordinal-based metrics scores to continuous values between 0 and 1.
To increase transparency and implement more appropriate quantification in Version 2, we updated the CV and DV equations metrics and equations. The specific updates to the Index metrics and equations in Version 2 are described in detail in the “Collision Vulnerability” and “Displacement Vulnerability” sections. Our general approaches for deriving metric values from published data relevant to a species in the POCS are described here. If a data source provided multiple values or a range of values, we used the midpoint of those values in the database. When we obtained values from multiple sources, we took the median of all values as the final metric value. When metric value data were unavailable for a given species, we used data from a similar species. Similar species included similar POCS species and their most similar counterparts globally (for example, gulls). In cases where similar species were data rich, we further focused on taxonomic groupings (for example, large gull, medium gull, and small gull). Thus, if data didn’t exist for a given POCS species, we used the best available information in the absence of species-specific data.
Collision Vulnerability (CV)
We define Collision Vulnerability as the relative proportion of time a bird of a given species is vulnerable to collision with OWEI. It is important to note that CV values are not analogous to collision risk model outputs or the probability of collision for a given species. In Version 1, CV was defined in a mixed additive and multiplicative equation (Adams and others, 2017; eq. 1). Collision Vulnerability was then updated based on peer reviewer suggestions and revisions in Kelsey and others (2018; eq. 2), where Nocturnal Flight Activity (NFA) and Diurnal Flight Activity (DFA) were given equal weighting. In these original additive frameworks of equations 1 and 2, a bird would still have CV even if it spent no time flying in the Rotor Swept Zone (RSZt). In addition, the ordinal values used in equations 1 and 2 were not consistently or linearly related to raw values for each metric (table 3). For example, a “3” for NFA represented 41–60 percent time flying at night, whereas a “3” for RSZt represented 5–20 percent RSZt. Therefore, we determined that the equations in Adams and others (2017; eq. 1) and Kelsey and others (2018; eq. 2) yielded unequal weighting in values among metrics in the original Version 1 CV equation. In Version 2 (eq. 3), we removed the additive effects and replaced the ordinal scaling of metrics with continuous values (0–1) from raw data (table 3).
whereCV
is Collision Vulnerability,
NFA
is Nocturnal Flight Activity,
DFA
is Diurnal Flight Activity,
RSZt
is time spent in the Rotor Swept Zone, and
MA
is Macro-Avoidance*
CV
is Collision Vulnerability,
NFA
is Nocturnal Flight Activity,
DFA
is Diurnal Flight Activity,
RSZt
is time spent in the Rotor Swept Zone, and
MA
is Macro-Avoidance*
Table 3.
Reclassification table of Versions 1 and 2 values for each Collision Vulnerability term.[All metrics are defined in table 1. Abbreviations: DFA, Diurnal Flight Activity; FA, Flight Activity; MA, Macro-Avoidance; NFA, Nocturnal Flight Activity; RSZt, time spent in the Rotor Swept Zone; V1, Version 1, metric values and definitions used in Adams and others (2017) and Kelsey and others (2018); V2, metric values used in this analysis; <, less than; >, greater than; —, no data]
Nocturnal Flight Activity and DFA values were not kept separate in this update. Instead, we used an overall FA metric. Separate NFA and DFA values were retained where available and averaged to determine the FA value. Refer to the “Flight Activity” section for more details.
Flight Activity (FA)
A bird risks collision with OWEI while in flight and the amount of time a bird spends in flight can vary greatly among species. We quantified the overall percentage of time flying (Flight Activity, FA) for the 89 species in the POCS. We used information from the Birds of the World accounts (Billerman and others, 2022; https://birdsoftheworld.org/bow/home), Vulnerable Index Version 1 of our marine bird Vulnerability Index, at-sea survey data (Drew and others, 2005; Adams and others, 2016; Takekawa and others, 2017; Adams and others, 2020), and tracking data found during literature searches. In literature searches, we searched by species group (for example, loons), in association with each of the following phrases as standardized search terms to find all relevant sources:
-
• Daily activity patterns
-
• Global location sensing (GLS)
-
• Nocturnal flight behavior
-
• Diurnal flight behavior
-
• Percentage of time in flight
-
• Migratory behavior
-
• Movement behavior
-
• Activity budget
-
• Foraging behavior
We used boat-based and aerial seabird observations within the POCS (Adams and others, 2016; Takekawa and others, 2017) and the North Pacific more broadly (Drew and others, 2005) to quantify DFA (because surveys were performed during the day). We combined the two regional POCS aerial survey datasets to spatially represent most of the POCS: (1) off southern California (Takekawa and others, 2017) and (2) off northern California, Oregon, and Washington (Adams and others, 2016). In all at-sea datasets, birds were recorded as either flying or on the water. For each species (or species group) with greater than 100 sightings in the combined databases, we calculated the ratio of flying individuals to all individuals recorded to estimate the DFA. We did not use these data for species known to spend a considerable percentage of their time on land (for example, cormorants and terns) because the ratio of birds that were flying versus on the water is biased by the number of uncounted birds that were on land at the time of the surveys.
In Version 1, we quantified NFA and DFA values separately (eqs. 1, 2). In Version 2, we retained records of NFA and DFA values when available, and then averaged them for a final value, creating the metric FA_N&D (Nocturnal and Diurnal Flight Activity; eq. 3). However, we also included studies that quantified FA but did not differentiate between nocturnal and diurnal periods; in these cases, we recorded the median of all published 24-hour FA (FA24) values from a literature source (eq. 3).
Our method for determining the final FA value used in equation 3 considering FA_N&D and FA24 values necessitated an approach that varied among species and was dependent on which data inputs were available for a given species. One FA variable is the proportion of daylight, and thus the proportion of time spent flying during day and night, which can vary with season and latitude for a given species. We prioritized FA estimates that were most representative of the latitudes of the POCS and the seasons that a given species spends within the POCS. In some cases, when information on NFA and DFA was limited, we assumed equal periods (12 hours) of the day (light) and the night (dark) for a 24-hour day when determining NFA and DFA values. As an example of how FA was generated, consider FA for the storm-petrel species in the POCS below. Species-specific FA values were available for two POCS storm-petrels:
-
Leach’s Storm-Petrel—24-hour FA during migration and non-breeding periods was published in Bonnet-Lebrun and others (2021):
0.5 (non-breeding season), 0.62 (outward migration), and 0.61 (return migration); thus,
FA24=median(0.5, 0.62, 0.71)=0.62.
Because we found no other data for Leach’s Storm-Petrel, FA=0.62.
-
Townsend’s Storm-Petrel—NFA and DFA values during the nonbreeding season were published in Medrano and others (2024):
NFA=0.73.
DFA=0.31; thus,
FA_N&D=(0.73+0.31)/2=0.52.
Because we found no other data for Townsend’s Storm-Petrel, FA=0.52.
For all other storm-petrel species in the POCS, we used the above values for Leach’s and Townsend’s Storm-Petrels, in addition to published values from other similar species:
-
Cape Verde Storm-Petrel—FA24=0.60 (Medrano and others, 2022)
-
Ainley’s Storm-Petrel—NFA=0.52, DFA=0.33 (Medrano and others, 2024)
-
European Storm-Petrel—NFA=0.82, DFA=0.55 (Militão and others, 2022)
-
Storm-Petrel species—ratio of flying storm-petrels; all storm-petrels on aerial surveys—DFA=0.98 (Adams and others, 2016; Takekawa and others, 2017)
-
Storm-Petrel species—ratio of flying storm-petrels; all storm-petrels on North Pacific Pelagic Seabird Database surveys—DFA=0.68 (Drew and others, 2005)
NFA=median(0.52, 0.73, 0.80)=0.73
DFA=median(0.31, 0.33, 0.55, 0.98, 0.68)=0.55; thus,
FA_N&D=(0.73+0.55)/2=0.64, and,
FA24=median(0.50, 0.60, 0.62, 0.71)=0.61.
We averaged FA24 and FA_N&D values, when available, to generate FA for all other Storm-petrel species—FA=mean(FA_N&D, FA24)=mean(0.64, 0.61)=0.62.
Time Spent in Rotor Swept Zone
Birds are vulnerable to collision with OWEI turbine blades when flying within the rotor sweep zone. We collated estimates of RSZt for all species, or from similar species where species-specific estimates were lacking, and reported the median RSZt for each species. In Version 1, we defined the rotor swept zone at 10–200 meters (m). We chose the lower rotor swept zone limit of 10 m to be consistent with Ainley and others (2015). For our Version 2 update, we revisited the latest rotor swept zone height estimates for turbines proposed for the POCS. Due to the bathymetry of the POCS, all OWEI in this region will be built on floating, anchored platforms. One of the few existing floating offshore wind turbines as of 2023, Hywind Tampen, has a hub height of 105 m and a rotor diameter of 167 m, resulting in a 21–189-m rotor swept zone (ABSG Consulting, Inc., 2021). This rotor swept zone height is consistent with most marine bird RSZt studies, which estimate the amount of time birds of a given species spend between 20- and 200-m rotor swept zone height. Therefore, in Version 2, we defined the rotor swept zone as 20–200 m above the ocean to accommodate the most accurate information on RSZt.
Consistent with the other Vulnerability Index metrics, we used ordinal RSZt values in Version 1. Furthermore, due to the limited amount of flight height data available, we binned RSZt estimates into three large ranges in Version 1: (1) 5=greater than 20 percent, (2) 3=5–20 percent, and (3) 1=less than 5 percent. Since publishing Version 1, the number of studies quantifying marine bird flight heights has greatly increased, especially in the context of rotor swept zone height. Through a combination of Global Positioning System (GPS) tracking, range finders, and coupling radar and camera data, flight height estimations are becoming more accurate for a greater number of species. Therefore, in Version 2, RSZt values represent the estimated percentage of time spent flying within the 20–200-m rotor swept zone height for a given species (as a value between 0 and 1, or for a similar species when data for a given species were not available).
Macro-Avoidance (MA)
A bird’s likelihood of avoiding OWEI influences its potential CV (higher likelihood of avoidance leads to lower CV) and DV (higher likelihood of avoidance leads to higher DV). We recognize three broad types of avoidance behavior: (1) Macro-Avoidance (MA; change in flight course to avoid entering a wind farm area), (2) meso-avoidance (change in flight direction within a wind farm area to avoid wind turbines), and (3) micro-avoidance (last-minute flight movements to avoid a specific turbine; Cook and others, 2014). In our Vulnerability Index, we focus on MA, which affects CV and DV directly (albeit with the opposite effect). Cook and others (2014) highlight that gulls, in particular, display avoidance behavior but at a micro-avoidance level (for example, a Herring Gull is estimated to have an MA rate of 0 but a micro-avoidance rate of 0.99; Cook and others, 2014). Accordingly, we did not include values from studies that reported overall OWEI avoidance rates because these studies included micro-avoidance rates.
We define MA as the proportion of birds displaced from OWEI areas that would have been expected to be there otherwise (for example, MA=0.10 represents a decrease of 10 percent in species abundance compared to baseline abundance numbers; Cook and others, 2014). We retained existing MA data used in Version 1 of the Vulnerability Index and data from MA studies published since Version 1. Macro-Avoidance has been a major focus of post-construction studies at existing OWEI sites, and there were considerable new data available to incorporate. However, data are still deficient for many POCS species (for example, albatrosses and pelicans). When data were not available for POCS species, we estimated MA based on MA measured at OWEI for similar species.
In Version 1, MA was given inverse ordinal values for CV versus DV because MA has an inverse effect when considering the two types of Vulnerability (Adams and others, 2017; Kelsey and others, 2018). Herein, with revised, continuous MA values (0–1) derived from the literature, we quantify MA the same way for CV and DV (low value is low MA, and high value is high MA). For CV, the focus is the birds that are not macro-avoiding OWEI, and thus, we used the inverse (1–MA) in our revised CV equation (eq. 3).
Displacement Vulnerability (DV)
We define DV as the likelihood that a bird of a given species will be displaced from its habitat by the presence of OWEI. In the Vulnerability Index Version 1, DV incorporated MA (described in the “Macro-Avoidance” section) and Habitat Flexibility (HF) for a species using an additive framework (table 4; eq. 4). In the Vulnerability Index Version 1 additive framework, the ordinal values assigned for each metric were not linearly related to raw values, which gave unequal weighting to values across metrics in the final equation. Therefore, we changed the DV equation to be multiplicative. In Version 2, DV (eq. 5) is the proportion of birds from a given species expected to be displaced from their preferred habitat by OWEI (see the “Macro-Avoidance” section), times the inability of that species to fulfill their habitat needs elsewhere (HS; table 1). Consistent with the Version 2 CV, in Version 2 DV, we used continuous values (0–1) for the MA metric instead of ordinal 1–5 values. In addition, we reworked Version 2 HS to be more quantifiable. In Version 1, we called this metric HF and generated subjective, ordinal values to represent it. In Version 2, we renamed the metric to better describe the specificity of a given species’ habitat as opposed to its flexibility; we restructured the values on a 0–1 scale (consistent with other Version 2 metrics), and we made edits to the structure of the information inputs to make the HS metric more quantifiable (table 4; eq. 5).
where whereTable 4.
Reclassification table of Versions 1 and 2 values for each Displacement Vulnerability term.[All metrics are defined in table 1. Abbreviations: HS, Habitat Specificity; MA, Macro-Avoidance; V1, Version 1, metric values and definitions used in Kelsey and others (2018); V2, Version 2, metric values used in this analysis; >, greater than]
Habitat Specificity (HS)
Habitat Specificity is a function of how diverse a species’ needs are (Foraging Specificity [FS]) and the likelihood that, if an individual of that species were displaced by OWEI, they would be able to find an unaffected available habitat elsewhere (Spatial Specificity [SS]). In Version 1, we called this metric HF; however, we have since realized that we were quantifying inflexibility (in other words, specificity), not flexibility per se. Furthermore, Version 1 used subjective and qualitative ordinal rankings, as shown below:
-
• 1 Species uses a wide range of foraging habitats over a large area. Species is an opportunistic forager and has the ability to switch among prey types based on availability.
-
• 2–4 Species shows some grade of behavior between 1 and 5.
-
• 5 Species has very habitat-specific and prey-specific requirements and little flexibility in the foraging range, foraging behavior, habitat selection, or diet.
Thus, to update this metric to be more transparent and quantitative, we revised our methods and renamed the metric HS. We considered two components of the ordinal HF definitions of species’ habitat for quantification: (1) a spatial component (in other words, ranging from foraging habitats over a large area to more spatially constrained, habitat-specific requirements) and (2) a foraging component (in other words, ranging from a generalist/opportunistic forager to a species with narrow, prey-specific requirements). We determined that the spatial and foraging components could be quantified separately as SS and FS and then recombined to calculate HS.
We quantified SS using species distribution models developed by Leirness and others (2021) for the POCS. Specifically, for a given species, we quantified the skewness of the distribution of predicted density values across the POCS as a measure of how broad and dispersed (low skew of distribution of density values) or isolated and aggregated (high skew of distribution of density values) a species’ estimated distribution was. Figure 2 provides an example of skewness for two species in the POCS in the summer season. The estimated summer distribution of Pink-footed Shearwater is dispersed throughout the POCS and thus has a low skewness value. In contrast, Double-crested Cormorant (Nannopterum auritum) has a more aggregated distribution, only found in a few coastal locations along the POCS, resulting in a high skewness value (fig. 2). In this Vulnerability Index, 56 of the 89 species (63 percent) had enough spatial data for Leirness and others (2021) to generate seasonal species distribution models like those shown in figure 2. We calculated skewness for each of the 56 species in Leirness and others (2021), which represented the species’ SS, by taking the weighted average of all seasonal layers. We used the sum of predicted density values for each season and gave more weight to seasons when more birds were predicted/present. We quantified the skewness of the combined, seasonally-weighted layer for each species. Skewness values were then natural-log transformed and rescaled (0–1) by dividing by the maximum species-specific SS value. For the remaining 33 species without skewness values, we generated the best estimate of SS based on skewness values for similar species modeled by Leirness and others (2021), expert opinion, and by referencing the species’ distributions mapped in eBird data (eBird, 2021).

Summer species distribution models for A, Pink-footed Shearwater; and B, Double-crested Cormorant (Leirness and others, 2021). Cormorants were more aggregated in space than shearwaters (in other words, cormorants have a greater skew value), illustrated by the shape of the cumulative distribution of predicted density (red box).
We defined FS as a function of a species’ Foraging Mode (FM; for example, deep diving, surface dipping, and plunge diving) and Prey Size/Trophic Level (ST; table 5). For a given species, we assigned one point for each unique FM used and ST in their diet (table 5); these final FM and ST scores were rescaled so that values were equally weighted across FM and ST, respectively. We averaged FM and ST and subtracted the average from one to get the final FS value for each species. We subtracted from one so that a high value would reflect high specificity, and a low value would reflect low specificity. For each species, final SS and FS values were averaged to get a final HF value between 0 and 1. Below, we provide an example using the same two species used to describe FS.
Table 5.
Options of Foraging Modes (FM) and Prey Size/Trophic Levels (ST) used by the U.S. Pacific Outer Continental Shelf (POCS) marine bird species.[To determine each species’ foraging specificity; FM and ST were enumerated, rescaled across all species FM and ST respectively, and averaged. Abbreviation: —, no data]
Pink-footed Shearwaters forage via shallow diving and surface seizing/aerial pursuit, gaining them two FM points. Double-crested Cormorants, which forage via deep diving and shallow diving, also got two FM points (table 5). Across all species, the maximum number of FM points was 4. Thus, the rescaled FM score for Pink-footed Shearwaters and Double-crested Cormorants was 2 out of 4, or 0.50. For ST, Pink-footed Shearwaters feed on small forage fishes and squids representing two prey sources, giving them an ST score of 2. In comparison, Double-crested Cormorants forage on small- and medium-sized forage fishes and invertebrates, gaining them an ST score of 3. Across all species, the maximum number of ST points was 4. Thus, Pink-footed Shearwaters got a rescaled score of 2 out of 4, or 0.50, and Double-crested Cormorants got a score of 3 out of 4, or 0.75. The final FS score was calculated by taking 1 minus the mean FM and ST scores and rescaling all scores from 0 to 1, resulting in a score of 0.67 for Pink-footed Shearwater and 0.5 for Double-crested Cormorant.
Quantifying Uncertainty
We assessed three potential sources of uncertainty associated with metric values for each species: (1) whether metric values were available for the species in question, or whether values were drawn from a similar species or estimated when no species-specific values were available; (2) the number of literature sources contributing metric values for a given species; and (3) the range of values from the data in those literature sources.
We quantified the three potential sources contributing to uncertainty (listed in the paragraph above) on a 0–1 scale for each species and metric value; for details, see the “Values from the Actual Versus Similar Species,” “Number of Literature Sources,” and “Range of Published Values” sections. We took the geometric mean of these three values to generate a singular uncertainty value for each species metric. The exception was the HS metric, for which the third uncertainty source (the range of input values) was not relevant because only one value was generated for each species (see the “Habitat Specificity” section for details). Thus, Habitat Specificity is generated from the geometric mean of the two relevant uncertainty values (actual versus similar species and the number of literature sources). We then multiplied the metric uncertainties for CV and DV to generate a final CV uncertainty (uCV) and DV uncertainty (uDV) value for each species (eqs. 6, 7).
whereuCV
is the Collision Vulnerability uncertainty;
uFA
is the Flight Activity uncertainty;
uRSZt
is the Time Spent in the Rotor Swept Zone uncertainty; and
uMA
is the Macro-Avoidance uncertainty.
uDV
is the Displacement Vulnerability uncertainty;
uMA
is the Macro-Avoidance uncertainty; and
uHS
is the Habitat Specificity uncertainty.
Values from the Actual Versus Similar Species
We assumed there was greater uncertainty associated with species for which no metric values were available in the literature, and thus, values were derived from similar species. To quantify the uncertainty associated with the difference between data from actual or similar species being used, we assigned uncertainty values between 0 and 1. Given that we used values from the most closely associated species when species-specific values weren’t available, the uncertainty values were quantified as follows:
-
0.25 Values used were from the species in question.
-
0.50 Values used were from a similar species within the same taxonomic family.
-
0.75 Values used were from a species from a different taxonomic family, or values used were estimates when no values were available that could be associated with the species in question.
Number of Literature Sources
We assumed that there was greater uncertainty associated with metric values derived from only one literature source, as opposed to metric values for which data from multiple literature sources were available. For each species, we quantified the number of sources (from the species in question or from similar species when data were lacking) used to determine the metric value. We tried to avoid referencing review papers; however, review papers were included in this count when the original source was unavailable. We found that most metric values were derived from five or fewer sources. Thus, we determined any metric value with six or more sources to be a high number of sources. When quantifying the number of sources used, we capped the number of sources at six (for example, any metric value with more than six sources used was given a source value of six). We then rescaled this value from 0 to 1 (with low numbers representing low uncertainty) by dividing the source’s value by 6 and subtracting that value from 1.
Range of Published Values
When multiple metric values were reported for a given species, we calculated the median of those values as our final metric value. We assumed that there was greater uncertainty associated with values derived from a wider range of published values, as opposed to metrics where all published values were close to one another; to quantify this uncertainty, we took the difference in the range of values for each species’ metric value (the difference between the maximum and minimum values reported). Multiple value ranges were used in the metric FA (value ranges for NFA, DFA, and FA24). In this case, we used the difference in values from the largest value range in our uncertainty quantification. Because HS values were generated from discrete components, there was no variance around the HS value, and thus, we were not able to quantify uncertainty for that metric.
Results
The raw data containing species names, metric values, and vulnerability scores can be found in the associated data release at https://doi.org/10.5066/P1OUOM9W (Kelsey and others, 2025).
Collision Vulnerability
Final CV and associated metric values for each species are listed in table 6. Phalaropes and Red-billed Tropicbird had the greatest CV. Jaegers, skuas, gulls, terns, and pelicans all had moderate CV (table 6; fig. 3). Below, we provide details on how we quantified CV metric values (FA, RSZt, and MA) for each species.
Table 6.
Collision Vulnerability (CV) for the 89 U.S. Pacific Outer Continental Shelf species along with the metric values used to generate CV.[Note that for calculating CV, MA is subtracted from 1 in the calculation (eq. 3). Abbreviations: FA, Flight Activity; MA, Macro-Avoidance; RSZt, time spent in the Rotor Swept Zone]
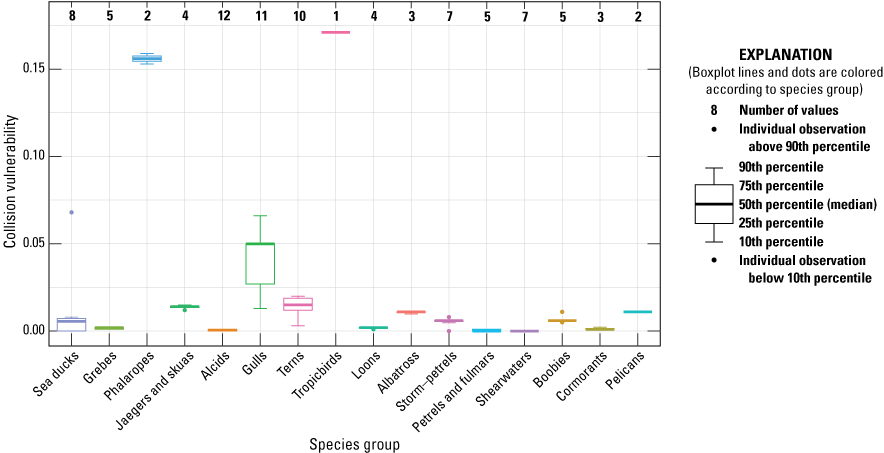
Final Collision Vulnerability by species group for the 89 species present in the U.S. Pacific Outer Continental Shelf Region. The number of species in each species group is shown along the top of the figure, and species present in each species group are listed in table 1.
Flight Activity
Flight Activity calculations varied slightly among species groups, based on data availability and species-specific behavioral differences. For many species in the POCS, we used DFA values generated from the ratio of birds seen flying and resting on the water during at-sea surveys. These surveys do not account for birds on land, which is especially relevant for breeding birds attending nest sites on land. We acknowledge this limitation when using at-sea survey data. However, the DFA values generated from at-sea survey data were the best available information for many species in the POCS. Some species also are known to roost on land during the night (for example, pelicans, cormorants, gulls, and terns). When no species-specific data were available for a night-roosting species, we used an NFA of 0.001. Below, we present the variations in FA calculations and the resulting FA values among species groups.
Brant (Branta bernicla) migrates into the POCS and overwinters in bays and estuaries along the western coast of the United States. We used at-sea survey observations of Brant (Drew and others, 2005) to generate an estimated FA of 0.69 for the POCS. Although at-sea surveys take place during the day (thus providing a DFA value), Brant are thought to fly throughout the day and night while migrating; thus, we assumed NFA equaled the DFA value calculated from at-sea survey data (Lewis and others, 2020). Although data exist for Brant FA at wintering areas, we did not incorporate those data into FA because Brant are largely resident during winter and confined within the bays and coastal areas; therefore, overwintering values were not related to FA within the POCS.
Sea ducks found in the POCS (Common Merganser [Mergus merganser]; Red-breasted Merganser [Mergus serrator]; Harlequin Duck [Histrionicus histrionicus]; and Long-tailed Duck [Clangula hyemalis]) all have an NFA of 0.001 based on species accounts that reported they do not fly at night. We derived DFA for these species from at-sea survey data (Drew and others, 2005; Adams and others, 2016; Takekawa and others, 2017). The resulting FA values were relatively low and ranged from 0.08 for Long-tailed Duck to 0.11 for Red-breasted Merganser.
Based on species accounts, scoters are thought to fly the same amount during the night as during the day while migrating through the POCS. Thus, we used values generated from daytime at-sea survey data for scoter DFA and NFA (Drew and others, 2005; Adams and others, 2016; Takekawa and others, 2017). The resulting FA values ranged from 0.07 for Surf Scoter (Melanitta perspicillata) to 0.10 for White-winged Scoter (Melanitta deglandi).
Grebes were seen in the POCS during the spring and fall migration periods, with large numbers wintering in nearshore waters (Drew and others, 2005; Adams and others, 2016; Takekawa and others, 2017; D. Pereksta, written commun., Bureau of Ocean Energy Management, 2025). Grebes fly mostly at night, with an estimated NFA of 0.15 (J. Felis, oral commun., U.S. Geological Survey, 2023). Grebe DFA was generated from at-sea survey data (Drew and others, 2005; Adams and others, 2016; Takekawa and others, 2017) and combined with the estimated NFA for the resulting FA value ranging from 0.08 (Western Grebe [Aechmophorus occidentalis] and Clark’s Grebe [Aechmophorus clarkii]) to 0.09 (Horned Grebe [Podiceps auritus], Red-necked Grebe [Podiceps grisegena], and Eared Grebe [Podiceps nigricollis]).
We estimated that phalaropes fly half as much during the night as they do during the day (R. Carle, Oikonos Ecosystem Knowledge, written commun., 2024). We derived DFA values for Red-necked Phalarope (Phalaropus lobatus) and Red Phalarope (Phalaropus fulicarius) from at-sea survey data (Drew and others, 2005; Adams and others, 2016; Takekawa and others, 2017) and halved that value to generate their respective NFA values. The FA24 was estimated for Red-necked Phalaropes by van Bemmelen and others (2023). Considering FA_N&D and FA24, FA values for Red-necked and Red Phalaropes were 0.50 and 0.52, respectively.
Jaegers migrate through the POCS from breeding areas in the boreal and arctic north, with the majority of individuals overwintering areas south of the POCS (D. Pereksta, written commun., Bureau of Ocean Energy Management, 2025). South Polar Skuas (Stercorarius maccormicki) breed in the southern hemisphere and reach the POCS in relatively small numbers during their overwintering period (Furness and others, 2020). We generated DFA values for these birds from at-sea survey data (Drew and others, 2005; Adams and others, 2016; Takekawa and others, 2017). We estimated an NFA value of 0.05. There are accounts of jaegers and skuas observed flying infrequently at night. We used the median of spring and fall migration FA values for South Polar Skuas and Long-tailed Jaegers (Stercorarius longicaudus; Bonnet-Lebrun and others, 2021) to generate FA24. Considering FA_N&D and FA24, FA values of jaegers and skuas ranged from 0.35 (South Polar Skua) to 0.43 (Long-tailed Jaeger).
We derived DFA for alcids from at-sea survey data (Drew and others, 2005; Adams and others, 2016; Takekawa and others, 2017), and we derived NFA values from tracking studies of similar species. Most historical at-sea surveys reported Xantus’s Murrelet (Synthliborampus hypoleucus), which is now recognized as two separate species: Scripps’s Murrelet (Synthliboramphus scrippsi) and Guadalupe Murrelet (Birt and others, 2012; Chesser and others, 2012). Both species are very similar in appearance to Craveri’s Murrelet (Snythliboramphus craveri) and difficult to identify during surveys; therefore, we use DFA values from survey records for Xantus’s Murrelet, Scripps’s, Guadalupe, and Craveri’s Murrelet combined. The resulting FA values for alcids ranged from 0.04 (Common Murre [Uria aalge] and Rhinoceros Auklet [Cerorhinca monocerata]) to 0.17 (Ancient Murrelet [Synthliboramphus antiquus]).
For gulls, we found published FA24 values from tracking studies for Black-legged Kittiwakes (Rissa tridactyla), Western Gull (Larus occidentalis), and Herring Gull (Larus argentatus) and from these, we derived FA values of 0.31, 0.11, and 0.15, respectively. For all other gull species in the POCS, we used the median of values from the published FA24 values of similar gull species (Black-legged Kittiwakes, Western Gull, European Herring Gull, and two other species not found in the POCS) for a final FA value of 0.27.
For tern species, available FA values were obtained from at-sea survey data (Drew and others, 2005; Adams and others, 2016; Takekawa and others, 2017) and a tracking study of Caspian Terns (Hydroprogne caspia; Rueda-Uribe and others, 2022). The survey-derived DFA values are biased upwards because the ratio of terns resting on the water to terns flying does not take into account birds roosting on land, which is common behavior throughout the year for all tern species in the POCS. We did not find any relevant NFA estimates for tern species; therefore, we used the FA24 value of 0.38 published for Caspian Terns in Rueda-Uribe and others (2022) as the final FA value for all tern species.
For Red-billed Tropicbird, we used at-sea survey observations and tracking studies from a similar species (Red-tailed Tropicbird [P. rubricauda]; Spear and Ainley, 2005; Adams and others, 2020; Bonnet-Lebrun and others, 2021) to generate an FA of 0.32. For loons, we assumed an NFA of 0.001 based on species accounts that reported they do not fly at night. We did not find any data on NFA during migration periods, however, so this estimate of 0.001 may be low. The DFA for loons was derived from at-sea survey data (Drew and others, 2005; Adams and others, 2016; Takekawa and others, 2017). The resulting FA ranged from 0.06 (Common Loon [Gavia immer]) to 0.20 (Pacific Loon [Gavia pacifica]).
For the three albatross species in the POCS, we used tracking studies and at-sea survey data to determine FA. Conners and others (2015) provided tracking-based NFA and DFA values for Laysan Albatross (Phoebastria immutabilis) and Black-footed Albatross (Phoebastria nigripes), and Adams and others (2020) provided tracking-based values for Laysan Albatross. At-sea survey data also provided DFA values for both species (Drew and others, 2005; Adams and others, 2016; Takekawa and others, 2017). The data from Laysan and Black-footed Albatross were used for Short-tailed Albatross (Phoebastria albatrus) resulting in an FA value of 0.67 for all three species.
We provided the literature values used to determine FA for storm-petrels as an example of how we incorporated data from a wide range of data sources (see the “Methods” section). The resulting FA values ranged from 0.52 for Townsend’s Storm-Petrel (Hydrobates socorroensis) to 0.62 for Wilson’s Storm-Petrel (Oceanites oceanicus), Fork-tailed Storm-Petrel (Hydrobates furcatus), and Leach’s Storm-Petrel. Pacific Northern Fulmar (Fulmarus glacialis rodgersii) DFA data were available from at-sea surveys (Drew and others, 2005); however, we did not find NFA data for this species. To determine NFA, we used the ratio of NFA to DFA for Pink-Footed Shearwater (Carle and others, 2019), which has similar FA to the Pacific Northern Fulmar; from this ratio, we estimated an FA value of 0.41.
Most of the gadfly petrel species (Pterodroma spp.) in the Vulnerability Index are present in the POCS during their nonbreeding seasons. For these species, nonbreeding season FA values from Bonnet-Lebrun and others (2021) were used to determine FA values of 0.36 for Mottled Petrel (Pterodroma inexpectata) and Cook’s Petrel (Pterodroma cookii), and an FA value of 0.40 for Murphy’s Petrel (Pterodroma ultima). Conversely, Hawaiian Petrel (Pterodroma sandwichensis) disperses to the western equatorial Pacific after breeding, and individuals are primarily observed in the POCS during breeding season (approximately April–October) foraging trips. Therefore, we used breeding season FA studies of Murphy’s Petrel (Clay and others, 2017) and Bermuda Petrel (Pterodroma cahow; Raine and others, 2021) to estimate Hawaiian Petrel FA in the POCS. These studies provided the percentage of time flying during breeding season foraging trips (incubation period [Clay and others, 2017] or chick rearing [Raine and others, 2021]). We used our knowledge of Hawaiian Petrel nesting behavior to estimate the complementary portion of time a bird was at its nest (as opposed to on foraging trips) to generate NFA and DFA value estimates. These values were used to determine an FA value of 0.61 for Hawaiian Petrel.
Diurnal Flight Activity values for all shearwaters were derived from survey data (Drew and others, 2005; Adams and others, 2016; Takekawa and others, 2017). Migratory and wintering FA24 values exist for many shearwater species in Bonnet-Lebrun and others (2021); therefore, we used the wintering values from this study as FA24 for each species studied (and similar species where relevant). The NFA and DFA values from tracking data were available for Pink-footed Shearwaters, Manx Shearwater (Puffinus puffinus) and Wedge-tailed Shearwater (A. pacifica). Wedge-tailed Shearwaters are not found in the POCS but have similar flight styles to the POCS shearwater species, except for Sooty Shearwater (A. grisea) and Short-tailed Shearwater (Puffinus tenuirostris), which spend less time flying. We estimated NFA for Sooty Shearwater and Short-tailed Shearwater by calculating the ratio of NFA to DFA for the other POCS shearwater species (NFA was 50 percent of DFA) and the DFA derived from at-sea survey data for these two species. We incorporated these published and calculated FA_N&D and FA24 values for each shearwater species for final FA values that ranged from 0.20 for Sooty Shearwater to 0.47 for Pink-footed Shearwater.
We used tracking studies of Red-footed Booby, Masked Booby, and Brown Booby during their breeding season and at-sea survey data of Cocos Booby (Sula brewsteri) to generate NFA and DFA for all five booby species (Drew and others, 2005; Weimerskirch and others, 2005; Adams and others, 2016, 2020). The resulting FA values ranged from 0.23 for Brown Booby to 0.42 for Red-footed Booby.
For cormorants, we assumed NFA was 0.001 based on species accounts and personal observation that they spend time roosting rather than flying at night. We did not use DFA values from at-sea survey data because a substantial proportion of cormorants are roosting on land during the day, resulting in the proportion of flying to resting birds observed at sea to be skewed high. From the DFA and FA24 values we found for Double-crested Cormorant and three cormorant species not found in the POCS, we estimated FA values of 0.03 for Double-crested Cormorant and 0.02 for Brandt’s Cormorant (Phalacrocorax penicillatus) and Pelagic Cormorant (Phalacrocorax pelagicus).
For pelicans, we also assumed NFA is 0.001 based on species accounts. Their DFA was derived from at-sea survey data and one telemetry study of Brown Pelicans (Pelicanus occidentalis; Croll and others, 1986; Drew and others, 2005; Adams and others, 2016; Takekawa and others, 2017), resulting in an FA of 0.27 for Brown Pelicans and American White Pelicans (Pelecanus erythrorhynchos).
Time Spent in Rotor Swept Zone (RSZt)
To generate estimations of RSZt for marine birds in the POCS, we used flight height studies that quantified the amount of time species spent between 20 and 200 m above the ocean surface (rotor swept zone height). Some studies set the lower limit of the rotor swept zone at 30 m instead of 20 m. We included these studies; however, they likely underestimated RSZt per our definition. For some species with limited flight height estimation, RSZt relied on broad estimations. We used these values because they are the best available information, and we acknowledge flight height data could be increased with future research. Most studies of RSZt were conducted in the North Sea and western Atlantic Oceans. Adams and others (2020) provided data for several POCS species from studies of breeding birds in Hawai‘i. In this section, we present the variations in RSZt data inputs and the resulting RSZt values among species groups.
We could not find any flight height data for Brant. Robinson Willmott and others (2013) estimated that Brant spent 18–42 percent of their flight time in the rotor swept zone; from this percentage, we estimated an RSZt value of 0.31 (median value of range). Similarly, we could not find any flight height data for any of the sea duck and merganser species in the POCS. Based on data from Common Eider (Somateria mollissima) flight heights around OWEI in the North Sea, we estimated 0.27 RSZt for the duck and merganser species in the POCS. For scoters, we used data from RSZt studies of Common Scoter (Melanitta nigra) in the North Sea for a RSZt estimate of 0.03 for the three scoter species present in the POCS.
We used flight height studies on grebe species near OWEI in the North Sea and western Atlantic Ocean to generate an RSZt estimate of 0.03 for the five grebe species present in the POCS. We could not find any published RSZt values for phalaropes; however, Robinson Willmott and others (2013) estimated 9–75-percent-RSZt. From this percentage range, we estimated both phalarope species in the POCS to have an estimated RSZt of 0.42 (median value of range). We used South Polar Skua and Great Skua (S. skua) flight heights near OWEI in the North Sea and western Atlantic Ocean to generate an RSZt estimation of 0.04 for the skua and jaeger species in the POCS.
For all alcid species except Common Murre, for which RSZt estimates were available, we used studies on alcid RSZt near OWEI in the North Sea and western Atlantic Ocean and applied those estimates to similar alcid species in the POCS. The resulting RSZt values ranged from 0.001 for Common Murre, Pigeon Guillemot (Cepphus columba), and the POCS puffin species, to 0.02 for the murrelets and small alcids.
Numerous studies have reported Black-legged Kittiwake flight heights near OWEI in the North Sea and western Atlantic Ocean. We compiled the values from these studies, resulting in an estimated RSZt of 0.16 for Black-legged Kittiwake. For other gull species, we grouped RSZt estimations from the literature by species size into small gulls, medium gulls, and large gulls. We applied these groupings, and the resulting RSZt estimates, to similar species in the POCS: 0.07 for small gulls (Sabine’s Gull [Xema sabini] and Bonaparte’s Gull [Chroicocephalus philadelphia]), 0.27 for medium gulls (Heermannn’s Gull [L. heermanni], Short-billed Gull [Larus brachyrhynchus], Ring-billed Gull [Larus delawarensis], California Gull [Larus californicus], and Iceland Gull [Larus glaucoides), and 0.35 for large gulls (Western Gull and Glaucous-winged Gull [Larus glaucescens]). Herring Gull flight heights were well studied, and we used this gull as a similar species for the large gulls in the POCS; their estimated RSZt was 0.35.
Studies of RSZt exist for Common Tern (Sterna hirundo) and Arctic Tern (Sterna paradisaea). For all other tern species in the POCS, we applied these groupings and the resulting RSZt estimates: large terns, crested terns, and terns. The final category of terns included all tern species that did not fall within either of the other more specific categories. The resulting RSZt values were 0.10 for Common Tern, 0.01 for Arctic Tern, 0.10 for crested terns (Royal Tern [Thalasseus maximus] and Elegant Tern [Thalasseus elegans]), 0.08 for large terns (Caspian Tern), and 0.06 for terns (Least Tern [Sternula antillarum], Gull-billed Tern [Gelochelidon nilotica], Black Tern [Chlidonias niger], and Forster’s Tern [Sterna forsteri]). We could not find any data on Black Skimmer (Rynchops niger) flight heights for an RSZt value; therefore, we selected an RSZt value 0.08 ascribed to large tern.
We did not find any flight height information for Red-billed Tropicbirds. We used the Red-tailed Tropicbird RSZt value of 0.71 from Adams and others’ (2020) study of breeding birds in Hawai‘i for Red-billed Tropicbird within the POCS.
Flight heights of Red-throated Loon (Gavia stellata) near OWEI have been well studied in the North Sea and western Atlantic Ocean. We used the median of the values from these studies (0.06) as the RSZt value for all four loon species in the POCS. Adams and others (2020) estimated the RSZt of Laysan Albatross to be 0.03, given the similar size and flight styles, so we used this value for Black-footed and Short-tailed Albatrosses in the POCS.
Bradbury and others (2014) estimated RSZt values of 0.00 and 0.02 for Wilson’s and Leach’s Storm-Petrel, respectively. Deakin and others (2022) estimated an RSZt value range of 0.000–0.025 for European Storm-Petrel (Hydrobates pelagicus). We used the 0.02 value estimated for Leach’s Storm-Petrel as the RSZt for that species. For all other POCS storm-petrel species, we used the median of all values for an estimated RSZt of 0.016; the use of this calculation included Wilson’s Storm-Petrel because, although Bradbury and others (2014) generated an estimate for that species, it was an RSZt of 0.00 and we determined not to include zeros in our database, given the level of uncertainty in the estimations.
Flight heights of Northern Fulmars near OWEI have been studied in the North Sea and western Atlantic Ocean. We used the median value of 0.002 from these studies as the RSZt value for Pacific Northern Fulmar in the POCS. No RSZt data exist for gadfly petrel species; therefore, we applied the RSZt of 0.002 for Pacific Northern Fulmar to the gadfly petrels present in the POCS. Flight height data from Manx Shearwaters and other shearwaters outside of the POCS were used to generate the RSZt value of 0.0002 for shearwater species present in the POCS.
Adams and others (2020) estimated RSZt values of 0.034 and 0.027 for Red-Footed and Coco’s Boobies off Hawai‘i, respectively. However, these data are from chick-rearing birds and may not be representative of the flight heights of boobies throughout the year within the POCS. Therefore, we also applied data from Northern Gannet (Morus bassanus) RSZt studies in the North Sea and the western Atlantic Ocean to RSZt estimates for the POCS booby species. The RSZt values were 0.20 for Red-footed and Cocos Boobies and 0.13 for the other three booby species in the POCS.
We used studies on cormorant and shag species flight heights near OWEI in the North Sea and western Atlantic Ocean to generate RSZt estimations of 0.08 for the three cormorant species in the POCS. We could not find any flight height or RSZt estimations for either of the two pelican species in the POCS, so we used an RSZt value of 0.31 (median of the range of estimates) for Brown Pelican reported in Robinson Willmott and others (2013) and used in Adams and others (2017).
Macro-Avoidance
Existing data on MA came from visual observations and radar studies at offshore wind developments in the North Sea. Therefore, for many species in the POCS, we used data from similar species to assign MA metric values. Below, we present the variations in MA data inputs and the resulting MA values among species groups. Some value ranges are large, highlighting the uncertainty present in MA estimations.
We used the one MA estimate for Brant (0.68) from Krijgsveld and others (2011). Using MA estimates for sea ducks from Cook and others (2012) and Krijgsveld and others (2011), we generated an MA of 0.73 for Red-breasted Merganser, Harlequin Duck, and Long-Tailed Duck in the POCS. Bradbury and others (2014) estimated an MA of 0.90 for Common Scoter, and we used this value for all three scoter species in the POCS.
Using MA estimates for grebes from Cook and others (2012) and Krijgsveld and others (2011), we generated an MA of 0.39 for all five grebe species in the POCS. Because we are not aware of any published data on phalarope MA specifically, we used the estimated MA of 0.27 for shorebirds from Krijgsveld and others (2011) for the two phalarope species in the POCS. Based on MA estimates for jaegers and Great and South Polar Skuas from Cook and others (2012) and Krijgsveld and others (2011), we generated an MA of 0.14 for the South Polar Skua and the three jaeger species in the POCS.
For alcids, several studies reported Common Murre MA and a few studies have reported, more generally, on alcid MA. From these studies, we estimated an MA value of 0.69 for Common Murre and 0.68 for all other alcid species in the POCS.
Macro-Avoidance has been well studied in Black-legged Kittiwakes, with a very wide range of estimated values. Vanermen and others (2017) estimated kittiwake MA to be 0.75, whereas Cook and others (2014) estimated an MA rate of 0 for kittiwakes. We took the median of all published estimates to assign an MA of 0.42 for Black-legged Kittiwakes. We used the same gull size groups described in the “Time Spent in Rotor Swept Zone” section to assign MA estimates among size groups in the POCS. From these findings, we estimated MA values of 0.28 for small gulls (Sabine’s and Bonaparte’s Gulls), 0.30 for medium to large gulls (Heermann’s, Short-billed, Ring-billed, California, and Iceland Gulls), and 0.30 for large gulls (Western, European Herring, and Glaucous-winged Gulls).
We found MA estimates for Sandwich Terns (Thalasseus sandvicensis) and for terns generally. We used the median of these reported values to generate an MA of 0.49 for all tern species in the POCS.
Robinson Willmott and others (2013) assigned Red-billed Tropicbirds an MA range of 18–29 percent. Using the midpoint of 18–29 percent for this estimation, we assigned an MA value of 0.24 for Red-billed Tropicbirds.
Macro-Avoidance in loons has been well studied in the North Sea. We took the median of all published MA estimations for loons to assign an MA value of 0.81 for the loon species present in the POCS.
We used the MA estimate of 0.28 from Krijgsveld and others (2011) for Pacific Northern Fulmar. Cook and others (2012) estimated the MA of tubenoses in general (including albatrosses, petrels, shearwaters, and storm-petrels) to be 0.50. Therefore, we estimated an MA value of 0.39 (the median of these two estimates) for all tubenoses in the POCS except Pacific Northern Fulmar.
We used Northern Gannet MA estimates for the five booby species in the POCS, resulting in an MA estimate of 0.87. Using MA estimates for cormorants and shags from Cook and others (2012) and Krijgsveld and others (2011), we generated an MA of 0.21 for the three cormorant species in the POCS.
No MA data were available for pelicans; therefore, we used MA estimates from Northern Gannet MA, resulting in an MA of 0.87. Northern Gannet has the most similar flight style and foraging patterns to pelicans of any species for which MA has been quantified.
Displacement Vulnerability
Final DV and associated metric values for each species are listed in table 7. Sea ducks, boobies, and pelicans had the greatest DV (table 7; fig. 4). In this section, we describe how HS metric values were estimated for each species. Macro-Avoidance values are described in the “Macro-Avoidance” section.
Table 7.
Displacement Vulnerability (DV) for all 89 U.S. Pacific Outer Continental Shelf species along with the metric values used to generate DV: Macro-Avoidance (MA) and Habitat Specificity (HS; eq. 4).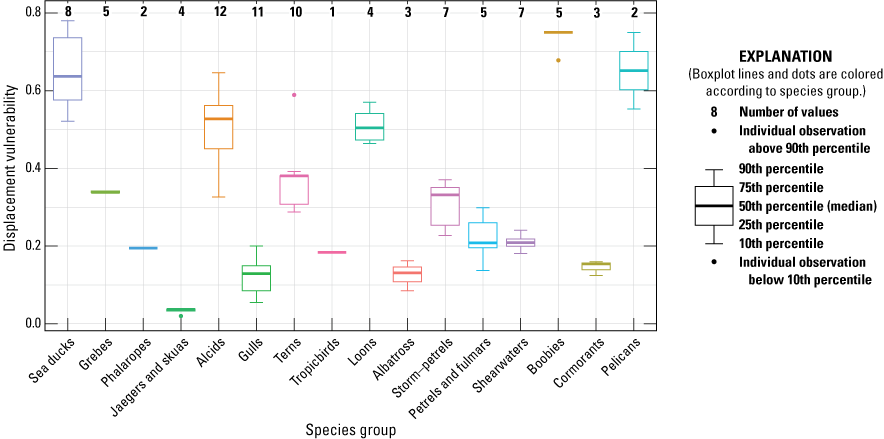
Final Displacement Vulnerability values listed by species group for the 89 species present in the U.S. Pacific Outer Continental Shelf Region. The number of species in each species group is shown along the top, and species present in each species group are listed in table 1.
Habitat Specificity
Habitat Specificity is the average of SS and FS. We calculated SS from the species distributions in Leirness and others (2021). Distribution models were not generated by Leirness and others (2021) due to insufficient data for 33 infrequently encountered species. For these species, we used distribution values for similar species and eBird data (eBird, 2021) to estimate SS. We generated FS values from the Birds of the World accounts for each species (Billerman and others, 2022). From the species accounts, we extracted all relevant information from the “Data and Foraging” sections in Birds of the World to enumerate FS, as outlined in table 5. Habitat Specificity for each species was the mean of their SS and FS values (table 5).
Quantifying Uncertainty
Final CV and DV uncertainty values for each species are listed in table 8. Species in the top 15 percent of CV or DV were categorized as having relatively high uncertainty with regard to that vulnerability type (in bold in table 8). The species with high CV uncertainty are Red Phalarope, Red-necked Phalarope, Heermann’s Gull (Larus heermanni), Short-billed Gull, Ring-billed Gull, Herring Gull, California Gull, Iceland Gull, Black Skimmer, Forster’s Tern, Red-billed Tropicbird, Fork-tailed Storm-Petrel, Leach’s Storm-Petrel, Townsend’s Storm-Petrel, Ashy Storm-Petrel (Hydrobates Oceanodroma homochroa), Black Storm-Petrel (Hydrobates melania), and Least Storm-Petrel (Hydrobates microsoma). The species with high DV uncertainty are Harlequin Duck, Long-tailed Duck, Common Merganser, Red-breasted Merganser, Horned Grebe, Red-necked Grebe, Eared Grebe, Short-billed Gull, Ring-billed Gull, Short-tailed Albatross, Wilson’s Storm-Petrel, Townsend’s Storm-Petrel, Least Storm-Petrel, Mottled Petrel, Hawaiian Petrel, and Manx Shearwater.
Table 8.
Uncertainty values associated with Collision Vulnerability (CV) and Displacement Vulnerability (DV) values for the 89 species in the U.S. Pacific Outer Continental Shelf Region.Discussion
In our marine bird Vulnerability Index Version 2, we made three major updates from Version 1 in our quantitative assessment of marine bird vulnerability to potential OWEI within the POCS. First, we incorporated new, relevant literature published about marine bird behavior, ecology, and interactions with OWEI. Second, we added eight new marine bird species based on their recently observed presence (5 booby species) and more refined identification at sea (Red-billed Tropicbird, Townsend’s Storm-Petrel and Synthlyboramphus murrelets) in the POCS. Third, we revised the Index metrics and equations based on our improved understanding of application and utility. These changes included updating the HS (formerly HF) metric. Also, motivated by the arguments of Shavykin and Karnatov (2022), we replaced the ordinal metric rankings used in Version 1 with continuous numbers as metric values and replaced the additive framework with a multiplicative one in the CV and DV equations. These improvements make Version 2 of the Vulnerability Index more current, transparent, and applicable.
We quantified the relative uncertainty associated with CV and DV values for all species. In our revision of Version 1 methods, we chose not to calculate uncertainty as a range of possible Vulnerabilities around the final Vulnerability value, but instead made uncertainty a singular value. The purpose of the uncertainty values is to highlight species for which more studies on OWEI impacts are warranted (table 8). Some of the main drivers of high uncertainty were wide ranges of input values into metrics (for example, we had one source of phalarope RSZt which estimated 9–75 percent RSZt; Robinson Willmott and others, 2013). Conversely, the nature of the HS input data did not allow us to quantify species uncertainty based on spatial use. Other drivers of high uncertainty were species for which, due to lack of available data, we relied on similar species. Thus, limitations in the ranges of input values and values from similar species led to high uncertainty.
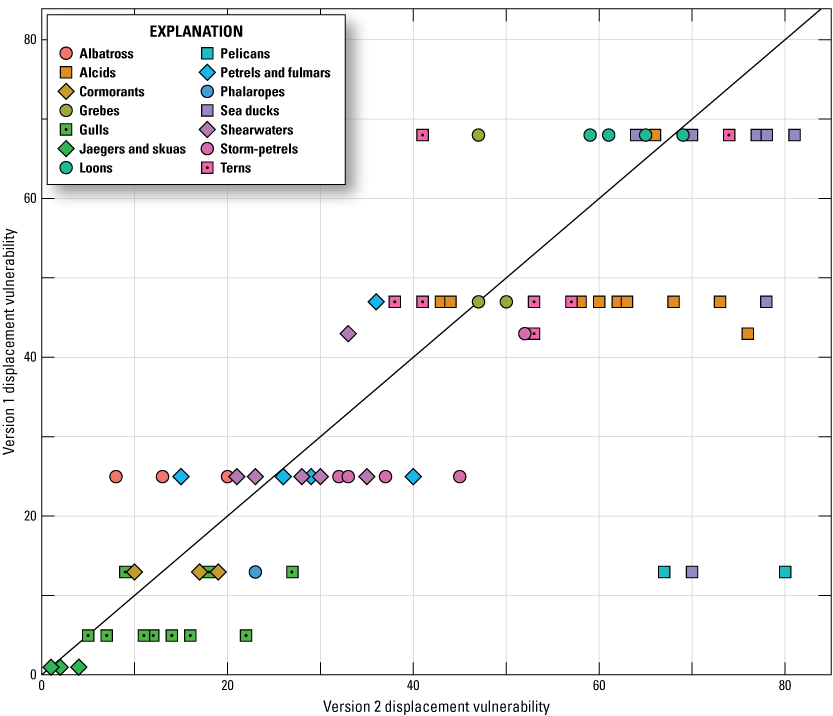
We compared the results of Vulnerability Indexes Version 1 with Version 2 (figs. 5, 6). Because the scale of relative Vulnerability values changed with the update, we did not compare Version 1 and Version 2 Vulnerability Index values directly. Instead, we compared the relative rank of Vulnerability values between the two versions; we did this for the 81 species that were included in both versions (excluding the 8 species added in Version 2). We found that, although new data were added and calculations were updated, the overall trends in ranked vulnerabilities were consistent as depicted by the relative linearity on figures 5 and 6. Alcids, loons, phalaropes, and storm-petrels ranked comparatively higher for CV in Version 2 than in Version 1, and cormorants, jaegers and skuas, and sea ducks ranked comparatively lower for CV in Version 2 than in Version 1 (fig. 5). Alcids, gulls, pelicans, and sea ducks had a greater relative ranking for DV in Version 2, and albatrosses, loons, and terns had a lower relative ranking for DV in Version 2 (fig. 6).
The shifts in vulnerability rankings between Version 1 and Version 2 resulted from the addition of new data and revised index calculations. With these updates, we provide a current Vulnerability Index for marine birds in the POCS to potential OWEI with transparent calculations and improved applicability. This updated Vulnerability Index can be used by resource managers and others to better understand and address potential interactions between OWEI and marine bird species present in the POCS.
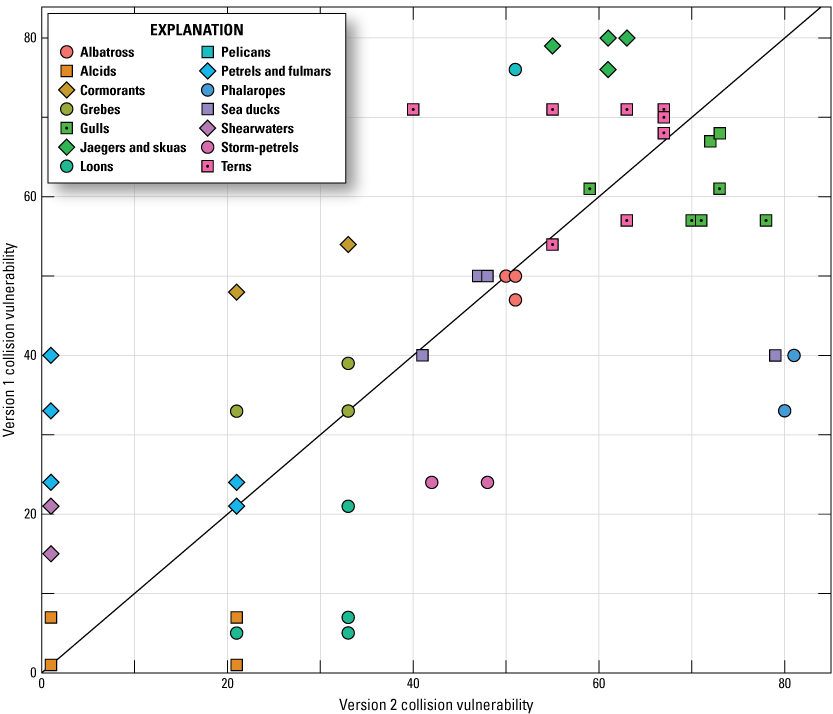
Ranked Collision Vulnerability (CV) values for Version 1 (Adams and others, 2016; Kelsey and others, 2018) versus ranked CV values for Version 2 for the 81 species that were included in Version 1 of the Vulnerability Index (excluding the 8 species added in Version 2). The gray one-to-one line indicates the location of points if CV ranks did not change between Versions 1 and 2.
Ranked Displacement Vulnerability (DV) values for Version 1 (Adams and others, 2016; Kelsey and others, 2018) versus ranked DV values for Version 2 for the 81 species that were included in Version 1 of the Vulnerability Index (excluding the 8 species added in Version 2). The gray one-to-one line indicates the location of points if DV ranks did not change between Versions 1 and 2.
Conclusions
The Vulnerability Index Version 2 provides a current and transparent quantification of Collision Vulnerability (CV) and Displacement Vulnerability (DV) to potential offshore wind energy infrastructure (OWEI) for the 89 marine bird species in the U.S. Pacific Outer Continental Shelf (POCS). We quantified uncertainty to highlight species for which more studies on OWEI impacts may be warranted. Attention could be given to species with high vulnerability scores as well as high uncertainty associated with those scores. Red Phalarope, Red-necked Phalarope, and Red-billed Tropicbird have the highest relative Collision Vulnerability scores and also were in the top 15 percent for CV uncertainty. Heermann’s Gull, Short-billed Gull, Ring-billed Gull, California Gull, Herring Gull, Iceland Gull, Black Skimmer, and Forster’s Tern have a moderate CV and were also within the top 15 percent for CV uncertainty. Harlequin Duck, Long-tailed Duck, Common Merganser, Red-breasted Merganser, Horned Grebe, Red-necked Grebe, and Eared Grebe had some of the highest relative DV scores and also were within the top 15 percent for DV uncertainty. Additional research on these species could decrease the uncertainty associated with their vulnerability scores and better inform their relative vulnerability. The updated CV and DV index values and their associated uncertainties presented in this report can inform research, evaluation, and planning for offshore wind energy development in this region.
References Cited
ABSG Consulting, Inc., 2021, Floating offshore wind turbine development assessment—Final report and technical summary: U.S. Department of the Interior, Bureau of Ocean Energy Management, Office of Renewable Energy Programs, report BOEM 2021–030, prepared by ABSG Consulting, Inc., Arlington, Va., 295 p. [Available at https://www.boem.gov/sites/default/files/documents/renewable-energy/studies/Study-Number-Deliverable-4-Final-Report-Technical-Summary.pdf.]
Adams, J., Felis, J.J., Mason, J.W., and Takekawa, J.Y., 2014, Pacific continental shelf environmental assessment (PaCSEA)—Aerial seabird and marine mammal surveys off northern California, Oregon, and Washington, 2011–2012: Camarillo, Calif., U.S. Department of the Interior, Bureau of Ocean Energy Management, Pacific OCS Region, OCS Study BOEM, 2014-003, 257 p. [Available at https://www.boem.gov/sites/default/files/environmental-stewardship/Environmental-Studies/Pacific-Region/Studies/2014-003_Final-Aerial-Seabird-Marine-M ammal-Survey-Northern-California.pdf.]
Adams, J., Felis, J.J., Mason, J.W., and Takekawa, J.Y., 2016, Pacific continental shelf environmental assessment (PaCSEA)—Aerial seabird and marine mammal surveys off northern California, Oregon, and Washington, 2011–2012, GIS Resource Database: U.S. Geological Survey data release, accessed October 10, 2023, at https://doi.org/10.5066/F7668B7V.
Adams, J., Kelsey, E.C., Felis, J.J., and Pereksta, D.M., 2017, Collision and displacement vulnerability among marine birds of the California current system associated with offshore wind energy infrastructure (ver. 1.1, July 2017): U.S. Geological Survey Open-File Report 2016–1154, 116 p. [Available at https://doi.org/10.3133/ofr20161154.]
Adams, J., Felis, J.J., and Czapanskiy, M.F., 2020, Habitat affinities and at-sea ranging behaviors among main Hawaiian Island seabirds—Breeding seabird telemetry, 2013–2016: Camarillo, Calif., U.S. Department of the Interior, Bureau of Ocean Energy Management, Pacific OCS Region, OCS Study BOEM 2020-006, 111 p.
Ainley, D.G., Porzig, E., Zajanc, D., and Spear, L.B., 2015, Seabird flight behavior and height in response to altered wind strength and direction: Marine Ornithology, v. 43, no. 1, p. 25–36. [Available at https://doi.org/10.5038/2074-1235.43.1.1098.]
Billerman, S.M., Keeney, B.K., Rodewald, P.G., and Schulenberg, T.S., eds., 2022, Birds of the World database: Ithaca, N.Y., Cornell Laboratory of Ornithology. [Available at https://birdsoftheworld.org/bow/home.]
Birt, T.P., Carter, H.R., Whitworth, D.L., McDonald, A., Newman, S.H., Gress, F., Palacios, E., Koepke, J.S., and Friesen, V.L., 2012, Rangewide population genetic structure of Xantus’s murrelet (Synthliboramphus hypoleucus): The Auk, v. 129, no. 1, p. 44–55. [Available at https://doi.org/10.1525/auk.2011.11011.]
Bonnet-Lebrun, A.-S., Dias, M.P., Phillips, R.A., Granadeiro, J.P., Brooke, M.L., Chastel, O., Clay, T.A., Fayet, A.L., Gilg, O., González-Solís, J., Guilford, T., Hanssen, S.A., Hedd, A., Jaeger, A., Krietsch, J., Lang, J., Le Corre, M., Militão, T., Moe, B., Montevecchi, W.A., Peter, H.-U., Pinet, P., Rayner, M.J., Reid, T., Reyes-González, J.M., Ryan, P.G., Sagar, P.M., Schmidt, N.M., Thompson, D.R., van Bemmelen, R., Watanuki, Y., Weimerskirch, H., Yamamoto, T., and Catry, P., 2021, Seabird migration strategies—Flight budgets, diel activity patterns, and lunar influence: Frontiers in Marine Science, v. 8., 15 p. [Available at https://doi.org/10.3389/fmars.2021.683071.]
Bradbury, G., Trinder, M., Furness, B., Banks, A.N., Caldow, R.W.G., and Hume, D., 2014, Mapping seabird sensitivity to offshore wind farms: PLoS One, v. 9, no. 9. [Available at https://doi.org/10.1371/journal.pone.0170863.]
Briggs, K.T., Varoujean, D.H., Williams, W.W., Ford, R.G., Bonnell, M.L., and Casey, J.L., 1992, Seabirds of the Oregon and Washington OCS, 1989–1990, chap. 3 of Brueggeman, J.J., ed., Oregon and Washington marine mammal and seabird surveys—Final report: Los Angeles, Calif., OCS study, MMS 91-0093, U.S. Department of the Interior, Minerals Management Service, Pacific OCS Region, 164 p.
Carle, R.D., Felis, J.J., Vega, R., Beck, J., Adams, J., López, V., Hodum, P.J., González, A., Colodro, V., and Varela, T., 2019, Overlap of Pink-footed Shearwaters and central Chilean purse-seine fisheries—Implications for bycatch risk: The Condor: Ornithological Applications, v. 121, no. 3, 13 p. [Available at https://doi.org/10.1093/condor/duz026.]
Carlton, J.L., Jossart, J.A., Pendleton, F., Sumait, N., Miller, J., Thurston-Keller, J., Reeb, D., Gilbane, L., Pereksta, D., Schroeder, D., and Morris, J.A., Jr., 2024, A wind energy area siting analysis for the Oregon call areas: Camarillo, Calif., U.S. Department of the Interior, Bureau of Ocean Energy Management, Report No. BOEM 2024-15, 237 p., accessed January 31, 2025, at https://tethys.pnnl.gov/publications/wind-energy-area-siting-analysis-oregon-call-areas.
Chesser, R.T., Banks, R.C., Barker, F.K., Cicero, C., Dunn, J.L., Kratter, A.W., Lovette, I.J., Rasmussen, P.C., Remsen, J.V., Jr., Rising, J.D., Stotz, D.F., and Winker, K., 2012, Fifty-third supplement to the American Ornithologists’ Union check-list of North American birds: The Auk, v. 129, no. 3, p. 573–588. [Available at https://doi.org/10.1525/auk.2012.129.3.573.]
Chesser, R.T., Billerman, S.M., Burns, K.J., Cicero, C., Dunn, J.L., Hernández-Baños, B.E., Jiménez, R.A., Johnson, O., Kratter, A.W., Mason, N.A., Rasmussen, P.C., and Remsen, J.V., Jr., 2024, Check-list of North American Birds (online): American Ornithological Society database. [Available at https://checklist.americanornithology.org/taxa/.]
Clay, T.A., Phillips, R.A., Manica, A., Jackson, H.A., and Brooke, M. de L., 2017, Escaping the oligotrophic gyre? The year-round movements, foraging behavior and habitat preferences of Murphy’s petrels: Marine Ecology Progress Series, v. 579, p. 139–155. [Available at https://doi.org/10.3354/meps12244.]
Clements, J.F., Rasmussen, P.C., Schulenberg, T.S., Iliff, M.J., Fredericks, T.A., Gerbracht, J.A., Lepage, D., Spencer, A., Billerman, S.M., Sullivan, B.L., Smith, M., and Wood, C.L., 2023, The eBird/Clements checklist of Birds of the World, accessed March 13, 2023, at https://www.birds.cornell.edu/clementschecklist/download/.
Conners, M.G., Hazen, E.L., Costa, D.P., and Shaffer, S.A., 2015, Shadowed by scale—Subtle behavioral niche partitioning in two sympatric, tropical breeding albatross species: Movement Ecology, v. 3, no. 28, 20 p. [Available at https://doi.org/10.1186/s40462-015-0060-7.]
Cook, A.S.C.P., Johnston, A., Wright, L.J., and Burton, N.H.K., 2012, A review of flight heights and avoidance rates of birds in relation to offshore wind farms: Thetford, Norfolk, England, British Trust for Ornithology, BTO Research Report Number 618, 59 p. [Available at https://www.bto.org/our-science/publications/research-reports/strategic-ornithological-support-services-project-soss-02.]
Cook, A.S.C.P., Humphreys, E.M., Masden, E.A., and Burton, N.H.K., 2014, The avoidance rates of collision between birds and offshore turbines: Scottish Marine and Freshwater Science, BTO [British Trust for Ornithology] Research Report No. 656, v. 5, no. 16, 247 p. [Available at https://www.gov.scot/publications/scottish-marine-freshwater-science-volume-5-number-16-avoidance-rates/.]
Croll, D.A., Ballance, L.T., Würsig, B.G., and Tyler, W.B., 1986, Movements and daily activity patterns of a Brown Pelican in central California: The Condor, v. 88, no. 2, p. 258–260. [Available at https://doi.org/10.2307/1368929.]
Croll, D.A., Ellis, A.A., Adams, J., Cook, A.S.C.P., Garthe, S., Goodale, M.W., Hall, C.S., Hazen, E., Keitt, B.S., Kelsey, E.C., Leirness, J.B., Lyons, D.E., McKown, M.W., Potiek, A., Searle, K.R., Soudijn, F.H., Rockwood, R.C., Tershy, B.R., Tinker, M., VanderWerf, E.A., Williams, K.A., and Young, L., and Zilliacus, K., 2022, Framework for assessing and mitigating the impacts of offshore wind energy development on marine birds: Biological Conservation, v. 276, 15 p. [Available at https://doi.org/10.1016/j.biocon.2022.109795.]
Croxall, J.P., Butchart, S.H.M., Lascelles, B., Stattersfield, A.J., Sullivan, B., Symes, A., and Taylor, P., 2012, Seabird conservation status, threats and priority actions—A global assessment: Bird Conservation International, v. 22, no. 1, p. 1–34. [Available at https://doi.org/10.1017/S0959270912000020.]
Deakin, Z., Cook, A., Daunt, F., McCluskie, A., Morley, N., Witcutt, E., Wright, L., and Bolton, M., 2022, A review to inform the assessment of the risk of collision and displacement in petrels and shearwaters from offshore wind developments in Scotland: Edinburgh, Scotland, Scottish Government, 138 p. [Available at https://nora.nerc.ac.uk/id/eprint/534031/.]
Desholm, M., 2009, Avian sensitivity to mortality—Prioritising migratory bird species for assessment at proposed wind farms: Journal of Environmental Management, v. 90, no. 8, p. 2672–2679. [Available at https://doi.org/10.1016/j.jenvman.2009.02.005.]
Drew, G.S., Schoen, S.K., Hood, M.D., Arimitsu, M.L., and Piatt, J.F., 2005, North Pacific Pelagic Seabird Database (NPPSD; ver. 4.1, May 2023): U.S. Geological Survey data release, accessed September 21, 2023, at https://doi.org/10.5066/F7WQ01T3.
eBird, 2021, eBird—An online database of bird distribution and abundance: Ithaca, N.Y., Cornell Lab of Ornithology, eBird. [Available at http://www.ebird.org.]
Furness, B., and Wade, H., 2012, Vulnerability of Scottish seabirds to offshore wind turbines: Edinburgh, Scotland, Scottish Government, prepared by MacArthur Green Ltd., Glasgow, Scotland, 40 p. [Available at https://www.gov.scot/publications/vulnerability-scottish-seabirds-offshore-wind/.]
Furness, R.W., Boesman, P.F.D., and Garcia, E., 2020, South Polar Skua (Stercorarius maccormicki), version 1.0, in del Hoyo, J., Elliot, A., Sargatal, J., Christie, D.A., and de Juana, E., eds., Birds of the World: Ithaca, N.Y., Cornell Lab of Ornithology. [Available at https://doi.org/10.2173/bow.sopsku1.01.]
Furness, R.W., Wade, H.M., and Masden, E.A., 2013, Assessing vulnerability of marine bird populations to offshore wind farms: Journal of Environmental Management, v. 119, p. 56–66. [Available at https://doi.org/10.1016/j.jenvman.2013.01.025.]
Garthe, S., and Hüppop, O., 2004, Scaling possible adverse effects of marine wind farms on seabirds—Developing and applying a vulnerability index: Journal of Applied Ecology, v. 41, no. 4, p. 724–734. [Available at https://doi.org/10.1111/j.0021-8901.2004.00918.x.]
Goodale, M.W., and Milman, A., 2016, Cumulative adverse effects of offshore wind energy development on wildlife: Journal of Environmental Planning and Management, v. 59, no. 1, p. 1–21. [Available at https://doi.org/10.1080/09640568.2014.973483.]
Gușatu, L.F., Menegon, S., Depellegrin, D., Zuidema, C., Faaij, A., and Yamu, C., 2021, Spatial and temporal analysis of cumulative environmental effects of offshore wind farms in the North Sea basin: Scientific Reports, v. 11, no. 1, 20 p. [Available at https://doi.org/10.1038/s41598-021-89537-1.]
Howard, J.A., DuVall, A.J., Pereksta, D.M., Mazurkiewicz, D.M., Searcy, A.J., Capitolo, P.J., and Russell, T.M., 2024, Northern breeding range expansion of two Sula species at Sutil Island, California, USA: Western North American Naturalist, v. 84, no. 3, p. 356–365. [Available at https://doi.org/10.3398/064.084.0305.]
Kelsey, E.C., Felis, J.J., Czapanskiy, M., Pereksta, D.M., and Adams, J., 2018, Collision and displacement vulnerability to offshore wind energy infrastructure among marine birds of the Pacific Outer Continental Shelf: Journal of Environmental Management, v. 227, p. 229–247. [Available at https://doi.org/10.1016/j.jenvman.2018.08.051.]
Kelsey, E.C., Felis, J.J., Pereksta, D.M., and Adams, J., 2025, Data for the revised marine bird Collision and Displacement Vulnerability Index for Pacific Outer Continental Shelf offshore wind energy development: U.S. Geological Survey data release, https://doi.org/10.5066/P1OUOM9W.
Kirwan, G.M., Medrano, F., Hernández-Montoya, J., Duarte, A., and González-Solís, J., 2023, Townsend’s Storm-Petrel (Hydrobates socorroensis), version 2.0, in Keeney, B.K., ed., Birds of the World: Ithaca, N.Y., Cornell Lab of Ornithology. [Available at https://doi.org/10.2173/bow.leastp5.02.]
Krijgsveld, K.L., Fijn, R.C., Japink, M., van Horssen, P.W., Heunks, C., Collier, M.P., Poot, M.J.M., Beuker, D., and Dirksen, S., 2011, Effect studies offshore wind farm Egmon aan Zee—Final Report on fluxes, flight altitudes and behaviour of flying birds: NoordzeeWind, 330 p. [Available at https://tethys.pnnl.gov/sites/default/files/publications/Krijgsveldetal2014.pdf.]
Leirness, J.B., Adams, J., Ballance, L.T., Coyne, M., Felis, J.J., Joyce, T., Pereksta, D.M., Winship, A.J., Jeffrey, C.F.G., Ainley, D., Croll, D., Evenson, J., Jahncke, J., McIver, W., Miller, P.I., Pearson, S., Strong, C., Sydeman, W., Waddell, J.E., Zamon, J.E., and Christensen, J., 2021, Modeling at-sea density of marine birds to support renewable energy planning on the Pacific outer continental shelf of the contiguous United States: Camarillo, Calif., U.S. Department of the Interior, Bureau of Ocean Energy Management, OCS Study BOEM 2021-014, 385 p. [Available at https://repository.library.noaa.gov/view/noaa/49073#moretextPAmods.subject_name.]
Lewis, T.L., Ward, D.H., Sedinger, J.S., Reed, A., Derksen, D.V., Carboneras, C., Christie, D.A., and Kirwan, G.M., 2020, Brant (Branta bernicla), version 1.0, in Billerman, S.M., ed., Birds of the World: Ithaca, N.Y., Cornell Lab of Ornithology. [Available at https://doi.org/10.2173/bow.brant.01.]
Mallory, M.L., Hatch, S.A., and Nettleship, D.N., 2020, Northern Fulmar (Fulmarus glacialis), version 1.0, in Billerman, S.M., ed., Birds of the World: Ithaca, N.Y., Cornell Lab of Ornithology, 101 p. [Available at https://doi.org/10.2173/bow.norful.01.]
Mason, J.W., McChesney, G.J., McIver, W.R., Carter, H.R., Takekawa, J.Y., Golightly, R.T., Ackerman, J.T., Orthmeyer, D.L., Perry, W.M., Yee, J.L., Pierson, M.O., and McCrary, M.D., 2007, At-sea distribution and abundance of seabirds off southern California—A 20-year comparison: Cooper Ornithological Society, Studies in Avian Biology, v. 33.
Maxwell, S.M., Hazen, E.L., Bograd, S.J., Halpern, B.S., Breed, G.A., Nickel, B., Teutschel, N.M., Crowder, L.B., Benson, S., Dutton, P.H., Bailey, H., Kappes, M.A., Kuhn, C.E., Weise, M.J., Mate, B., Shaffer, S.A., Hassrick, J.L., Henry, R.W., Irvine, L., McDonald, B.I., Robinson, P.W., Block, B.A., and Costa, D.P., 2013, Cumulative human impacts on marine predators: Nature Communications, v. 4, article 2688, 9 p. [Available at https://doi.org/10.1038/ncomms3688.]
Medrano, F., Militão, T., Gomes, I., Sardà-Serra, M., de la Fuente, M., Dinis, H.A., and González-Solís, J., 2022, Phenological divergence, population connectivity and ecological differentiation in two allochronic seabird populations: Frontiers in Marine Science, v. 9, 14 p. [Available at https://doi.org/10.3389/fmars.2022.975716.]
Medrano, F., Hernández-Montoya, J., Saldanha, S., Bedolla-Guzmán, Y., and González-Solís, J., 2024, Contrasting migratory ecology of two threatened and allochronic storm-petrels breeding in the Mexican Pacific: Endangered Species Research, v. 54, p. 331–339. [Available at https://doi.org/10.3354/esr01344.]
Militão, T., Sanz-Aguilar, A., Rotger, A., and Ramos, R., 2022, Non-breeding distribution and at-sea activity patterns of the smallest European seabird, the European Storm Petrel (Hydrobates pelagicus): IBIS: International Journal of Avian Science, v. 164, no. 4, p. 1160–1179. [Available at https://doi.org/10.1111/ibi.13068.]
Mlodinow, S.G., and Pyle, P., 2023, Guadalupe Murrelet (Synthliboramphus hypoleucus), version 2.0, in Medrano, F., ed., Birds of the World: Ithaca, N.Y., Cornell Lab of Ornithology. [Available at https://doi.org/10.2173/bow.xanmur1.02.]
Orta, J., Jutglar, F., Garcia, E., and Kirwan, G.M., 2020, Red-billed Tropicbird (Phaethon aethereus), version 1.0, in del Hoyo, J., Elliott, A., Sargatal, J., Christie, D.A., and de Juana, E., eds., Birds of the World: Ithaca, N.Y., Cornell Lab of Ornithology. [Available at https://doi.org/10.2173/bow.rebtro.01.]
Phillips, R.A., Fort, J., and Dias, M.P., 2023, Conservation status and overview of threats to seabirds, chap. 2 of Young, L., and VanderWerf, E., eds., Conservation of marine birds: London, Academic Press, p. 33–56. [Available at https://doi.org/10.1016/B978-0-323-88539-3.00015-7.]
Raine, A.F., Gjerdrum, C., Pratte, I., Madeiros, J., Felis, J.J., and Adams, J., 2021, Marine distribution and foraging habitat highlight potential threats at-sea for the endangered Bermuda petrel Pterodroma cahow: Endangered Species Research, v. 45, p. 337–356. [Available at https://doi.org/10.3354/esr01139.]
Robinson Willmott, J.C., Forcey, G., and Kent, A., 2013, The relative vulnerability of migratory bird species to offshore wind energy projects on the Atlantic outer continental shelf—An assessment method and database: Final Report to the U.S. Department of the Interior, Bureau of Ocean Energy Management, Office of Renewable Energy Programs, OCS Study BOEM 2013-207, 275 p. [Available at https://espis.boem.gov/final%20reports/5319.pdf.]
Rueda-Uribe, C., Lötberg, U., and Åkesson, S., 2022, Foraging on the wing for fish while migrating over changing landscapes—Traveling behaviors vary with available aquatic habitat for Caspian terns: Movement Ecology, v. 10, no. 9, 15 p.[Available at https://doi.org/10.1186/s40462-022-00307-8.]
Shavykin, A., and Karnatov, A., 2022, The issue of using ordinal quantities to estimate the vulnerability of seabirds to wind farms: Journal of Marine Science and Engineering, v. 10, no. 11, 22 p. [Available at https://doi.org/10.3390/jmse10111584.]
Spear, L.B., and Ainley, D.G., 2005, At-sea behaviour and habitat use by tropicbirds in the eastern Pacific: IBIS, v. 147, no. 2, p. 391–407. [Available at https://doi.org/10.1111/j.1474-919x.2005.00418.x.]
Takekawa, J.Y., Perry, W.M., Adams, J., Felis, J.J., Williams, L.L., Yee, J.L., Orthmeyer, D.L., Mason, J.W., McChesney, G.J., McIver, W.R., Carter, H.R., and Golightly, R.T., 2017, At-sea distribution and abundance of seabirds and marine mammals off southern California GIS resource database—Aerial seabird and marine mammal surveys off southern California, 1999–2002: U.S. Geological Survey data release, accessed September 21, 2023, at https://doi.org/10.5066/F7PK0D9P.
Tethys, 2023, Tethys knowledge base—Environmental effects of wind and marine renewable energy: Pacific Northwest National Laboratory website. [Available at https://tethys.pnnl.gov/.]
van Bemmelen, R.S.A., Leemans, J.J., Collier, M.P., Green, R.M.W., Middelveld, R.P., Thaxter, C.B., and Fijn, R.C., 2023, Avoidance of offshore wind farms by Sandwich Terns increases with turbine density” Ornithological Applications, v. 126, no. 1, 10 p. [Available at https://doi.org/10.1093/ornithapp/duad055.]
Vanermen, N., Courtens, W., Van de walle, M., Verstraete, H., and Stienen, E.W.M., 2017, Seabird monitoring at the Thornbank offshore wind farm: Updated seabird displacement results & an explorative assessment of large gull behavior inside the wind farm area: Brussels, Belgium, Instituut voor Natuur- en Bosonderzoek, Rapporten van het Instituut voor Natuur- en Bosonderzoek, no. 31, 15 p. [Available at https://doi.org/10.21436/inbor.13185344.]
Weimerskirch, H., Le Corre, M., Ropert-Coudert, Y., Kato, A., and Marsac, F., 2005, The three-dimensional flight of red-footed boobies—Adaptations to foraging in a tropical environment?: Proceedings of the Royal Society B, v. 272, p. 53–61. [Available at https://doi.org/10.1098/rspb.2004.2918.]
Abbreviations
BOEM
Bureau of Ocean Energy Management
CV
Collision Vulnerability
DFA
Diurnal Flight Activity
DV
Displacement Vulnerability
FA
Flight Activity
FM
Foraging Mode
FS
Foraging Specificity
HF
Habitat Flexibility
HS
Habitat Specificity
MA
Macro-Avoidance
N&D
Nocturnal and Diurnal
NFA
Nocturnal Flight Activity
OWEI
offshore wind energy infrastructure
POCS
U.S. Pacific Outer Continental Shelf
PV
Population Vulnerability
RSZt
time spent in the Rotor Swept Zone
SS
Spatial Specificity
For more information concerning the research in this report, contact the
Director, Western Ecological Research Center
U.S. Geological Survey
3020 State University Drive East
Sacramento, California 95819
https://www.usgs.gov/centers/werc
Publishing support provided by the Science Publishing Network,
Sacramento Publishing Service Center
Disclaimers
Any use of trade, firm, or product names is for descriptive purposes only and does not imply endorsement by the U.S. Government.
Although this information product, for the most part, is in the public domain, it also may contain copyrighted materials as noted in the text. Permission to reproduce copyrighted items must be secured from the copyright owner.
Suggested Citation
Kelsey, E.C., Felis, J.J., Pereksta, D.M., and Adams, J., 2025, Revised marine bird collision and displacement vulnerability index for U.S. Pacific Outer Continental Shelf offshore wind energy development (ver. 1.1, November 2025): U.S. Geological Survey Data Report 1214, 32 p., https://doi.org/10.3133/dr1214.
ISSN: 2771-9448 (online)
Study Area
| Publication type | Report |
|---|---|
| Publication Subtype | USGS Numbered Series |
| Title | Revised marine bird collision and displacement vulnerability index for U.S. Pacific Outer Continental Shelf offshore wind energy development |
| Series title | Data Report |
| Series number | 1214 |
| DOI | 10.3133/dr1214 |
| Edition | Version 1.0: August 19, 2025; Version 1.1: November 17, 2025 |
| Publication Date | August 21, 2025 |
| Year Published | 2025 |
| Language | English |
| Publisher | U.S. Geological Survey |
| Publisher location | Reston, VA |
| Contributing office(s) | Western Ecological Research Center |
| Description | viii, 32 p. |
| Country | Mexico, United States |
| Online Only (Y/N) | Y |