Continuous Water-Quality and Suspended-Sediment Transport Monitoring in San Francisco Bay, California, Water Years 2020–21
Links
- Document: Report (2.03 MB pdf) , HTML , XML
- Download citation as: RIS | Dublin Core
Abstract
The U.S. Geological Survey (USGS) has continuously monitored real-time water quality and suspended-sediment transport in San Francisco Bay (the Bay) since 1989 as part of a multi-agency effort (see “Acknowledgments” section) to address estuary management, water supply, and ecological concerns. The San Francisco Bay area is home to millions of people and biologically diverse marine and terrestrial flora and fauna. Freshwater mixes with saltwater in the Bay and is subject to riverine influences (floods, droughts, managed reservoir releases, and freshwater diversions) and marine influences (tides, waves, and effects of saltwater).
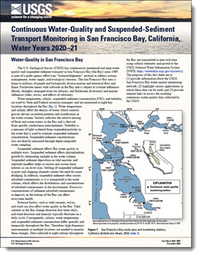
Water temperature, salinity, suspended-sediment concentration (SSC), and turbidity, are used by State and Federal resources managers and are monitored at eight key locations throughout the Bay (fig. 1). Water temperature and salinity affect the density of water, which controls gravity-driven circulation patterns and stratification in the water column. Salinity indicates the relative mixing of fresh and ocean waters in the Bay and is derived from specific conductance measurements. Turbidity is a measure of light scattered from suspended particles in the water that is used to estimate suspended-sediment concentration. Suspended-sediment concentrations also are directly measured through depth-integrated water sampling.
Suspended sediment affects Bay water quality in multiple ways. Suspended sediment affects phytoplankton growth by attenuating sunlight in the water column. Suspended sediment deposition on tidal marshes and intertidal mudflats helps to restore and sustain these habitats as sea level rises. Settling of suspended sediment in ports and shipping channels creates the need for more dredging. In addition, suspended sediment often carries adsorbed contaminants as it is transported in the water column, which affects the distributions and concentrations of adsorbed contaminants in the environment. Excessive concentrations of sediment-adsorbed contaminants in deposits on the bottom of the Bay can affect ecosystem health.
External factors, such as tidal currents, waves, and wind can also affect water quality in the Bay. Tidal currents in the Bay change direction four times daily, and wind direction and intensity typically fluctuate on a daily cycle. Consequently, salinity, water temperature, and suspended-sediment concentration differ spatially and temporally throughout the Bay. Therefore, high-frequency measurements at multiple locations are needed to monitor these changes. Data collected at eight stations throughout the Bay are transmitted in near real-time using cellular telemetry and posted to the USGS National Water Information System (NWIS; https://waterdata.usgs.gov/usa/nwis). The purposes of this fact sheet are to (1) provide information about the USGS San Francisco Bay water-quality monitoring network; (2) highlight various applications in which these data can be used; and (3) provide internet links to access the resulting continuous water-quality data collected by the USGS.
Suggested Citation
Palm, D.L., Einhell, D.C., Davila Olivera, S.M., 2022, Continuous water-quality and suspended-sediment transport monitoring in San Francisco Bay, California, water years 2020–21: U.S. Geological Survey Fact Sheet 2022–3087, 4 p., https://doi.org/10.3133/fs20223087.
ISSN: 2327-6932 (online)
Study Area
Table of Contents
- Water-Quality in San Francisco Bay
- Program Overview
- Acknowledgments
- References Cited
| Publication type | Report |
|---|---|
| Publication Subtype | USGS Numbered Series |
| Title | Continuous water-quality and suspended-sediment transport monitoring in San Francisco Bay, California, water years 2020–21 |
| Series title | Fact Sheet |
| Series number | 2022-3087 |
| DOI | 10.3133/fs20223087 |
| Publication Date | December 29, 2022 |
| Year Published | 2022 |
| Language | English |
| Publisher | U.S. Geological Survey |
| Publisher location | Reston, VA |
| Contributing office(s) | California Water Science Center |
| Description | 4 p. |
| Country | United States |
| State | California |
| Other Geospatial | San Francisco Bay |
| Online Only (Y/N) | Y |
| Additional Online Files (Y/N) | N |


