

Tracking Status and Trends in Seven Key Indicators of Stream Health in the Chesapeake Bay Watershed
Links
- Document: Report (2.27 MB pdf) , HTML , XML
- Data Releases:
- USGS data release - Compilation of multi-agency water temperature observations for streams within the Chesapeake Bay watershed
- USGS data release - Compilation of multi-agency specific conductance observations for streams within the Chesapeake Bay watershed
- NGMDB Index Page: National Geologic Map Database Index Page (html)
- Download citation as: RIS | Dublin Core
Background
“The Bay Connects us, the Bay reflects us” writes Tom Horton in the book “Turning the Tide—Saving the Chesapeake Bay” (Horton, 2003, p. 3). The Chesapeake Bay watershed contains the largest estuary in the United States. The watershed stretches north to Cooperstown, New York, south to Lynchburg and Virginia Beach, Virginia, west to Pendleton County, West Virginia, and east to Seaford, Delaware, and Scranton, Pennsylvania. The watershed is more than 64,000 square miles that contain 150 major rivers and streams, hereafter referred to collectively as streams, that total more than 100,000 miles in length. The watershed contains thousands of smaller creeks and tributaries, large numbers of plants and animals, and, in 2020, more than 18.4 million people (Chesapeake Bay Program, 2022a). As changes occur in population, land use, and climate within the watershed, so too do the diversity and health of the Bay's ecosystems (Horton, 2003).
Overview
The U.S. Geological Survey (USGS) assembled a team of ecosystem scientists in October 2021 to identify and track the status of, and trends in, seven key indicators of stream health in the Chesapeake Bay watershed.
The USGS team consists of specialists in aquatic communities, streamflow, water quality, hydromorphology, water temperature, salinity, and toxic contaminants. They are developing the following methods to track status (condition) and trends (change over time) for seven key indicators of stream health in the Chesapeake Bay watershed:
-
• Freshwater stream flows;
-
• Nitrogen, phosphorous, and sediment loads in non-tidal streams;
-
• Temperatures of streams;
-
• Hydromorphology of non-tidal streams;
-
• Freshwater salinization of streams;
-
• Toxic contaminants in streams; and
-
• Biological aquatic communities in streams.
As methods and results are published, timely access to status and trends in these key stream-health indicators will be available to stakeholders and the public through frequently updated reports, detailed online descriptions, maps, and interactive web-based tools.
Status and Trend
Status describes the condition of a particular indicator at one moment in time. Trend describes change in an indicator over time. The status of an indicator often depends on its quantity or size defined as increase minus decrease over a previous time interval. Trend is a statistically meaningful departure from a previous condition measured over an interval of time between two or more previously documented conditions. Trend analyses describing changes in Chesapeake Bay watershed stream health span time intervals of five or more years.
The Seven Key Indicators of Stream Health
Water Flow
Chesapeake Bay health is greatly affected by freshwater flows from streams draining its watershed. Variations in the amount of freshwater flow entering the Bay can change water temperature and salinity levels, affect the amounts of nutrients, sediment, and contaminants delivered to non-tidal and tidal waters, and change the amount of instream habitat available to freshwater flora and fauna. Knowledge of daily, monthly, and annual amounts of freshwater flow in streams, interpreted from continuous analyses of USGS stream flow data, is essential to understand ecosystem conditions and evaluate status and trends in stream health within the Bay watershed (U.S. Geological Survey, 2022; fig. 1).
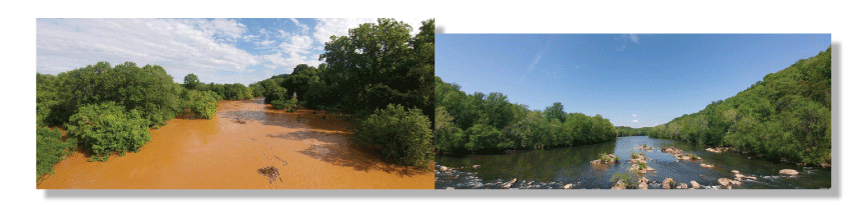
Streamflow status can change dramatically. Trends in status are affected by land use and climate change. (Suspended-sediment concentrations in the Rappahannock River in Virginia after heavy rainfall (left). Rivanna River in Virginia (right) is surrounded by forest land and relatively pristine. Photographs by Chris Mason, U.S. Geological Survey.)
Water Quality
The health of aquatic communities in the Chesapeake Bay and its tributaries is linked to water quality. Some key indicators linked to water quality are nitrogen, phosphorus, and suspended-sediment loads (status) and changes in loads (trends). Data continuously compiled since 1985 from a non-tidal network of 123 USGS monitoring sites across 5 States provide nitrogen, phosphorus, and suspended-sediment load observations for approximately 78 percent of the 64,000 square-mile Chesapeake Bay watershed (Mason and others, 2021b). Long-term trends in water quality calculated for sites with at least 30 years of data, and short-term water-quality trends are calculated for sites with at least 10 years of data. Short-term water-quality trends provide reliable annual and monthly load estimates if at least five years of data are available.
Water Temperature
Stream productivity and the metabolic rate of aquatic organisms are dependent on temperature (Cushing and Allan, 2001). Stream temperature can fluctuate naturally due to atmospheric conditions, topography, stream flow and streambed heat transfer, or as the result of human influences, such as land use, thermal pollution, water storage impoundments, and climate change (Caisse, 2006; Webb and others, 2008). Water temperature data are derived from a multi-agency dataset of available stream temperatures (Clune and others, 2023). Data selected and analyzed for status and trends include historical stream temperature time -series that span the varying latitude, elevation, and temperature ranges of the Bay watershed (fig. 2). Data selection is dependent upon the overall data quality and representative daily observations available for aggregation (daily mean, minimum, and maximum values).
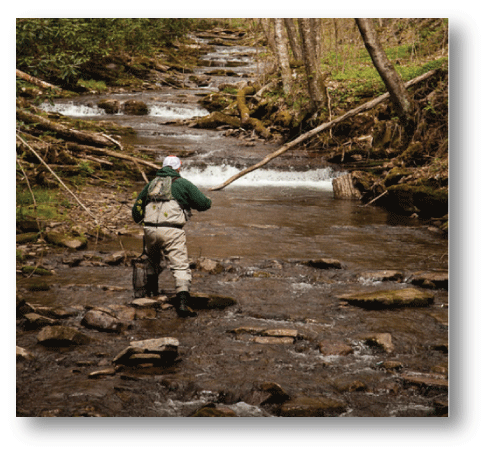
Knowing a stream's flow, hydromorphology, water quality, and temperature is essential to evaluate the health of biological aquatic communities. (Photograph by Will Parson, Chesapeake Bay Program, used with permission).
Hydromorphology
Instream physical habitat is the product of a complex interplay between flow, sediment, geomorphology, and vegetation. This interaction, referred to as hydromorphology (Orr and others, 2008), supports a range of processes at multiple spatial and temporal scales that can create a diverse patchwork of habitats, water depths, flow types and velocities, substrate, and channel forms. These ecologically relevant habitats can support overall stream health and a diverse ecological community. Status and trends in hydromorphology are evaluated using two main data sources: (1) rapid-habitat assessment data from multiple sources (Chesapeake Bay Program, 2021), and (2) analyses of USGS streamgages for changes to channel geometry and local hydraulics (U.S. Geological Survey, 2023; fig. 3).
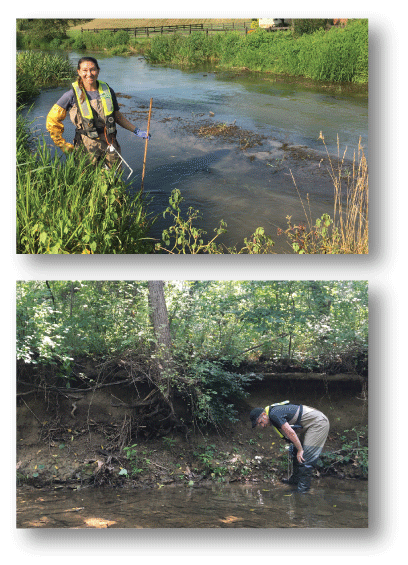
Maintaining naturally occurring dimension, pattern, profile, and flow regimes of stream systems (left) helps to prevent severe bank-cutting, erosion, and sedimentation (right). Photograph by Matt Cashman, U.S. Geological Survey.
Salinity
Freshwater salinization, or the increase in ionic concentrations in freshwater ecosystems, is a key water-quality issue in the Chesapeake Bay watershed. Higher-than-normal salinity levels affect freshwater ecosystems in many ways, one of them is the disruption of osmotic-pressure regulation in aquatic organisms (Griffith, 2014). Although salinity is typically low in freshwater streams in the mid-Atlantic region, many sources of salinity are found in the watershed, including applications of agricultural limestone, road deicer material (fig. 4), mining leachate, weathering of human-made surfaces, household water softeners, and other point-source discharges. Specific conductance data (an indicator of salinity) are compiled from a multi-agency dataset (Fanelli and others, 2023). This dataset includes data collected at various frequencies (for example, annually, monthly, 15-minute intervals), which is used to quantify a set of ecologically relevant metrics to compute status and trend analyses.
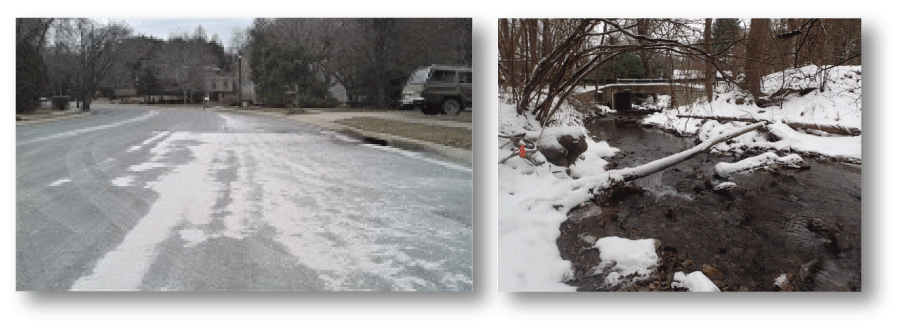
Winter applications of deicer material on roads, bridges, and sidewalks (left) may wash into storm sewers and increase salinity in nearby streams and rivers (right). Photographs by Rosemary Fanelli, U.S. Geological Survey (left); and Joel Moore, Towson University, used with permission (right).
Toxic Contaminants
More than three-quarters of tidal waters in the Chesapeake Bay are partially or fully impaired by toxic contaminants (Chesapeake Bay Program, 2022b, Chesapeake Bay Program, 2022c); an example being compounds resulting in toxicity effects to fish which could lead to human exposure. Because there are no Bay-wide Total Maximum Daily Loads (TMDLs) for individual toxic contaminants or contaminant classes, these data vary more than data for other domains with regards to sample collection and analysis methodology, frequency, and location. These data have often been collected with a different purpose than assessment of status and trends, and data may be geographically focused. Further complicating the understanding of toxic contaminants in the Bay watershed is the variability in the fate and transport of the individual compounds in contaminant classes, the prevalence of the contaminants in different landscapes (agricultural and urban), the inclusion of legacy pesticides (polychlorinated biphenyls [PCBs] and organochlorides), current use pesticides (mercury, polycyclic aromatic hydrocarbons [PAHs]), and emerging contaminants such as per- and polyfluoroalkyl substances (PFAS). Select toxic contaminants, such as mercury and PCBs, drive most fish-consumption advisories in the watershed. This results in state datasets for contaminants in fish tissue over time (Banks and others, 2022). Data for other constituents and in other environments are less common, and are typically associated with specific, localized impairments or contaminated sites.
Although methods exist to assess status and trends of individual toxic contaminants at management-relevant scales, the inconsistencies across collection agencies and time coupled with the limited sample frequency in some media, make calculations of trends infeasible. In limited geographically focused areas (for example, in reaches with fish-consumption advisories for specific toxic contaminants) within the Chesapeake Bay watershed, the quantity of contaminants residing within the specified media (for example, within fish tissue) and rates-of-change in quantity over time, are identified. Even in these more data-dense media and locations, input data limits the statistical confidence in calculations.
Biological Aquatic Communities
Two freshwater assemblages: (1) benthic macroinvertebrates, and (2) fish, are key indicators of stream health and habitat condition. These two assemblages can also be used to measure progress in improving stream health and fish habitats. Two Chesapeake Bay watershed-wide compilation efforts provide data to address this need: (1) benthic macroinvertebrate data compiled during the generation of the Chesapeake basin-wide index of biotic integrity for stream macroinvertebrates (Chessie BIBI; Smith and others, 2017); and (2) fish sampling data compiled for development of an assessment of fish habitat (Krause and Maloney, 2021). These two datasets create numerous approaches for which site-specific measures of benthic macroinvertebrates and fishes may be characterized, including metrics describing assemblage composition (life histories and tolerance classifications), taxonomic composition, multi-metric composite indices, and presence or abundance of specific species (fig. 5).
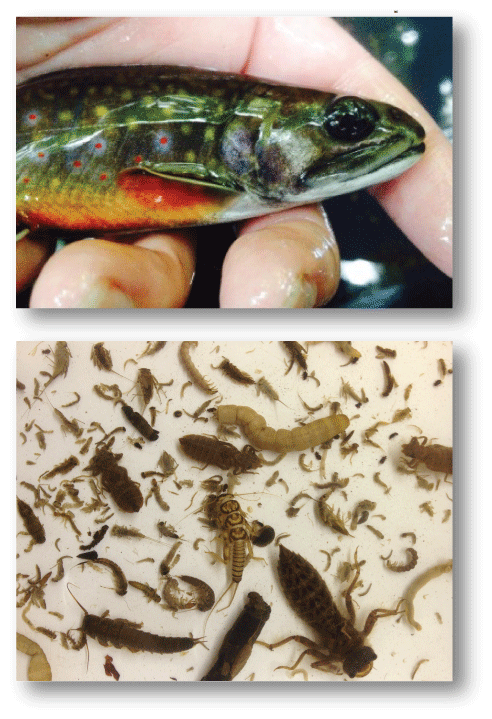
Macroinvertebrates (left) and brook trout (right) are representative members of the Chesapeake Bay watershed freshwater biological aquatic community. Photographs by Kelly Maloney, U.S. Geological Survey (left); Jeffrey Cole, U.S. Geological Survey (right).
Status and Trend Tracking Techniques
Status and trends are identified using approaches suited to each science domain. For example, well-established indicators, such as weighted regressions on time, discharge, and season are used to compute status and trends in nitrogen, phosphorus, and suspended-sediment loads in the water-quality domain (Mason and others, 2021b). Methods used in other science domains include calculation of mean values over distinct time intervals, moving-average metrics integrating change over time (status), and smoothed lines identifying change over time (trend). Statistical tests include seasonal Mann-Kendall trends tests with, and without, Theil-Sen slope computations (Mason and others, 2021a). Another approach, called generalized additive modeling, may be used with additional explanatory variables to estimate non-linear patterns and identify periods of significant change (Yang and Moyer, 2020). Each indicator includes metrics that are ecologically relevant and sensitive to major influences on freshwater stream ecosystems such as climate and land-use change. Status and trend analyses among indicators use common time periods or co-located sites when possible, to allow both spatial and temporal comparisons of results among the seven key indicators of stream health.
Outcomes
General outcomes of this work include spatial maps of stream health indicators, which help resource managers pinpoint areas of concern and help explain status and trends in the condition of co-located biological variables such as fish and macroinvertebrates. A focus is addressing important stakeholder questions such as: How long do effects linger after human disturbance of a stream channel? What is the recovery time from disturbances, such as a dam removal? Can the effects of legacy sediment from disturbances in the past be seen in current stream channel conditions (Cashman and others, 2021)?
Analyses also address a fundamental question: What are the magnitudes and trends in nitrogen, phosphorus, and suspended sediment that are delivered annually to the Chesapeake Bay from nontidal portions of the Chesapeake Bay watershed (Mason and others, 2021b)? Answers to this and the other previously mentioned questions address stakeholder needs identifying streams, state-designated watersheds, and other areas experiencing statistically meaningful changes in constituents relative to historic levels. Results of these analyses, paired with knowledge of aquatic biological health, best management practices, and stream restoration data offer insights into whether resource-management decisions are providing ecological uplift sufficient to sustain the freshwater stream resources of the watershed.
As status and trend analyses progress, connections among watershed stream-health indicators emerge. A synthesis framework based on feedback dynamics identifies connections among key indicators informing understanding of systemic influences on Chesapeake Bay watershed stream health (Forrester, 1971). Combined analyses and syntheses of status and trends across key indicators of watershed stream health help discern how and to what extent biological aquatic communities are responding to changing instream, landscape, and climate conditions across the Chesapeake Bay watershed (fig. 6).
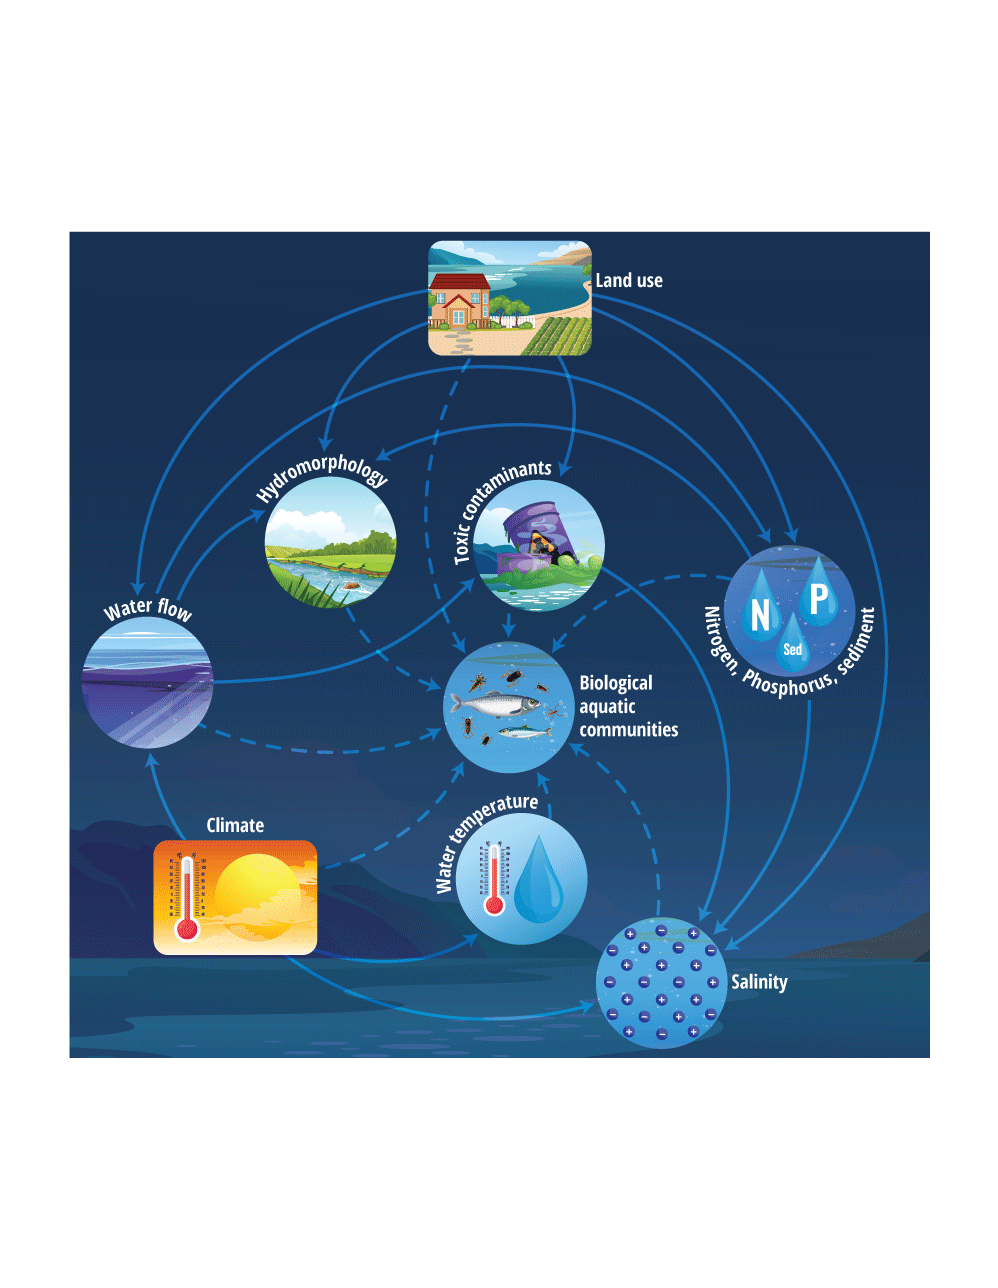
Connections (arrows) among stream health indicators (circles), and system drivers (boxes). Solid lines indicate material links, dashed lines indicate information links. Not all connections are shown.
Accessing Status and Trend Results
Timely access to status and trends in key stream-health indicators is available through the Tracking Status and Trends in Seven Key Indicators of River and Stream Condition in the Chesapeake Bay Watershed web portal. Information is continuously updated and available to stakeholders and the public through interactive web-based tools, detailed online interactive maps, news feeds, and reports. For more information, visit the status and trends website at https://www.usgs.gov/CB-status-trend.
References Cited
Cashman, M.J., Gellis, A., Boyd, E., Collins, M., Anderson, S.W., McFarland, B.D., and Ryan, A.M., 2021, Channel response to a dam removal sediment pulse captured at high temporal resolution using routine gage data: Earth Surface Processes and Landforms, v. 46, no. 6, p. 1145–1159, accessed February 15, 2022, at https://doi.org/10.1002/esp.5083.
Chesapeake Bay Program, 2021, Chesapeake Bay program datahub, version 4.8.1, accessed August 10, 2021, at https://datahub.chesapeakebay.net/.
Chesapeake Bay Program, 2022a, Chesapeake Bay program population web page, accessed February 1, 2022, at https://www.chesapeakebay.net/state/population.
Chesapeake Bay Program, 2022b, Chesapeake Bay program chemical contaminants web page, accessed February 10, 2022, at https://www.chesapeakebay.net/issues/chemical_contaminants.
Chesapeake Bay Program, 2022c, Chesapeake Bay program toxic contaminants policy and prevention: Chesapeake Progress web page, accessed March 10, 2022, at https://www.chesapeakeprogress.com/clean-water/toxic-contaminants-policy-and-prevention.
Fanelli, R.M., Sekellick, A.J., and Hamilton, W.B., 2023, Compilation of multi-agency specific conductance observations for streams within the Chesapeake Bay watershed, U.S. Geological Survey data release, accessed April 12, 2023, at https://doi.org/10.5066/P98O2HQJ.
Griffith, M.B., 2014, Natural variation and current reference for specific conductivity and major ions in wadeable streams of the conterminous USA: Freshwater Sci., v. 33, no. 1, p. 1-17, accessed February 15, 2022, at https://www.journals.uchicago.edu/doi/full/10.1086/674704.
Mason, C.A., Chanat, J.G., and Rapp, J.L., 2021a, Multidecadal streamflow trends and ecological flow statistics at USGS streamgages within the Chesapeake Bay watershed (1940—2018): U.S. Geological Survey data release, accessed February 22, 2022, at https://doi.org/10.5066/P99OOTED.
Mason, C.A., Soroka, A.M., Moyer, D.L., and Blomquist, J.D., 2021b, Nitrogen, phosphorus, and suspended-sediment loads and trends measured at the Chesapeake Bay River input monitoring stations—Water years 1985—2020: U.S. Geological Survey data release, accessed February 15, 2022, at https://doi.org/10.5066/P93PZGMM.
Smith, Z.M., Buchanan, C., and Nagel, A., 2017, Refinement of the basin-wide index of biotic integrity for non-tidal streams and wadeable rivers in the Chesapeake Bay Watershed—ICPRB Report 17-2: Interstate Commission on the Potomac River Basin, Rockville, Maryland, accessed February 15, 2022, at https://www.potomacriver.org/wp-content/uploads/2017/05/ChessieBIBI_Report_Final_5-25-2017.pdf.
U.S. Geological Survey, 2022, USGS water data for the nation: U.S. Geological Survey National Water Information System database, accessed October 1, 2022, at https://doi.org/10.5066/F7P55KJN.
U.S. Geological Survey, 2023, USGS water data for the nation: U.S. Geological Survey National Water Information System database, accessed January 15, 2023, at https://doi.org/10.5066/F7P55KJN.
Webb, B.W., Hannah, D.M., Moore, R.D., Brown, L.E., and Nobilis, F., 2008, Recent advances in stream and river temperature research: Hydrological Processes, v. 22, no. 7, p. 902–918, accessed May 11, 2022, at https://doi.org/10.1002/hyp.6994.
Yang, G., and Moyer, D.L., 2020, Estimation of nonlinear water-quality trends in high-frequency monitoring data: Science of the Total Environment, v. 715, p. 136686, accessed February 15, 2022, at https://doi.org/10.1016/j.scitotenv.2020.136686.
Disclaimers
Any use of trade, firm, or product names is for descriptive purposes only and does not imply endorsement by the U.S. Government.
Although this information product, for the most part, is in the public domain, it also may contain copyrighted materials as noted in the text. Permission to reproduce copyrighted items must be secured from the copyright owner.
Suggested Citation
Austin, S.H., Cashman, M.J., Clune, J., Colgin, J.E., Fanelli, R.M., Krause, K.P., Majcher, E.H., Maloney, K.O., Mason, C.A., Moyer, D.L., and Zimmerman, T.M., 2023, Tracking status and trends in seven key indicators of stream health in the Chesapeake Bay watershed: U.S. Geological Survey Fact Sheet 2023–3003, 6 p., https://doi.org/10.3133/fs20233003.
ISSN: 2327-6932 (online)
ISSN: 2327-6916 (print)
Study Area
| Publication type | Report |
|---|---|
| Publication Subtype | USGS Numbered Series |
| Title | Tracking status and trends in seven key indicators of stream health in the Chesapeake Bay watershed |
| Series title | Fact Sheet |
| Series number | 2023-3003 |
| DOI | 10.3133/fs20233003 |
| Publication Date | February 21, 2023 |
| Year Published | 2023 |
| Language | English |
| Publisher | U.S. Geological Survey |
| Publisher location | Reston, VA |
| Contributing office(s) | Leetown Science Center, Pennsylvania Water Science Center, South Atlantic Water Science Center, Virginia and West Virginia Water Science Center , Maryland-Delaware-District of Columbia Water Science Center, Eastern Ecological Science Center |
| Description | Report: 6 p.; 2 Data Releases |
| Country | United States |
| Other Geospatial | Chesapeake Bay watershed |
| Online Only (Y/N) | N |
| Additional Online Files (Y/N) | N |