

Using Global Fiducials Library High-Resolution Imagery, Commercial Satellite Imagery, Landsat and Sentinel Satellite Imagery, and Aerial Photography to Monitor Change at East Timbalier Island, Louisiana, 1953–2021
Links
- Document: Report (150 MB pdf) , XML
- Data Release: USGS data release - Six decades of change at East Timbalier Island, Louisiana
- Version History: Version History (4.31 KB txt)
- NGMDB Index Page: National Geologic Map Database Index Page (html)
- Download citation as: RIS | Dublin Core
Acknowledgments
We would like to thank the following reviewers for their insightful comments on the paper, as their comments improved this report: David Jennings of the National Oceanic and Atmospheric Administration and Coral Roig-Silva, Julie Burnier, James Flocks, and Lisbeth Chandler (retired) of the U.S. Geological Survey.
Abstract
This report documents morphological changes between 1953 and 2021 at East Timbalier Island, Louisiana, a Gulf of Mexico barrier island. East Timbalier Island, which was located west of the Mississippi River Delta at the front of Timbalier Bay, was one of the most rapidly changing barrier islands on Earth. Since aerial photographs were initially taken in 1953, the Island steadily lost length and area, finally eroding away by early summer 2021. After major storm events, sediment eroded from the Island and migrated hundreds of meters north. In August 1992, Hurricane Andrew breached the Island in several places, resulting in increased erosion and land loss. Until it completely eroded away, the Island underwent a cycle of washovers, vegetation removal, breaching, and erosion with sediment transport to the north. Satellite imagery shows that three such cycles occurred between 1992 and 2017, despite the partial restoration of the Island between 1998 and 2000. Each cycle increased the distance between the Island and the mainland to the east, reducing both the sediment supply from the east and the protection that Timbalier Bay and the adjacent coastal lands received from the barrier island.
Previously, the U.S. Geological Survey (USGS) National Civil Applications Center used 1-meter resolution imagery archived at the USGS Global Fiducials Library (GFL), collected between 2000 and 2010 by U.S. National Imaging Systems, to monitor the changes at the Island. New research expands this study retrospectively and prospectively using aerial photography collected from 1953 to 2012 and in 2020; declassified imagery collected in 1962, 1972, and 1975; DigitalGlobe satellite imagery collected since 2004; Landsat satellite imagery collected since 1972; Sentinel–2 satellite imagery collected since 2015; and GFL imagery collected from 1991 to 2020.
Introduction
East Timbalier Island was a flanking barrier island located along the south-central coast of Louisiana (La.) (fig. 1), west of Port Fourchon, La., which is a major staging point for the Gulf Coast oil and gas industry. Over the more than 100 years since the area was first mapped (USGS, 1894), East Timbalier Island underwent a massive transformation because of natural and human-induced environmental changes. Barrier islands along the Louisiana coast are rapidly degrading due to relative sea-level rise, land subsidence, diminishing sand-sediment resources, and an expanding tidal prism due to wetland loss. On average, coastal Louisiana loses 57 square kilometers (km2) of land each year (Barras and others, 2008; Couvillion and others, 2017).
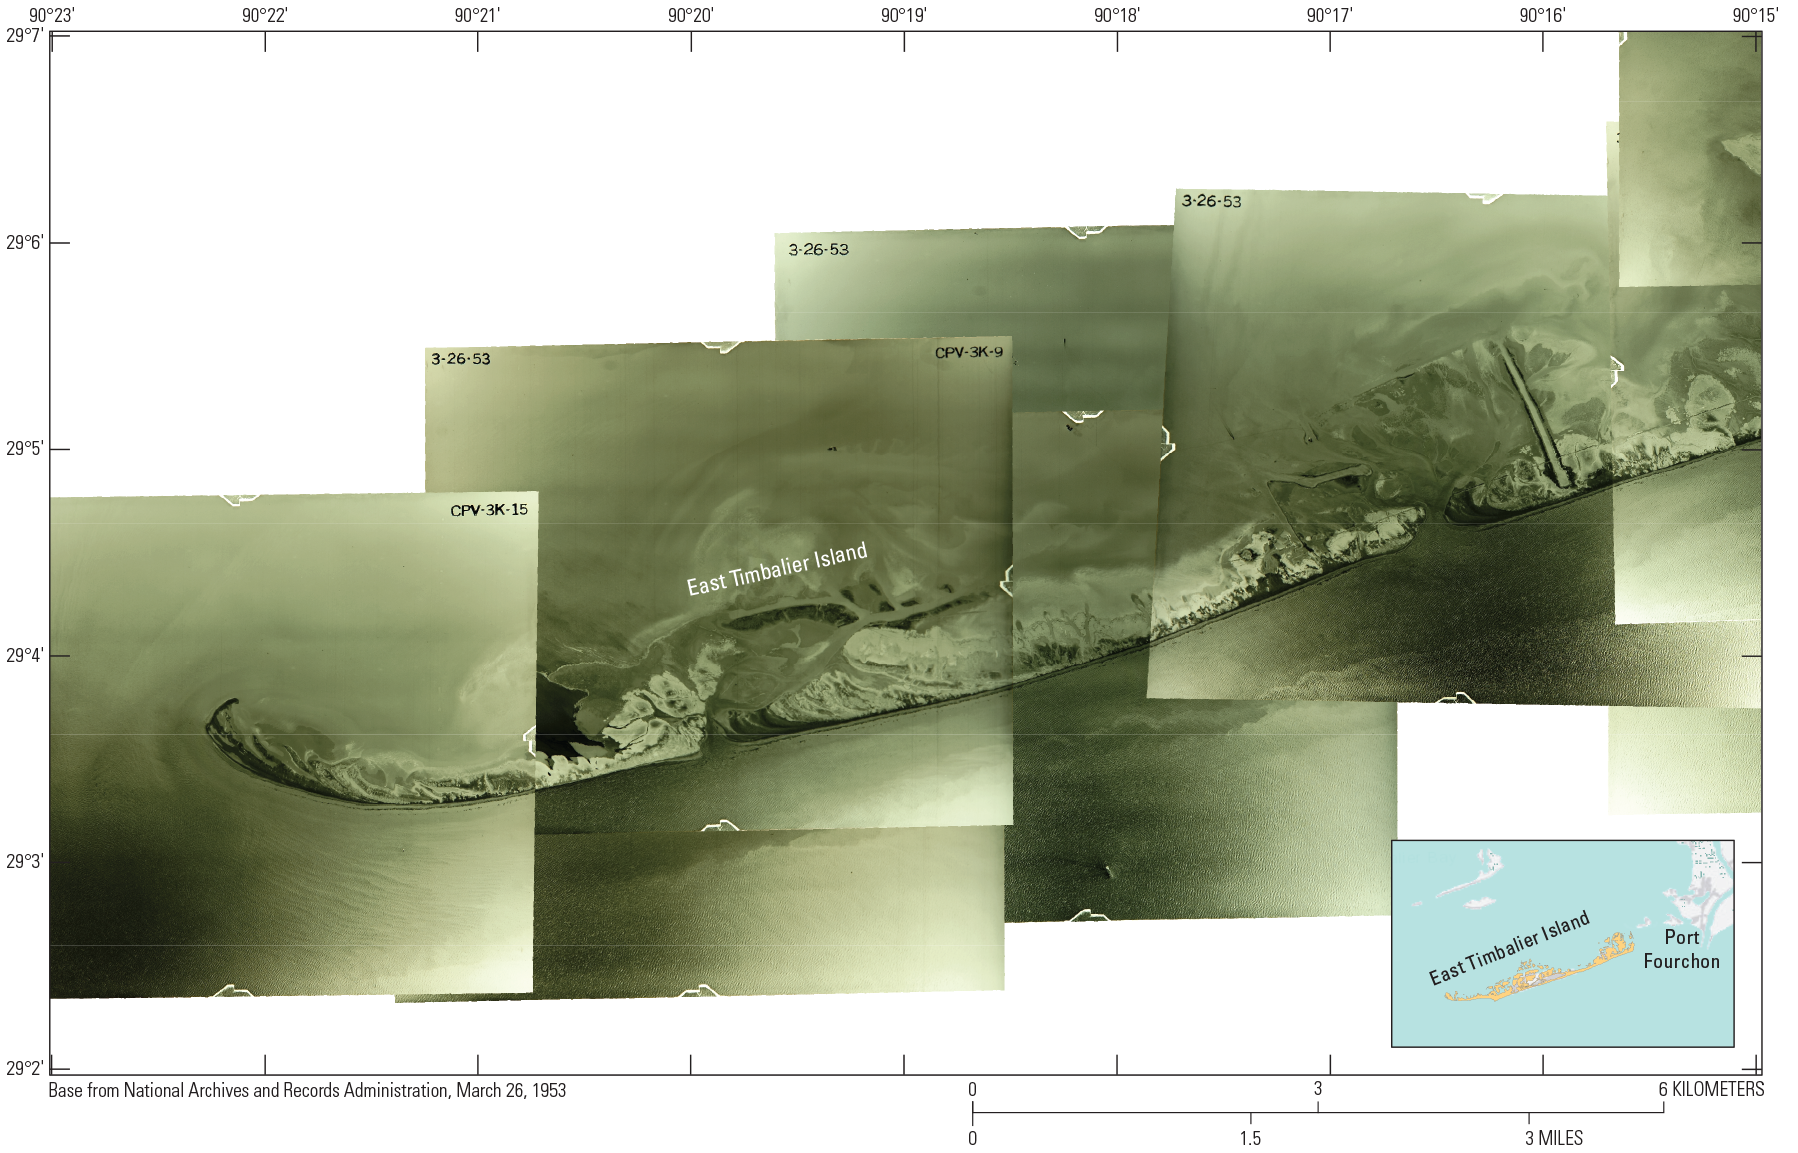
East Timbalier Island’s land-loss rates were among the highest on the Gulf Coast at 6,500 square meters (m2) per year (Thomas and others, 2011). In order to better understand the changes at East Timbalier Island, the U.S. Geological Survey (USGS) monitored these changes using remote sensing imagery products. Since the 1990s, the Global Fiducials Program (GFP) has provided high-resolution imagery of East Timbalier Island (Molnia and others, 2011; Thomas and others, 2011; Molnia, 2012; Molnia and others, 2019). These data allowed a consistent and scheduled look at changes. Additionally, the National Aerial Photography Program (NAPP), Louisiana State digital orthophoto quadrangle imagery, commercial aerial photography, satellite imagery, and declassified high-resolution HEXAGON imagery were used to closely monitor the changes that occurred since the early 1950s. This report describes and documents the dramatic landscape changes that occurred at East Timbalier Island between 1953 and 2021 and complements the paper “Using Remote Sensing and Imagery Exploitation to Monitor the Dynamics of East Timbalier Island, LA: 2000–2010” (Thomas and others, 2011). Figure 2 provides a historical topographic-map mosaic showing the Island as it appeared in 1953, when the earliest imagery used in this report was collected over this region.
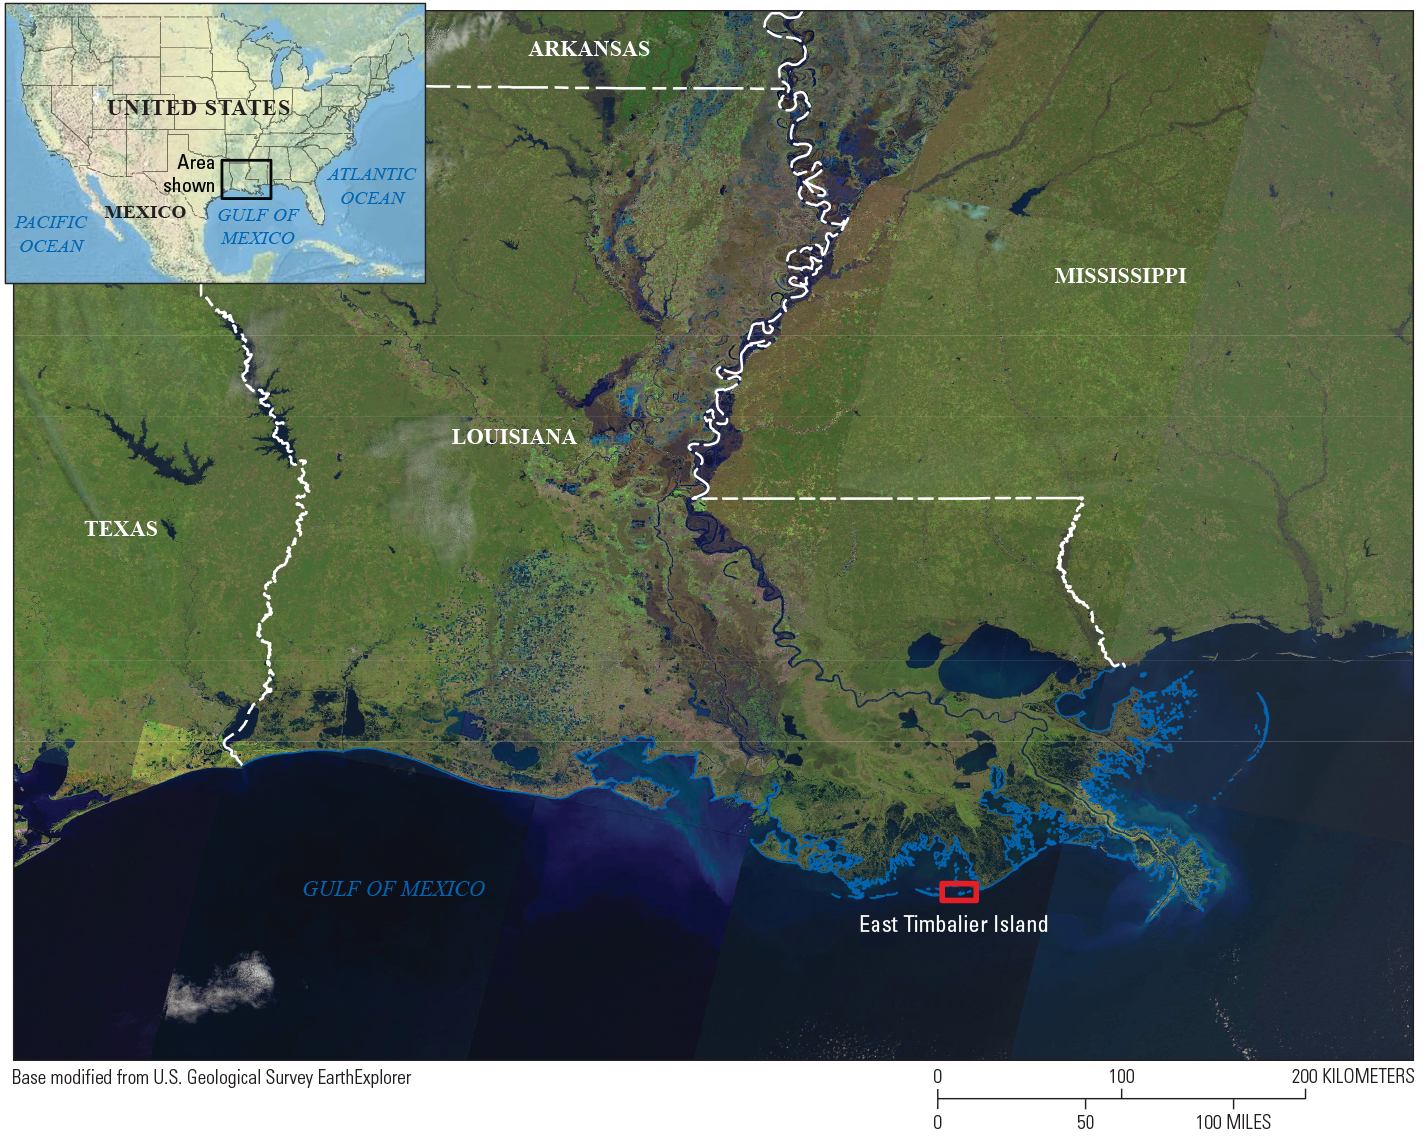
Map showing the location of the East Timbalier Island, Louisiana, study area.
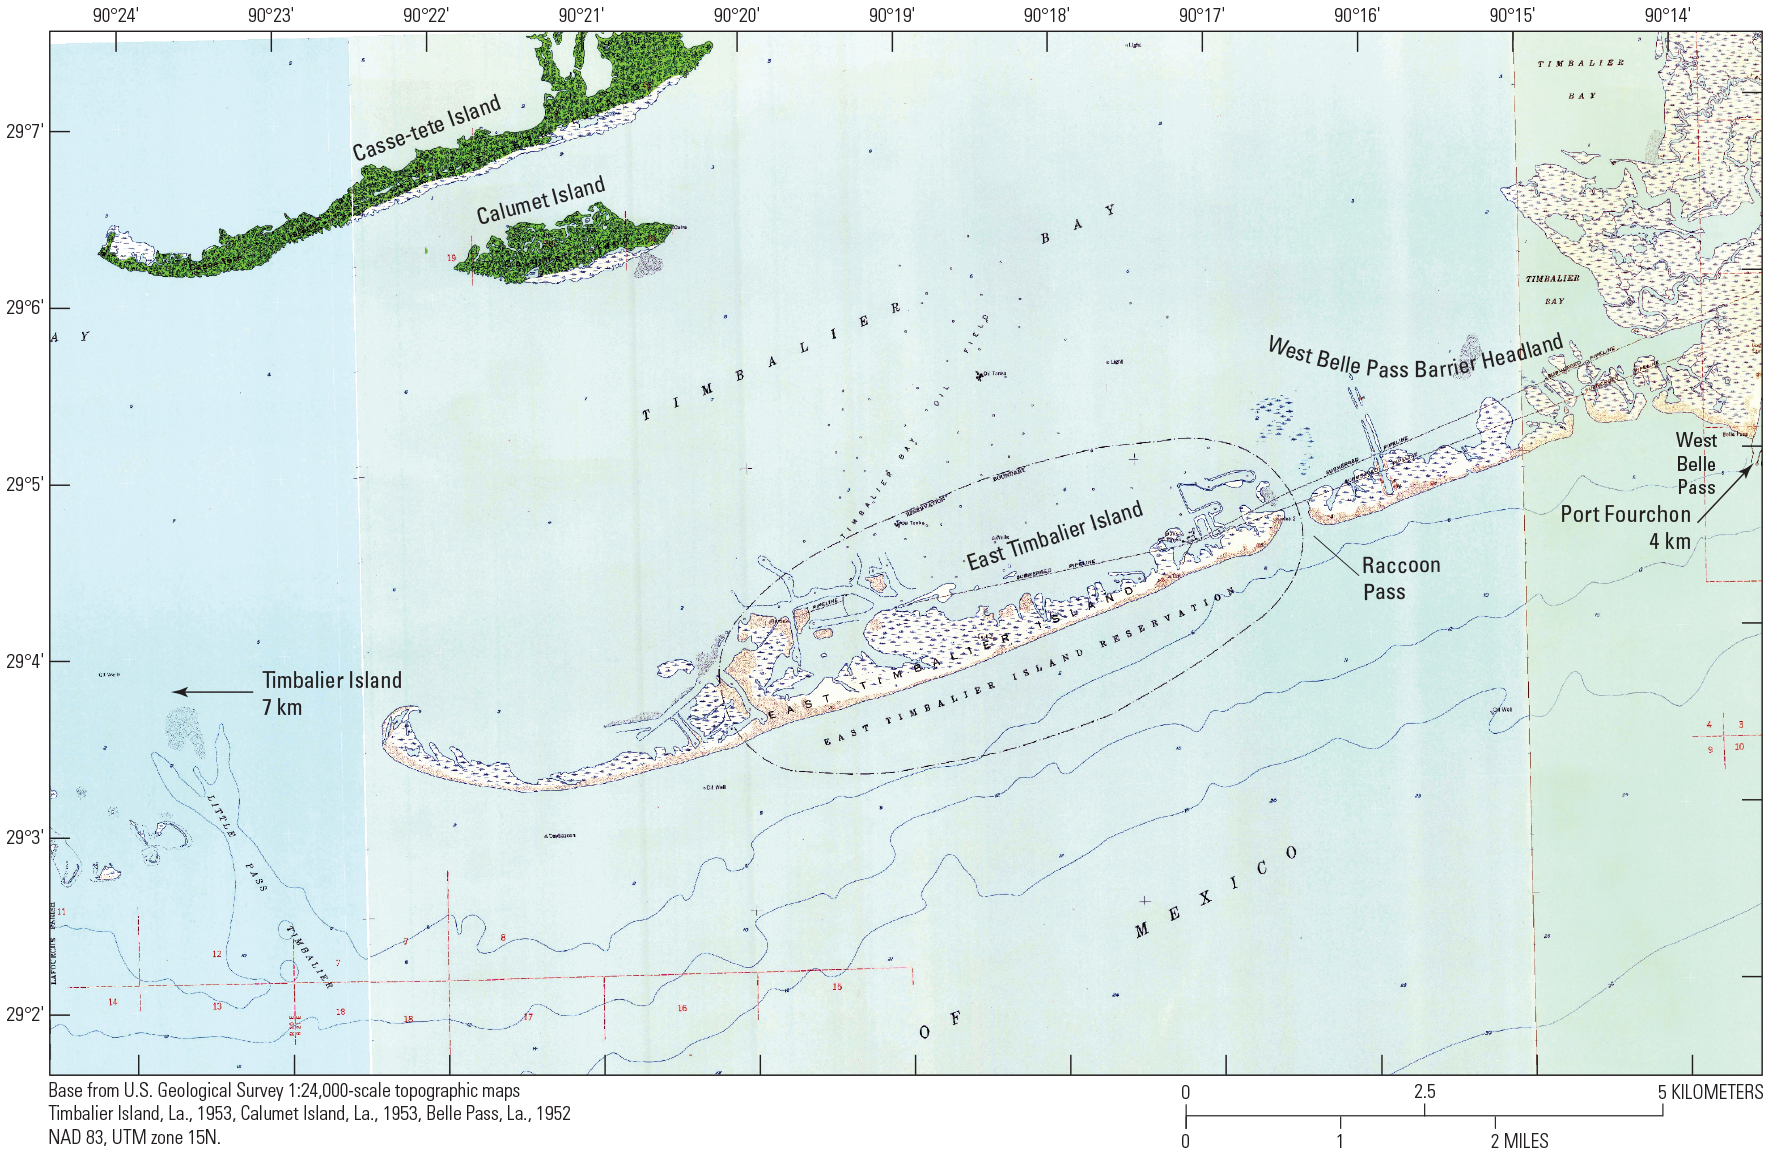
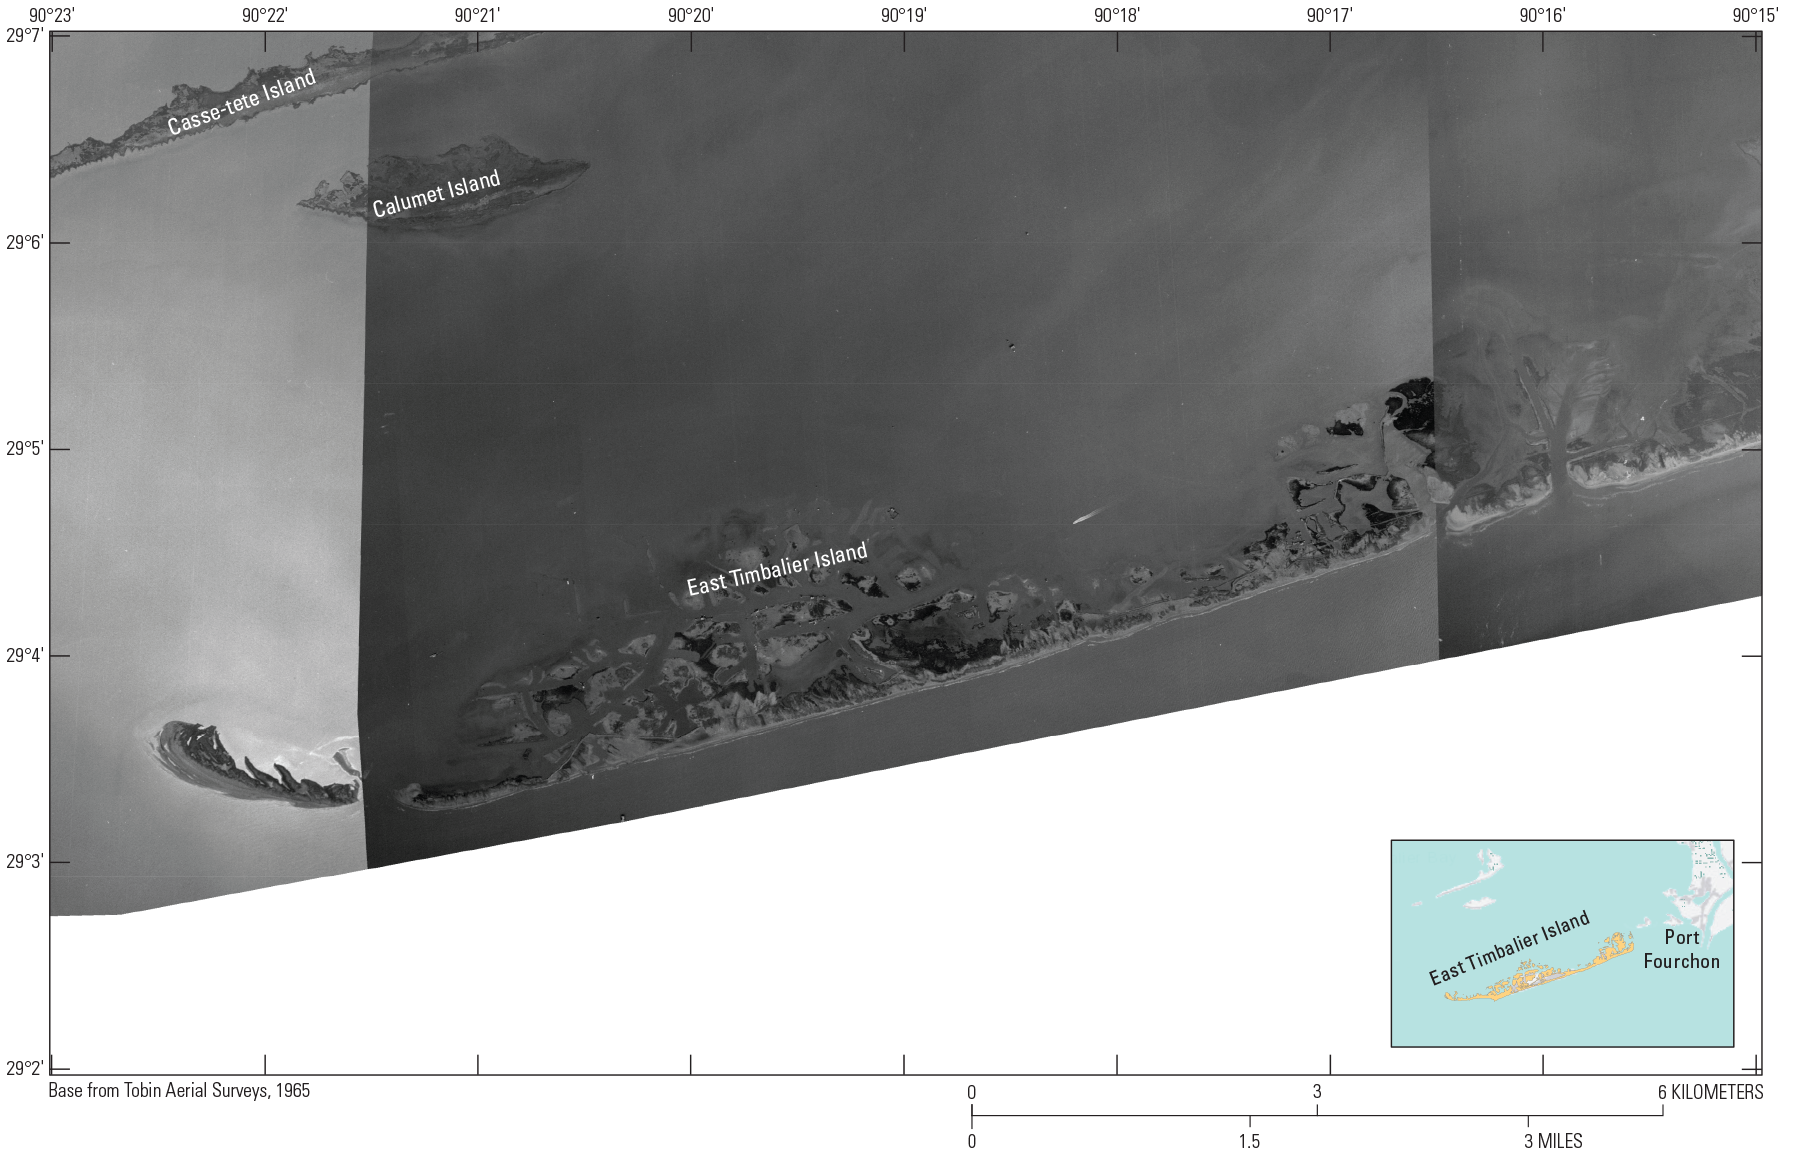
U.S. Geological Survey historical topographic map showing three Louisiana (La.) islands: East Timbalier Island, Casse-tete Island, and Calumet Island. km, kilometer; NAD 83, North American Datum of 1983; UTM zone 15N, Universal Transverse Mercator zone 15 north.
Geologic and Early Historical Evolution of East Timbalier Island
Timbalier Island and East Timbalier Island formed approximately 1,000–3,000 years ago as part of the Lafourche delta complex (Morgan, 1974). This delta complex is a historical location for the Mississippi River as it migrated eastward during the past 5,000 years (Frazier, 1967). Bayou Lafourche was a historical pathway for the Mississippi River before it migrated east, and it provided abundant sediment for barrier island formation and growth. The Timbalier Islands developed from the reworking and erosion of the Lafourche delta complex as it left its former path (Penland and Ramsey, 1990; Penland and others, 1997). The complexities of this region allowed for frequent changes to the barrier islands within Timbalier Bay. East Timbalier Island experienced exceptional changes over more than the past 100 years. These changes were driven by the redistribution of sediment by waves and currents, ground subsidence, storms and storm-surges, and saltwater intrusion.
As this study shows, the resultant landscape is one of the most dynamic places on Earth. The first detailed maps of the region were drawn in the early 19th century and show frequent changes to the geomorphology of the barrier islands along the Gulf Coast (Burr, 1839). A review of early maps highlights the dynamic nature of this coast. By the turn of the 20th century, the changes at East Timbalier Island had become even more pronounced. Many maps created during this time show the Island in different shapes and sizes, and this may be because of imprecise mapping methods and the remote location of this area. Changes that have occurred since the 1950s were captured as remote sensing data became available, and this data helped describe the sensitivity of this environment to alterations in sediment supply, dynamic weather events, and human-induced changes resulting from oil and gas production in the region.
Extreme Erosion During the Past 70 Years
This report shows that East Timbalier Island experienced one of the most significant erosion rates of any area on Earth (Thomas and others, 2011). The earliest aerial photographs of the Island available for this report (app. 1, figs. 1.1, 1.2) were taken in the 1950s and show that East Timbalier Island had lost almost 50 percent of its land area by April 26, 1992, just prior to when Hurricane Andrew breached the Island on August 26, 1992 (app. 1, fig. 1.9). Additionally, the Island migrated northwestward, and the shape of the Island morphed from a straight-line barrier island into a crescent shape. Several remediation projects attempted to stabilize and rebuild the Island (Curole and others, 2012), but the Island continued to erode and was projected to disappear within a few years of 2011 (Thomas and others, 2011). Numerous factors caused these changes, including a disruption to the sediment supply from Bayou Lafourche, high-energy tropical storms in the region, and the susceptibility of the Island to accelerated erosion from the installation of oil and gas industry infrastructure (Miner and others, 2006).
Regional Subsidence Contributing to Island Erosion
Studies of subsidence and sea-level rise based on the analysis of tide gauge data by Penland and Ramsey (1990) conclude that “rapid relative sea level rise induced by delta-plain subsidence and a deficit of terrigenous wetland sedimentation are the primary factors driving the rapid deterioration of the Louisiana coastal zone.” Kolb and Van Lopik (1958) note that subsidence due to compaction is more rapid in recently abandoned delta regions than in areas abandoned several hundred years earlier, and local differences in delta sediment composition may result in consolidation and subsidence at higher rates than for the delta as a whole. Penland and Ramsey (1990) determined that the “relative sea level appears to rise faster in the Terrebonne Parish area than anywhere else in Louisiana.” They relate the rate of subsidence to the thickness of Holocene delta deposits and attribute the subsidence to compaction of the sediments. Relative sea-level rise coupled with diminished sediment supply contributed to extensive erosion. The Louisiana Barrier Island Comprehensive Monitoring (BICM) program analyzed data collected between 1880 and 2005 and determined that the Timbalier Islands and the adjacent Caminada Headland have some of the highest levels of erosion in the region, including to the lower shoreface and offshore areas. During the study period of this report, the Timbalier Islands had the highest rates of landward migration (Miner and others, 2009; Kindinger and others, 2013).
Hurricane and Tropical Storm Impacts
Tropical storms are a natural occurrence in the Gulf of Mexico. The Louisiana coast, according to the National Oceanic and Atmospheric Administration (NOAA), has one of the highest concentrations of hurricane landfalls of the entire U.S. coast (NOAA, 2020b) (fig. 3). Based on records maintained since the mid-1800s, the region around East Timbalier Island experienced more than 41 major hurricanes, tropical storms, and tropical depressions (table 1). On average, the region is hit by a major tropical storm every 4.5 years.1 These storms greatly affected the stabilization of the Island and caused extensive reshaping and erosion.
Based on the data in table 1, the region around East Timbalier Island is hit by a major tropical storm every 4.5 years.
Recent storms—during the 1992, 2002, 2005, 2008, 2020, and 2021 hurricane seasons—caused extensive changes to the Island, which never recovered. On June 7, 2020, Tropical Storm Cristobal passed 50 kilometers (km) east of the Island and caused substantial wash over and erosion. Tropical Storm Marco on August 24, 2020, and Hurricane Zeta on October 28, 2020, both caused extensive erosion to the Island, resulting in a significant loss of land and ground cover. Tropical Storm Claudette passed 67 km west of the Island on June 18, 2021, removing all remnants of the Island, leaving temporary sand and sediment bars to the north. Hurricane Ida, a Category 4 storm, passed directly over Port Fourchon, less than 10 km east of the Island, on August 29, 2021.
Table 1.
Hurricanes (Category 1–5), tropical depressions, and tropical storms that potentially affected East Timbalier Island, Louisiana, from August 10, 1856, to August 29, 2021. Historical hurricane data for this table were obtained from the National Oceanic and Atmospheric Administration (NOAA) and are available at https://coast.noaa.gov/hurricanes/#map=4/32/-80 (NOAA, 2020a).[E, east; km, kilometer; N, north; n/a, not applicable; S, south; TD, tropical depression; TS, tropical storm; W west; —, unnamed]
A Category 4 hurricane split Isle Dernière, Louisiana (Trickey, 2017).
A “winter storm” destroyed Timbalier Bay Lighthouse on March 29–30, 1867 (USCG, 2015).
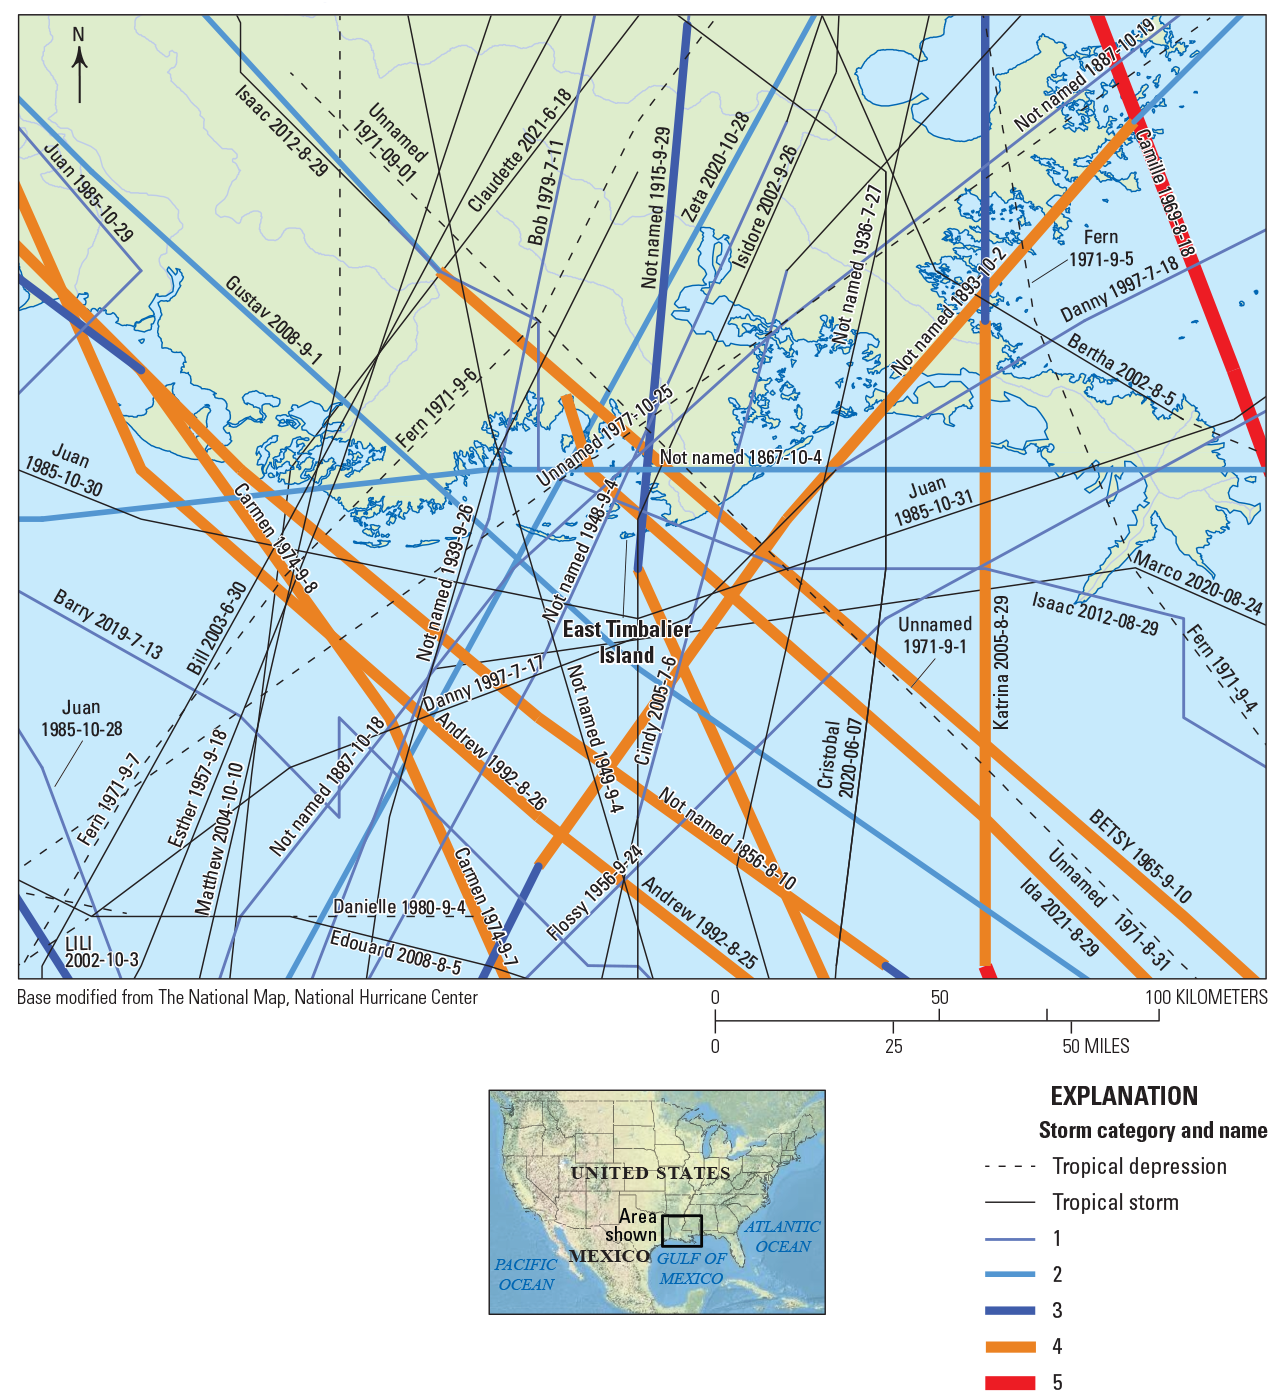
Map showing the paths of tropical depressions, tropical storms, and hurricanes that passed within 100 kilometers of East Timbalier Island, Louisiana, from 1856 to 2021. Dates are shown in year-month-day format. Refer to table 1 for specific dates, storm classifications, and storm locations proximate to East Timbalier Island.
Barrier Island Landforms
Barrier islands and back-barrier marshes are highly erodible sand-dune systems, of which many important landforms in many coastal areas—including in the Gulf of Mexico—are composed. Typically comprising flat areas of sand formed by wave and tidal action parallel to the mainland coast, barrier islands usually develop in chains that consist of anywhere from a few islands to more than a dozen and can stretch for hundreds of kilometers (List and others, 1994).
Barrier islands are critically important for protecting coastlines from potentially devastating ocean wave action, including swells and storms. Barrier islands are also critical for forming and preserving coastal wetland ecosystems such as lagoons, estuaries, and marshes. Without barrier islands, ecologically rich coastal wetland ecosystems might not exist (Merino and others, 2011). Barrier islands and their complex ecological functions are related to feedback loops among sediment supply (lithosphere), hydrology, the atmosphere, and ecology (biosphere). This recent view represents a departure from the traditional view of barrier islands resulting from variations in the sea level, sediment supply, and accommodation space (Barrineau and others, 2015).
The structure, length, and width of barriers and the overall morphology of barrier coasts are usually related to natural parameters such as tidal range, wave energy, sediment supply, and sea-level trends (Merino and others, 2011). However, barrier island absolute location is subject to gradual migration caused by natural forces. Historical bathymetric and shoreline data show that Bayou Lafourche eroded about 3 km since 1880 (List, 2004), and East Timbalier Island moved north at about 21 m per year since 1900 (McBride and others, 1992).
East Timbalier Island was subject to natural changes and anthropogenic influences; the latter were expected to reinforce coastal stability but effectively altered natural flows and currents. These natural and anthropogenic changes include the development of the overall oil and gas industry in the area; other coastal protection structures, such as levees and seawalls; sea-level rise; and land subsidence, all of which changed currents and flow patterns to effectively “starve” East Timbalier Island of needed sediment replacement (Solomon and others, 2007). In addition, because of the oil and gas facility established on the Island in the 1950s, several efforts were made to stabilize the Island, thereby protecting the oil and gas infrastructure (Thomas and others, 2011). These efforts, along with the effects of coastline stabilization projects, altered the sediment profile of East Timbalier Island.
Data and Methods
A search of commercial, government, and private sources of aerial photographic and cartographic records was undertaken to locate historical sources of photograph and map coverage of Timbalier and Terrebonne Bays along the southern coast of Louisiana. These data sources include the USGS, NOAA, the State of Louisiana, the National Archives and Records Administration, the U.S. Department of Agriculture, and the commercial mapping companies discussed in this report. Over 100 images were analyzed to determine the most suitable dates and data parameters for representing the conditions at the Island. The records accessed include written descriptions, graphic footprints, thumbnail images, aerial film negatives, film positives, and paper prints. Many coastal images were acquired at a relatively large scale, meaning that many images were needed to cover small geographic areas like East Timbalier Island.
When doing this type of research, requestors must search the available records and select the most suitable imagery frames. The selected records are then submitted to a photographic laboratory for reproduction or scanned for transformation into a digital product. Imagery and metadata sources include the date and time of acquisition, the camera and lens numbers, calibration reports (when available), the scale, the film or sensor type, and the flight direction. Appendixes 1–6 (see table 2) list the film, sources, and metadata for all imagery of acceptable scale and resolution that were acquired for this project. The formal metadata for other historical records used in this project can be found in Slonecker and others (2020).
Table 2.
List of appendixes in this report and the information types contained in these appendixes. The data in these appendixes are also available in Slonecker and others (2020).| Report section | Title | Appendix content |
|---|---|---|
| Appendix 1 | High-Resolution Imagery for East Timbalier Island, 1953–2021 | Figures 1.1–1.27 |
| Appendix 2 | Historical Imagery Data | Table 2.1 |
| Appendix 3 | Global Fiducials Library Imagery Dates | Table 3.1 |
| Appendix 4 | DigitalGlobe Satellite Imagery Data | Table 4.1 |
| 1Appendix 5 | Landsat Satellite Imagery Data | Table 5.1 |
| 1Appendix 6 | Sentinel–2 Imagery Data | Table 6.1 |
All images in this appendix are available on the U.S. Geological Survey (USGS) EarthExplorer website (USGS, 2021).
When possible, the imagery was acquired as, or processed into, an orthorectified or geo-rectified format so that the cartographic qualities would be present to enable the accurate and consistent measurement of size, shape, distance, direction, and area. Tide levels were not assessed in the imagery due to the lack of metadata in earlier imagery (1950–1970). Currently, the tidal range is about 0.32 m, which may affect the amount of sand exposed on shallow, low-slope sand bars at low tide (NOAA, 2021). There are several sources of aerial-photograph data in appendix 2 where this “orthorectification” was computed via automated methods derived by inertial navigation system and Global Positioning System data input. These images were initially provided by the original source program and later retrieved using online sources such as the USGS EarthExplorer website (USGS, 2021).
Several earlier aerial photographic missions that covered East Timbalier Island were not processed to correct the inherent cartographic distortions and exist as raw aerial photographs only. These images were scanned into a digital format and manually georegistered based on previous corrected data sources and key landscape “feature-identifiable control points” chosen by a trained imagery analyst. Because of the dynamic and changing landscape of East Timbalier Island, however, the accurate correction of some data was neither possible nor corrected to U.S. National Map Accuracy Standards (USGS, 1999). The oil and gas infrastructure that existed on the Island from the 1950s to the present (2021) allowed some cartographic control to be observable by way of small buildings and pipelines on the remnants of the Island, which greatly enabled the georectification of imagery of East Timbalier Island.
Historical declassified images from U.S. intelligence systems are also included in this list (app. 2). These U.S. National Imaging Systems (USNIS) images, which came from the Nation’s first photoreconnaissance satellites and included CORONA- and HEXAGON-series satellites, provided additional timestamps for changes in Timbalier Bay. Images from the CORONA program were declassified and released to the public in February 1995 (National Reconnaissance Office, 1995), and more information about the CORONA program can be found in Ruffner (1995). The HEXAGON suite of reconnaissance satellites was the last to use film, and selected images, which were declassified in 2011, are available online at the USGS Earth Resources Observation and Science Archive—Declassified Data—Declassified Satellite Imagery—3 (https://www.usgs.gov/centers/eros/science/usgs-eros-archive-declassified-data-declassified-satellite-imagery-3?qt-science_center_objects=0#qt-science_ center_objects). The 0.61–1.22 m (2–4 foot) resolution of these images was extraordinary for satellites at that time.
Global Fiducials Library Imagery
The Global Fiducials Library (GFL) is a long-term archive of images from USNIS representing a long-term, periodic record for selected, scientifically important sites (https://www.usgs.gov/global-fiducials-library-data-access-portal), one of which is East Timbalier Island. The GFL was created to be the collection, archive, and data-management component of the Global Fiducials Program (GFP). The GFP (Baker and Zall, 2020) is a collaborative effort between Federal civil agencies, academia, and the intelligence community. At the time of its founding, the principal goal of the GFP was to build and maintain a long-term record of data to support scientists and policymakers involved in the GFP collaborative effort. The hope was that at some point—perhaps as much as 25 years into the future—the acquired data could be openly released to support future scientists and policymakers.
Since the early 1990s, the GFP has periodically collected images of environmentally important sites around the world. The GFL, which is the archive that maintains this long-term imagery record, is managed by the USGS under the National Civil Applications Center (NCAC) in partnership with the Civil Applications Committee. The GFL archive is dedicated to ensuring that the images are collected, maintained, and made available to scientists and policymakers to support scientific investigations into global dynamic systems and change. Since 2009, a goal of the GFP has been to systematically make parts of this extensive collection publicly available. This goal is accomplished through the creation of unrestricted imagery-derived products, which provide valuable, select imagery to the public. Several collections of aerial and satellite imagery were used to document the status and extent of East Timbalier Island. See the descriptions of appendixes 1–6 in table 2 of this report for examples of this information.
The GFL imagery in this report has been collected over East Timbalier Island since 1991 (app. 3). The purpose of collecting GFL data over East Timbalier Island was to monitor the extensive changes occurring there and maintain a detailed record of these changes. The environment of Timbalier Bay (fig. 2) and the barrier islands off the coast of south-central Louisiana constantly change. The GFL data provide insight through which scientists can observe, monitor, and measure the natural processes affecting the Island. The effects of those processes and their relation to human activity are provided through GFL data. The dates for GFL imagery used in this study are provided in appendix 3. GFL image-data products were either orthorectified using a digital elevation model or rectified to a plane (like mean sea level) and georeferenced into the Universal Transverse Mercator (UTM) projection. In most cases, the ground sample distance (GSD), or pixel size representation, is 1 meter. The area of interest for the individual GFL sites is a box that encompasses the site, which may cover anywhere from 2 km2 to 1,000 km2. The GFL imagery products may consist of one image or multiple images merged into a single-image mosaic, which is contained within that area-of-interest box. Each product is normally ascribed to a single date.
Commercial Satellite Imagery
Since the start of the new millennium, commercial satellite imagery has become available for more areas of the world. Many high-resolution images of East Timbalier Island are available. The NextView EULA_5749 end-user license agreement provides access to DigitalGlobe products (https://evwhs.digitalglobe.com/myDigitalGlobe/login) for the U.S. Government and its mission partners (National Geospatial Intelligence Agency, 2017). The DigitalGlobe imagery archive has a search tool for finding and viewing images at https://tidesandcurrents.noaa.gov/map/index.html?region=Louisiana. Images of the remote area surrounding Timbalier Bay have traditionally been acquired by U.S. Government aerial photography and the USNIS satellite imagery described in the previous section. The new high-resolution commercial satellite systems can also provide a frequent look at isolated locations and enable accurate monitoring and mapping of dynamic landscapes. Although commercial imagery was not used for quantitative analysis in this study, it does provide an additional resource for further investigations into this dynamic coastal environment.
The DigitalGlobe2 archive contains high-resolution (approximately 50 centimeters GSD) imagery over East Timbalier Island from September 2004 through September 2021 for 65 dates (app. 4). The imagery was collected from the GeoEye–1, QuickBird–1 and –2, and WorldView–1, –2, and –3 satellite systems and provides a wide area of coverage that enables the detailed analysis of features from high-resolution data. The collection frequency allows changes to the landscape to be detected and verified, which provides an effective set of additional imagery datasets to supplement periods that may be missing from GFL scheduled collections. The most recent satellite image over the study site was collected by WorldView–2 on September 4, 2021.
DigitalGlobe was acquired by Maxar Technologies in 2017.
Landsat and Sentinel–2 Satellite Imagery
The jointly operated (NASA and USGS) Landsat satellite program has, since 1972, acquired over 1,200 images of East Timbalier Island that are at least partly clear of cloud cover. The average interval between coverage is about 18 days, weather permitting, with the resolution ranging from 60 m to 15 m. Landsat imagery provided a wealth of data about the Island, including nearshore bathymetry, vegetation classification, and soil moisture. To support the current research project, over 135 images acquired between 1972 and 2021 (app. 5) were used to create a time series to track changes in the size, shape, and position of East Timbalier Island and adjacent areas. By displaying the imagery in a rapid sequence (two frames per second), it is possible to detect, visualize, and track large-scale patterns of change to the Island and adjacent areas.
In addition to providing the longest available high-fidelity time series of multispectral images, Landsat also afforded unique insights by imaging areas of Timbalier Bay adjacent to Timbalier Island. The time-series images of the bay show land loss caused by both subsidence and erosion and by changes to the size of the islands adjacent to East Timbalier Island. Most importantly, the Landsat images give direct evidence that the changes affecting East Timbalier Island also affected adjacent areas to the east (the west end of Port Fourchon) and the west (the east end of Timbalier Island). The images also show that changes to these areas have accelerated since 2018 as East Timbalier Island decreased in size.
Satellite imagery from Sentinel–2, operated by the European Space Agency, supplemented other coverage. Over 250 Sentinel–2 images that are at least partly cloud-free are available for 2015–2021. Twenty-six clear Sentinel–2 images (app. 6), taken at approximately 3-month intervals since 2015, were used to provide a seasonal perspective and augment the Landsat coverage. The Sentinel–2 images have a higher revisit rate (sometimes as short as every 3–5 days) and higher resolution (20–10 m) than Landsat. Sentinel–2 imagery is an excellent gap-filler that provided initial information on significant changes, such as washover and thinning, that were more precisely documented with GFL and other higher resolution imagery.
Results and Discussion
Area Calculations and Cross-Sectional Measurements
Table 3 lists area measurements for selected dates of imagery from over East Timbalier Island. The NCAC created vector shorelines for selected images using manual digitizing techniques. Digitizing was done by the lead author using the commercially available Socet GXP geospatial intelligence software.3 The purpose was to obtain a precise outline of the Island that followed the shoreline identified in the imagery. A consistent method for selecting images with like resolution and clarity was used to distinguish dry land from the surrounding water. Tidal effects on the imagery were considered and most likely influenced the visible location of the shoreline for selected dates, especially in areas of transitional sediment along the spits of land on the extreme east and west ends of the Island.
SOCET GXP is geospatial intelligence software created by BAE Systems.
Calculations of vector files were performed using commercial geographic information system (GIS) software (ArcGIS4 ) to determine the aerial extent for all polygons created for each image date. The results were entered into a spreadsheet to provide a consolidated report of area changes for each date. These area measurements are a clear representation of the aerial extent of the Island for the selected observation dates. The purpose of creating these vector shoreline datasets was to provide an accurate assessment of the spatial changes that occurred on the Island between the 1953 aerial photograph and the 2020 National Oceanic and Atmospheric Administration Emergency Response Imagery (NOAA–ERI) (table 3).
ArcGIS is a geographic information system software suite created by the Esri company.
Cross-sectional transects were measured across the axis of the Island using GFL data from 2011 through 2020. This period was selected to characterize changes that occurred since the previous study, by Thomas and others (2011), which used transects from 2001 to 2010. The movement of the Island before 2000 was so extensive that it is difficult to correlate precise locations on the landscape in newer imagery with that in images from before 2000. Transect lines were spaced at 100-m intervals, starting at the western end of the Island as it existed in September 2011 (fig. 4). The transect lines were measured diagonally across the Island, to include any land areas crossed, for determining the width of the Island for selected dates using available imagery from 2011 to 2020. Figure 5 is a graph showing the continual thinning of the Island as it eroded from 2011 to 2020. A few anomalies occurred during this period, most notably for 2017, 2018, and early 2020; however, the general trend is the extensive thinning of the Island over the past decade. The precise measurements for the data points used to calculate the mean and median distance for the transect lines in figure 5 are provided in table 4.
Table 3.
Area calculations of East Timbalier Island, Louisiana, based on specified image source.[B/W, black and white; CIR, color infrared image; DOQ, digital orthophoto quadrangle; GFL, Global Fiducials Library; NAPP, National Aerial Photography Program; NASA, National Aeronautics and Space Administration; NHAP, National High Altitude Photography program; NOAA–ERI, National Oceanic and Atmospheric Administration—Emergency Response Imagery; m2, square meter; m2/yr., square meters per year; USGS, U.S. Geological Survey; VNIR, visible and near-infrared; WV–3, DigitalGlobe WorldView–3; —, unavailable]
Table 4.
Transect measurement lines (fig. 4), in meters, for width of East Timbalier Island using shoreline data, Louisiana, 2011–2021.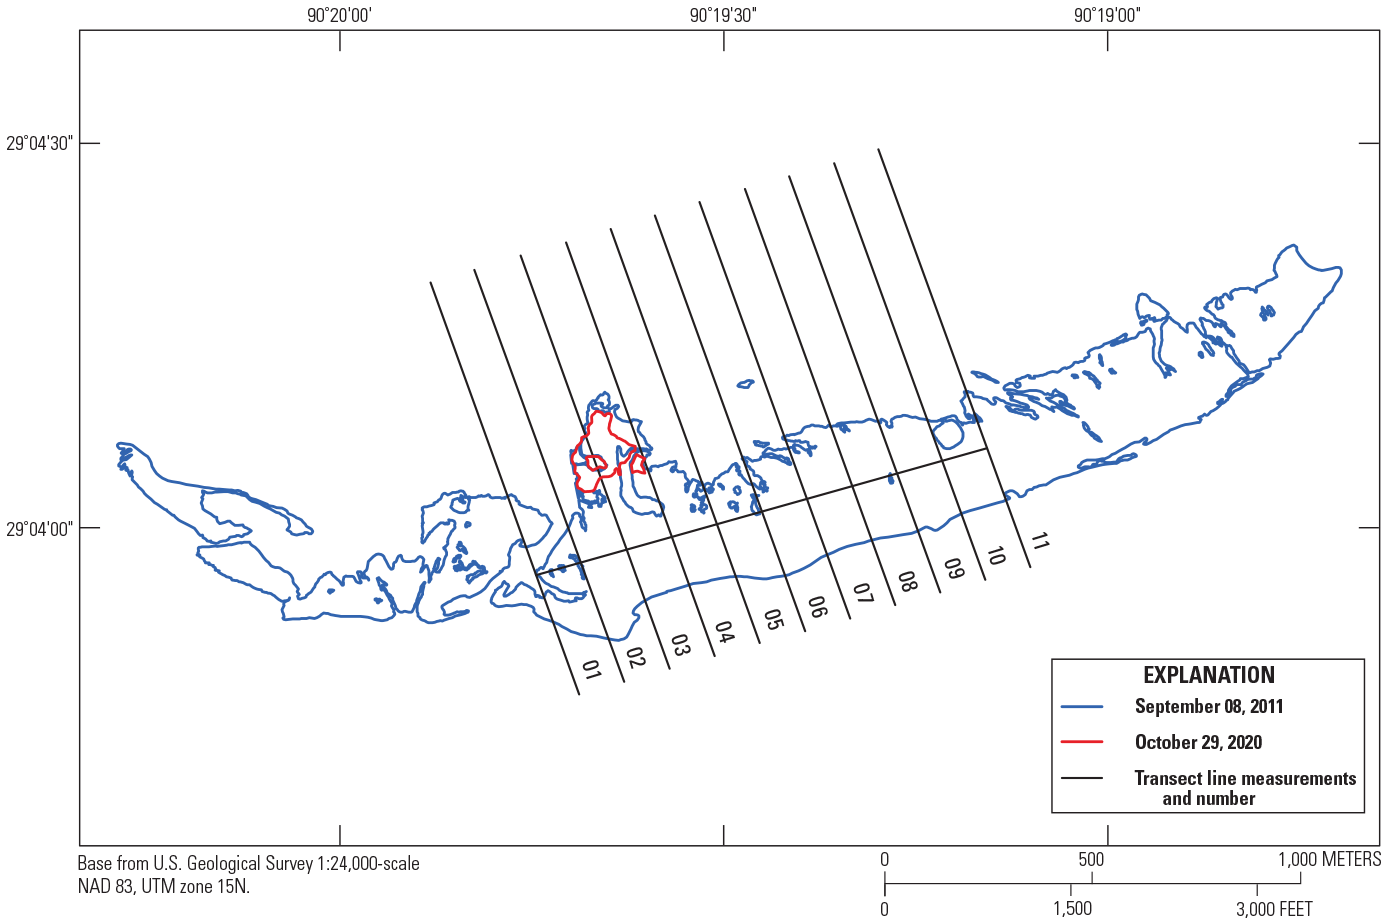
Map showing transect locations on East Timbalier Island, Louisiana, as it existed on September 8, 2011, and October 29, 2020. NAD 83, North American Datum of 1983; UTM zone 15N, Universal Transverse Mercator zone 15 north.
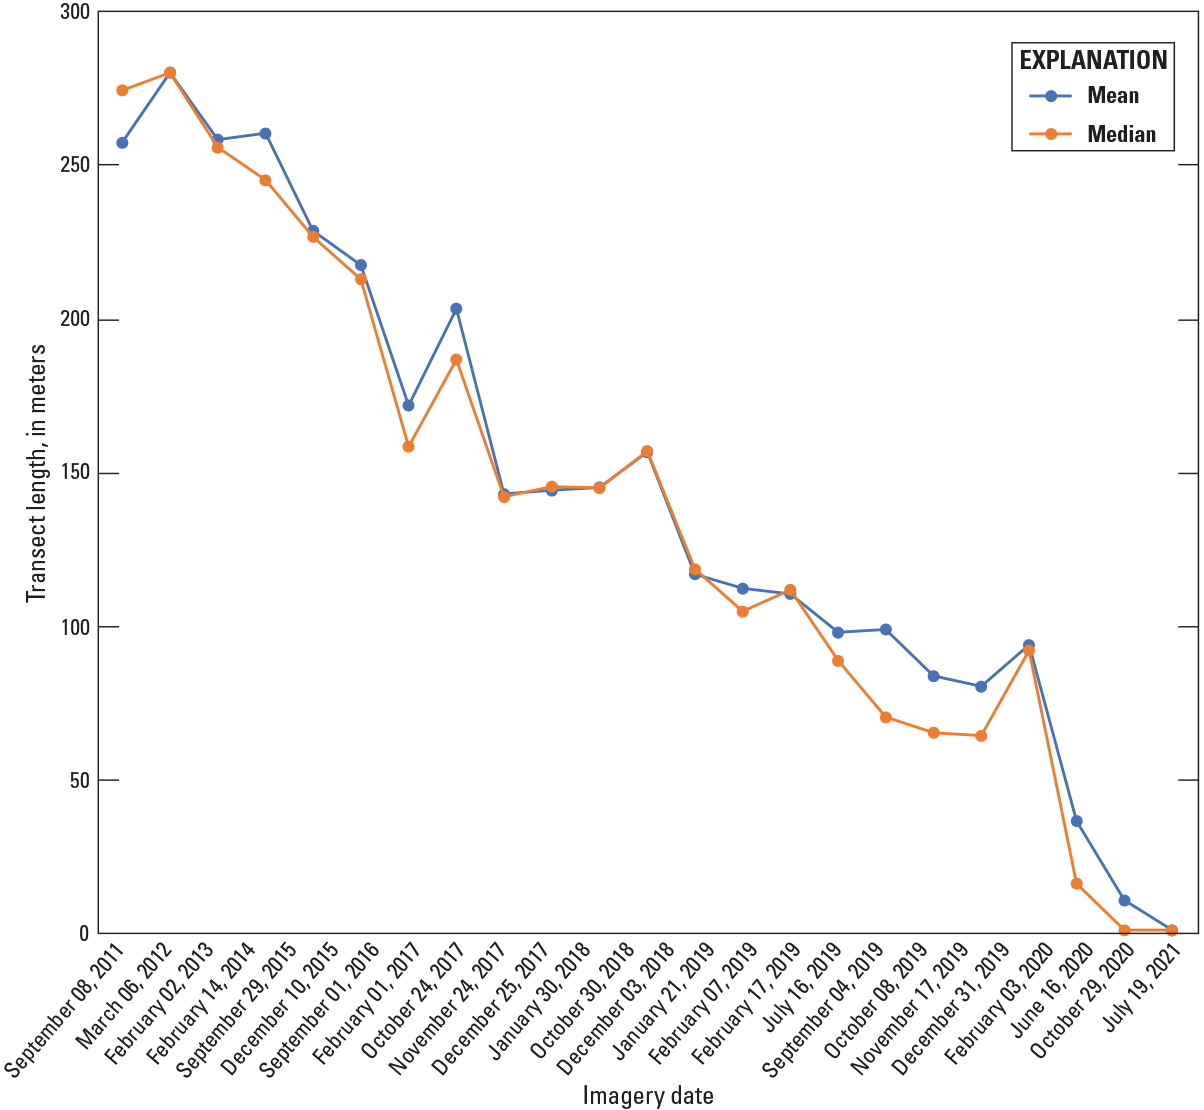
Line graph showing East Timbalier Island, Louisiana, cross-section transect measurements, in meters, for images on selected dates, from September 08, 2011, to July 19, 2021.
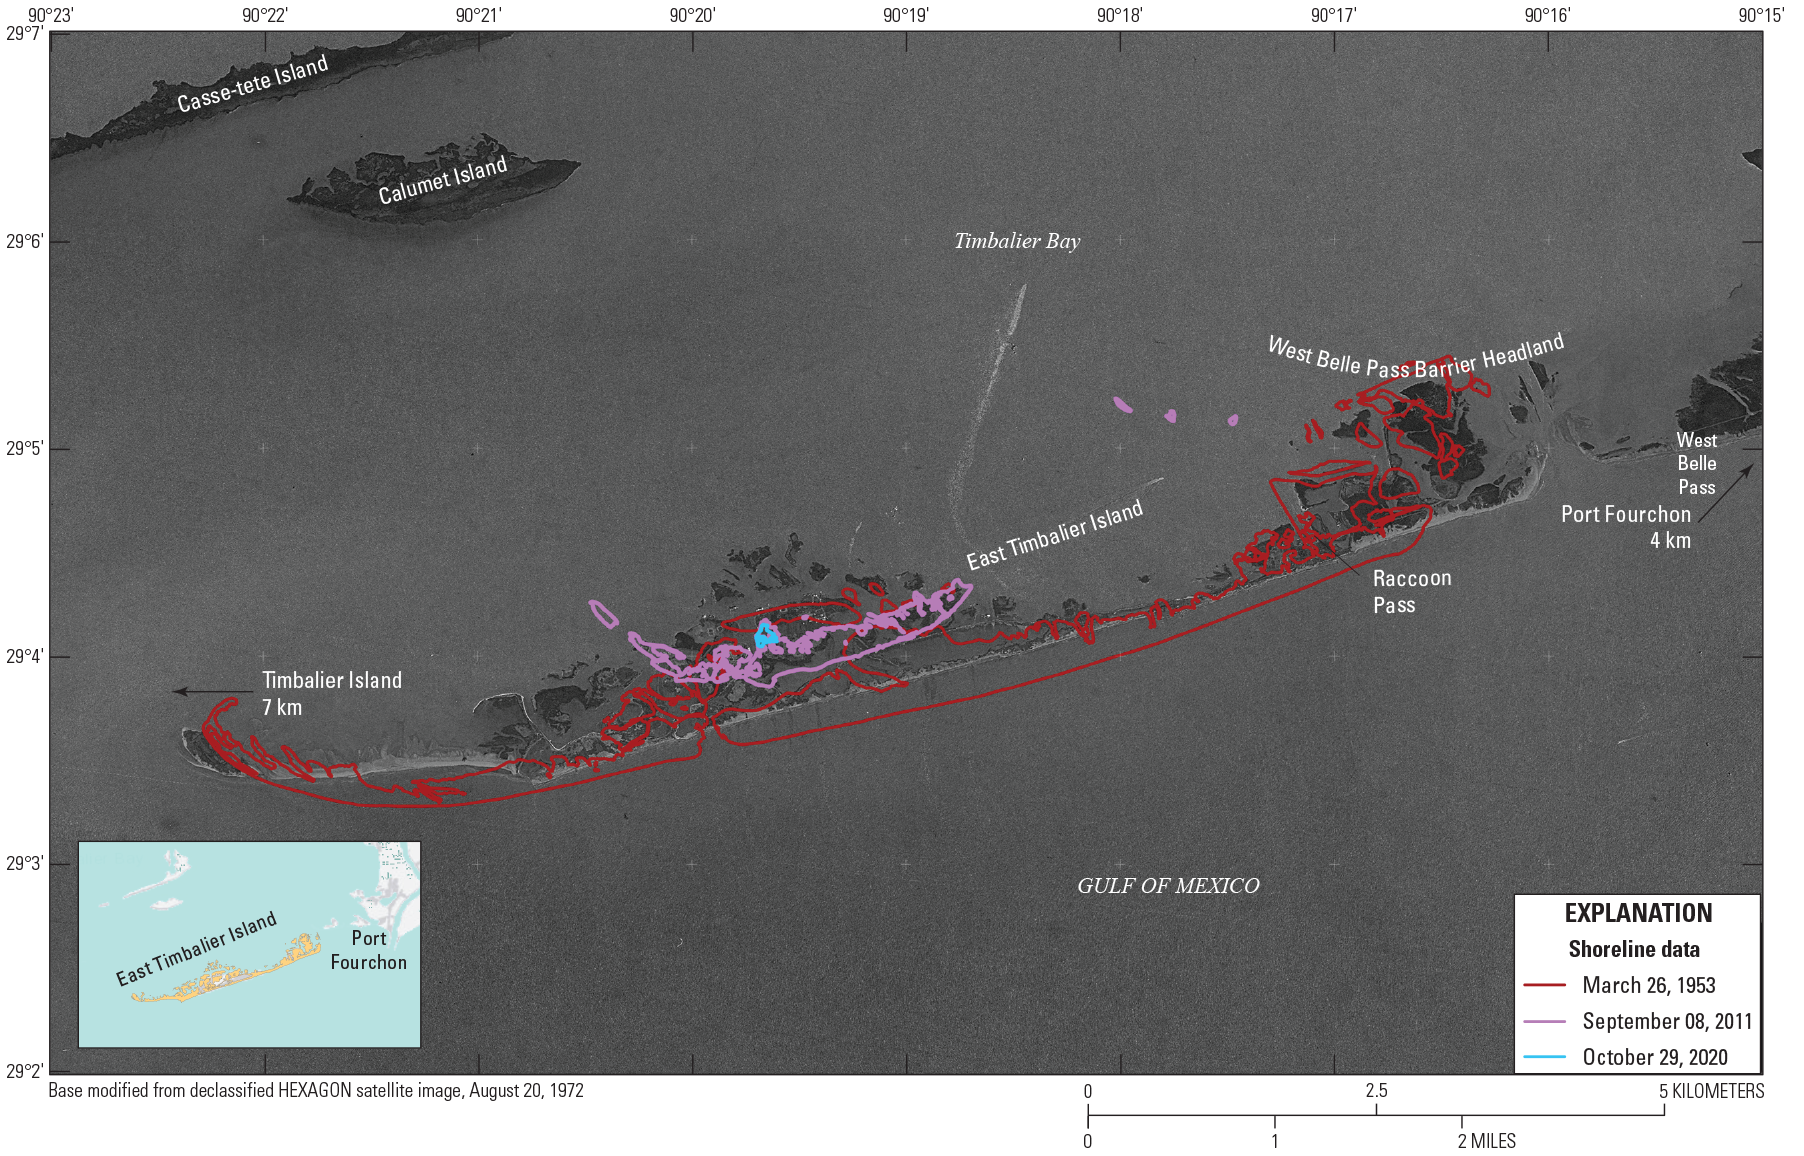
Map showing shorelines of East Timbalier Island, Louisiana, for the years 1953, 2011, and 2020. km, kilometer.
Migration of East Timbalier Island
The spatial composition of East Timbalier Island has drastically changed over the past 68 years. During most of this period, the Island repeatedly changed in size (table 3) and broke into smaller segments. The layout of the Island in the 1950s consisted of large segments that formed an almost continuous barrier between the Gulf of Mexico and Timbalier Bay (figs. 2, 1.1, and 1.2). Over the years, these segments divided into smaller segments, which allowed energy from the Gulf of Mexico to reshape the Island and move its core location to different areas. The centroid location of the Island for each date of the available imagery was calculated from polygon-outline vector files digitized to show the extent of the Island and better understand its migration. Figure 6 shows the outline of the Island, using shoreline vector data, for three selected dates (in 1953, 2011, and 2020) calculated in this study.
Each centroid point represents the geographic center of the Island based on the distance of the surrounding shoreline to the center of the Island. Where the Island is segmented, the polygon-outline vector files from the same date were merged to provide a contiguous outline of the Island. The geographic centroid could then be calculated using GIS software. These centroid points were plotted on an image map of the Island (fig. 7) to display the Island center location based on the dates for the imagery used in this report. Table 5 shows the geographic locations for each of these points. Table 6 lists the image dates and the distance that the Island centroid migrated between the two listed, consecutive dates. The mean distance for migration between dates is 155.6 m, which explains the frequent changes to the Island in size and location.
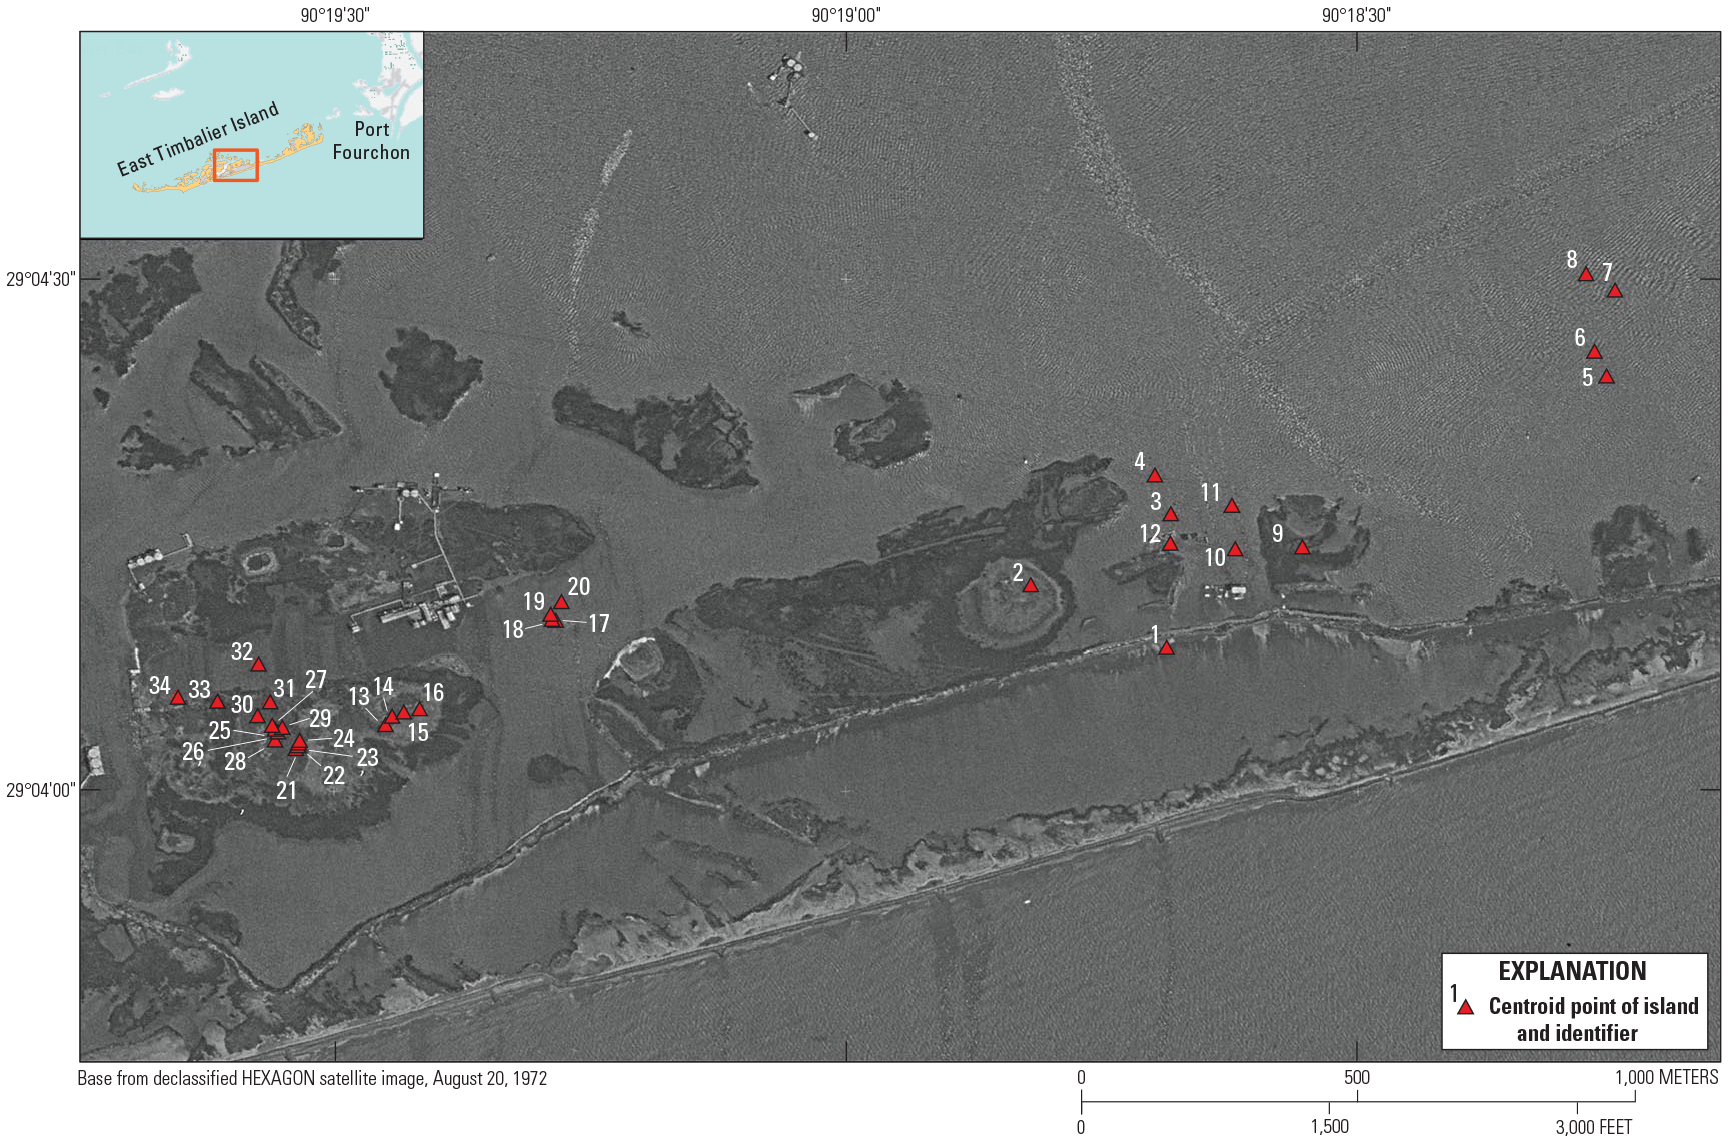
Map of East Timbalier Island, Louisiana, showing point identification numbers and locations of centroid points. Centroid point identification numbers and geographic coordinates are listed in tables 5 and 6.
Table 5.
Point identification numbers and geographic coordinate locations of centroid points for East Timbalier Island, Louisiana. Point identification numbers and locations are shown in figure 7.[Coordinate data in this table use decimal format due to the high precision of the image sources, therefore these data must be converted to the degree, minutes, and seconds coordinate format for correlation with figure 7]
Table 6.
Image dates and point identification numbers alongside associated migration distances and directions for centroid points of East Timbalier Island, Louisiana, 1953–2020. Point identification numbers are shown on figure 7.[E, east; N, north; NA, not applicable; S, south; W, west]
Changes in Morphology and Migration
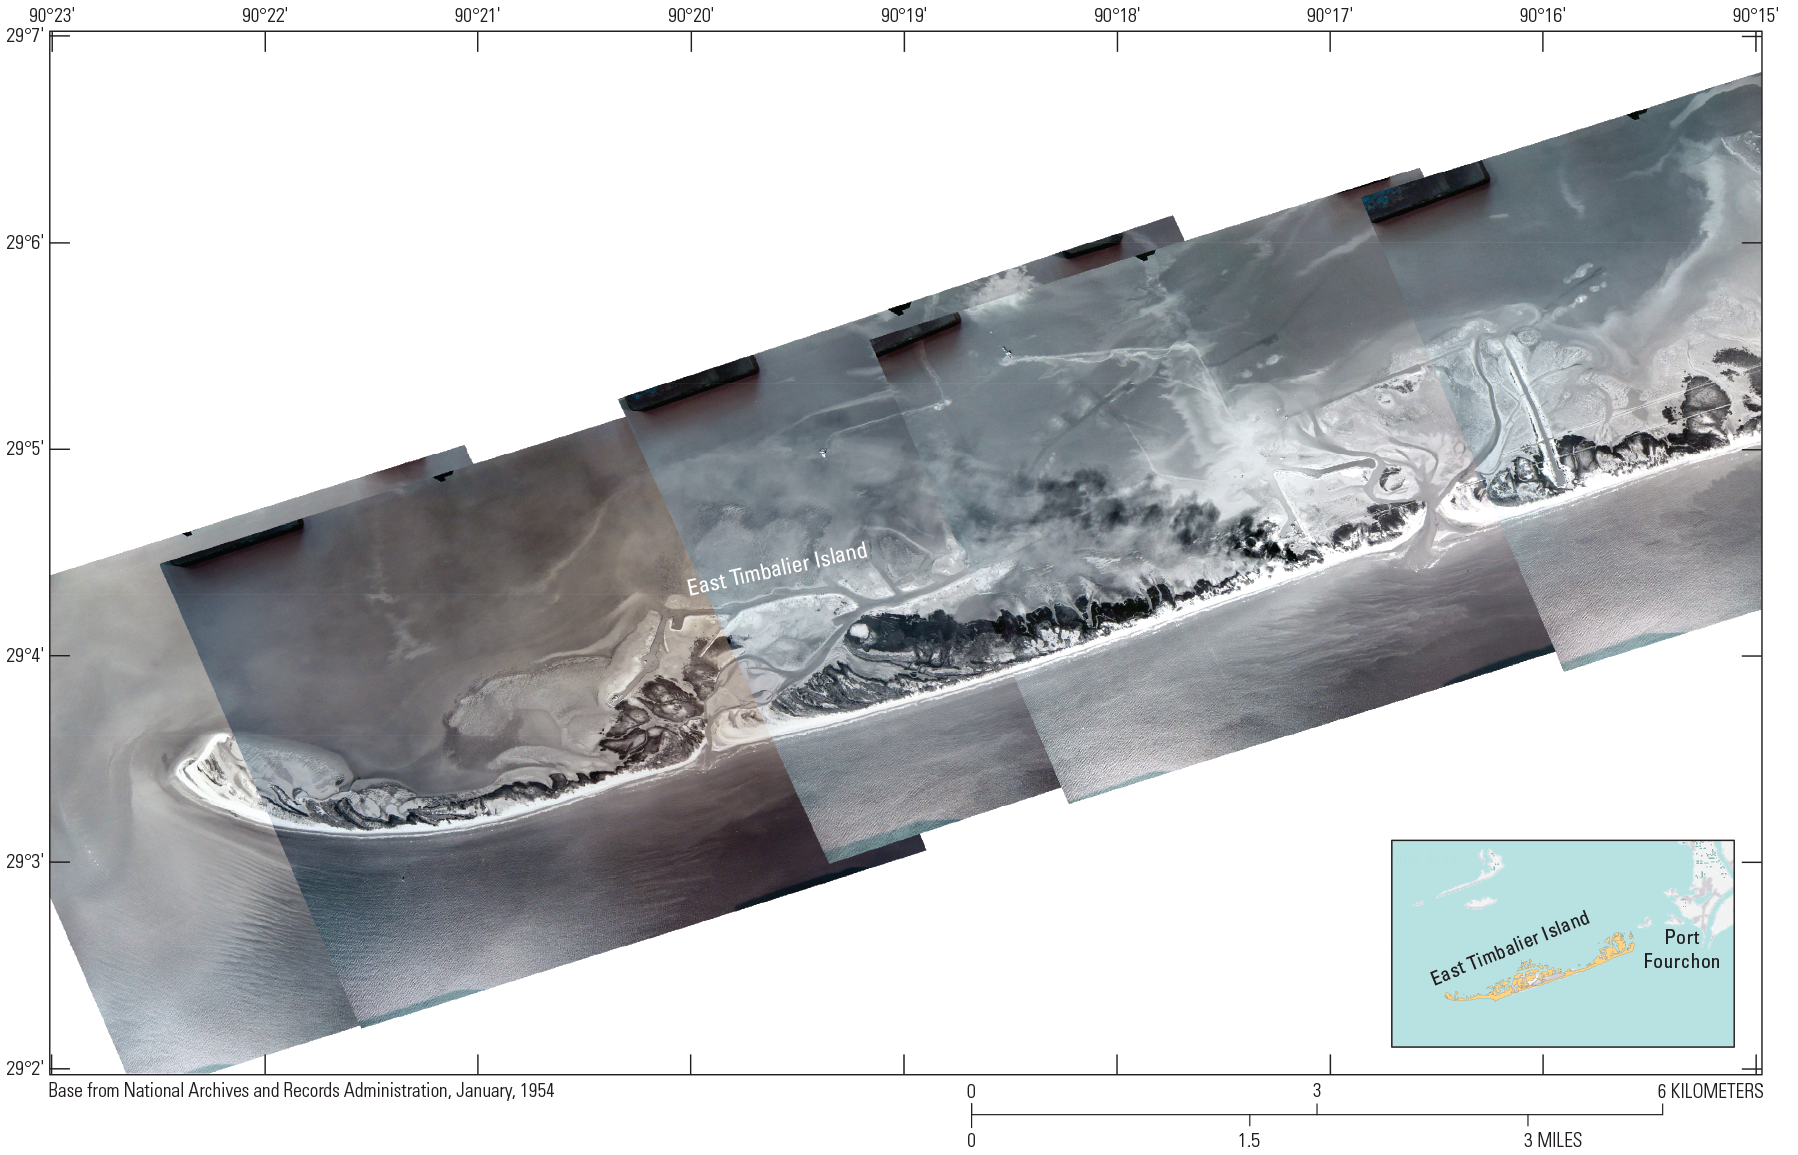
Calculations from the vector polygons in table 3 show that through mid-2020, the Island lost 95 percent of its land since measurements were first made using aerial photography in 1953. The dynamics of the Island are apparent, as it morphed in size and location over time. In 1953, the Island was over 4.3 million m2. During the near seven decades of aerial observation after 1953, the Island underwent several stages of short-term growth and accelerated land loss. These changes are shown in the shoreline-outline graphics in figure 6. In 1954, the Island grew by 54 percent, possibly due to dredging fill for the oil and gas infrastructure. The difference in the size of the Island between 1953 and 1954 may also be attributed to tidal effects on the two dates that the imagery was collected. After 1954, the Island rapidly lost area across three decades until the Coastal Wetlands Planning, Protection and Restoration Act (CWPPRA) restoration efforts in the late 1990s rebuilt large sections of the Island (Louisiana Coastal Wetlands Conservation and Restoration Task Force, 2002). Since 2011, the Island has undergone several phases of short-term growth followed by rapid land loss, which is evinced by the large areas of sand and sediment surrounding the Island that frequently reform as sandbars and overwash areas on the Island.
The transect measurements shown in figure 5 indicate a decline in the width of the Island from 2011 to 2020. This trend correlates well with the area measurements in table 3 and shows a continual loss of size, excepting outliers in 2012, 2017, and 2020. These outliers may be partly attributed to tidal effects in the imagery or the redistribution of sediment along the backshore of the Island. The small sample size for the transects can be reliably represented by showing the median of the measurements. The median of the data (table 4) confirms the trend of land loss shown in the width of the Island, even when the outliers from 2012, 2017, and 2020 are included (fig. 5).
East Timbalier Island has changed continuously since aerial photographs were taken in the 1950s. The Island morphed in shape and size over the years, as illustrated in figure 6, and finally disappeared by early summer 2021. In 1953, the size of the Island was 4.3 million m2; in February 2020, it measured 186,210 m2. Across the period of the study, the size of the Island changed greatly over short intervals. Between 1953 and 1954, the Island grew 54 percent, from 4.3 million m2 to 6.6 million m2 (table 3). Much of the oil and gas infrastructure on the Island was under initial construction during this time. In 1954, the Gulf Oil Corporation constructed a dirt levee (between 2.4 and 6 m high) on the crest of East Timbalier Island, several hundred meters landward of the shoreline. This dirt became a sediment source that helped enlarge the Island in 1954 (van Beek and Meyer-Arendt, 1982). The redistribution of this sediment helped increase the Island’s size.
The period between 1954 and 1989, however, saw a continual decrease in the size of the Island for each year that high-resolution aerial photography was available (app. 1). Several large storms also passed close to the Island during this time, which may have contributed to erosion and substantial land loss (table 1). Hurricane Flossy (Sep 24, 1956), Hurricane Betsy (September 10, 1965), Hurricane Carmen (September 8, 1974), Hurricane Bob (July 11, 1979), and Tropical Storm Juan (Oct 31, 1985) all had major impacts on the environment around East Timbalier Island. During this time, several shoreline-remediation projects took place near or at the Island to protect the port facilities at Port Fourchon, east of the Island.
In 1945, the jetties protecting Bayou Lafourche at Belle Pass were extended 90 m. The jetties were again extended by 300 m in 1969 (Kulp and others, 2003). These jetties affected the nearshore sediment supply that flows along the Gulf Coast from east to west at Timbalier Bay. In 1964, a new jetty was constructed at Belle Pass, which further affected the sediment supply to East Timbalier Island. In September 1965, Hurricane Betsy, a Category 4 storm, passed only 12 km northeast of the Island and caused substantial erosion and changes to the morphology of the Island. Four groins were installed in 1966 on the central and western parts of the Island to repair the breaches that occurred after Hurricane Betsy (Penland and Suter, 1985). A rock seawall was also erected alongshore, parallel to the shoreline, connecting the groins. Sections of this rock seawall were still visible in the GFL imagery collected in the mid-1990s.
In 1974, 16 km of rock seawall revetment were installed at East Timbalier Island, including 30-m groins spaced every 60 m across the Island (Kramer, 2016). This effort significantly interrupted the sediment supply to the Island. The original dirt levee on the center of the Island was reinforced with stone to protect the bayside of the Island from northwesterly driven waves. In September 1974, Hurricane Carmen passed 65 km to the west of the Island and caused major overwash and breaches across the Island. Between August 1972 and October 1975, the Island lost 747,000 m2 of land or 18 percent of its land area (table 3). In 1980, several t-groins were added to the Gulf side of East Timbalier Island to protect the beach; however, these structures limited the sediment movement along the shoreline, resulting in a thinning of the Island. This installation considerably affected the shoreline’s ability to withstand major storm overwash (Westphal, 2008).
On August 26, 1992, Hurricane Andrew passed 60 km west of East Timbalier Island, causing substantial erosion and a breach in the Island at a narrow spot on the east-central side of the shoreline, which resulted in profound changes to the morphology of the Island. The newly separated “eastern” section of the Island quickly migrated to the northeast, while the orientation of the “western” section of the Island morphed into a northeast to southwest strike. Before this event, the strike of East Timbalier Island was oriented with the strike of West Belle Pass Barrier Headland—the peninsula east of East Timbalier Island—in a general east-to-west orientation.
By August 1995, the eastern section of East Timbalier Island had migrated almost 2,000 m from the western section of the Island. This section of the Island continued to migrate northeast at an accelerating rate until 2008, when this section of the Island nearly disappeared. This change was reflected by a 1.2-km westward shift in the Island centroid over this period (fig. 7; table 6) (Kulp and others, 2015).
The Louisiana Coastal Wetlands Conservation and Restoration Task Force provided funding (through CWPPRA) to restore East Timbalier Island via projects TE–25 and TE–30 from 1999 to 2000 (Louisiana Coastal Wetlands Conservation and Restoration Task Force, 2002). This restoration effort resulted in 2 million cubic meters of sediment dredged from nearby offshore areas being used to establish a 60-m-wide dune and a 180-m-wide marsh along the length of the Island (Byrnes and others, 2018). A 2,100-m-long rubble-mound revetment was also created to protect the shoreline of the Island. Project TE–25 funded the construction of 4,000 m of sand fences and the planting of 13,000 plugs of bitter panicum (Panicum amarum) and 6,500 plugs of marsh hay cordgrass (Spartina patens) along the Island’s dunes to minimize wind-induced erosion (Louisiana Coastal Wetlands Conservation and Restoration Task Force, 2002). However, the benefits of these extensive restoration efforts were short-lived. The 2005 hurricane season included some of the most destructive storms to ever hit the central Gulf Coast. Hurricanes Cindy, Katrina, and Rita all hit during 2005, resulting in a decrease of Island size by 15 percent between January 1998 and October 2005 (table 3). The 2008 hurricane season was another active period with two major storms passing close to East Timbalier Island: Tropical Storm Edouard and Hurricane Gustav. The land area of the Island decreased by 47 percent from October 2005 through September 2011 (table 3).
After 2010, the geomorphology of the Island changed at an accelerating rate (table 3). Several multi-year cycles of ocean-facing shore thinning, east-end erosion, breaching, and northward migration were identified. The latest cycle began in mid-2018 and continued into 2021. This cycle ended in 2021 with the disintegration of the Island into several small, elongated, northward-trending sand bars.
In 2011, the eastern and western ends of the Island began to migrate to the north, transforming the Island into a crescent shape. The tips of the east and west ends of the Island continued to grow and transform into narrow spits of land. By February 2014, the western spit had grown to over 1,800 m in length and then disappeared by September 2015. The eastern spit of land grew substantially from December 2015 to February 2017 and then disconnected from the main Island in October 2017. The growth and retreat in the size of this spit are reflected in the size-changes of the Island listed in table 3.
East Timbalier Island showed a 10-percent increase in growth when the image from February 14, 2014, was compared with the image from February 02, 2013 (table 3), and a 35 percent increase in growth was shown when the image from February 1, 2017, was compared with the image from September 01, 2016 (table 3). This growth correlates with the growth of the spits on either end of the Island during this period. Once the spits detached from the main Island, however, they quickly shrank. During a similar time period, 2011–2020, the width of the Island also grew and shrank relative to the periods of rapid growth and the disintegration of the spits. The mean width of the Island grew to 186 m by February 01, 2017 (table 4), which correlates with the increase in the size of the Island during that same period. Likewise, on January 30, 2018, the mean width of the Island was 143 m, having grown from 130 m in October 2017, which correlates with the increase in the size of the Island during that same period.
Hurricane Barry, which passed 69 km southwest of East Timbalier Island on July 13, 2019, was a relatively weak Category 1 hurricane but contributed to a 10-m change in the mean width of the Island between January 21, 2019, and July 16, 2019 (table 4). The change in the median width of the Island was over 40 m during this period. This substantial change in the width of East Timbalier Island demonstrates its vulnerability to coastal erosion and the rapid redistribution of sediment surrounding the Island.
The 2020–2021 hurricane seasons led to unprecedented tropical storm activity along the Louisiana coast. Five major storms struck the Louisiana coast in 2020, including three storms that heavily affected the Island. Tropical Storm Cristobal struck the Louisiana coast on June 7, 2020, passing 50 km east of East Timbalier Island and caused a land loss of 112,915 m2 (table 3). Tropical Storm Marco passed 23 km south of the Island on August 24, 2020, resulting in extensive shoreline erosion. Hurricane Zeta passed 17 km west of the Island on October 28, 2020, and submerged the Island, leaving a 14,530 m2 section of land near the oil infrastructure plant (fig. 1.24). By early 2021, this area was highly susceptible to erosion from tropical storms.
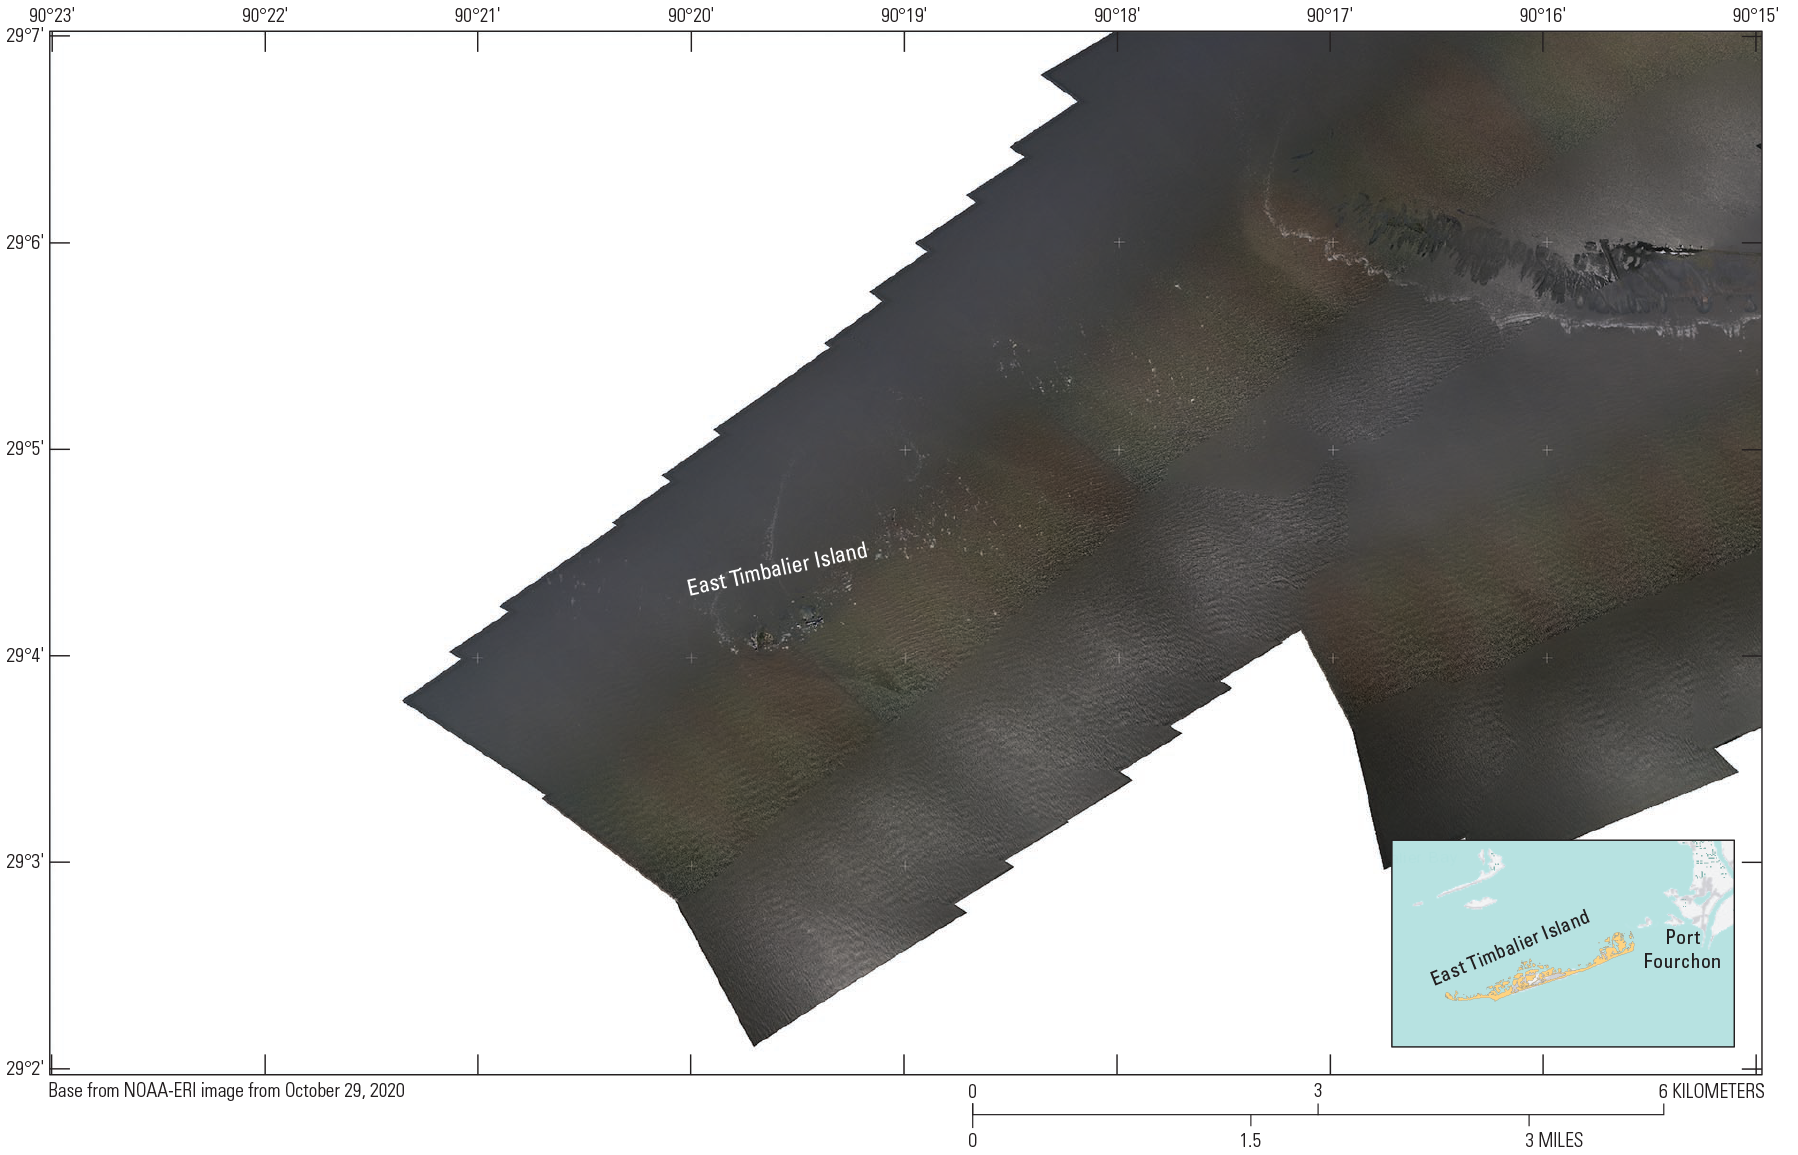
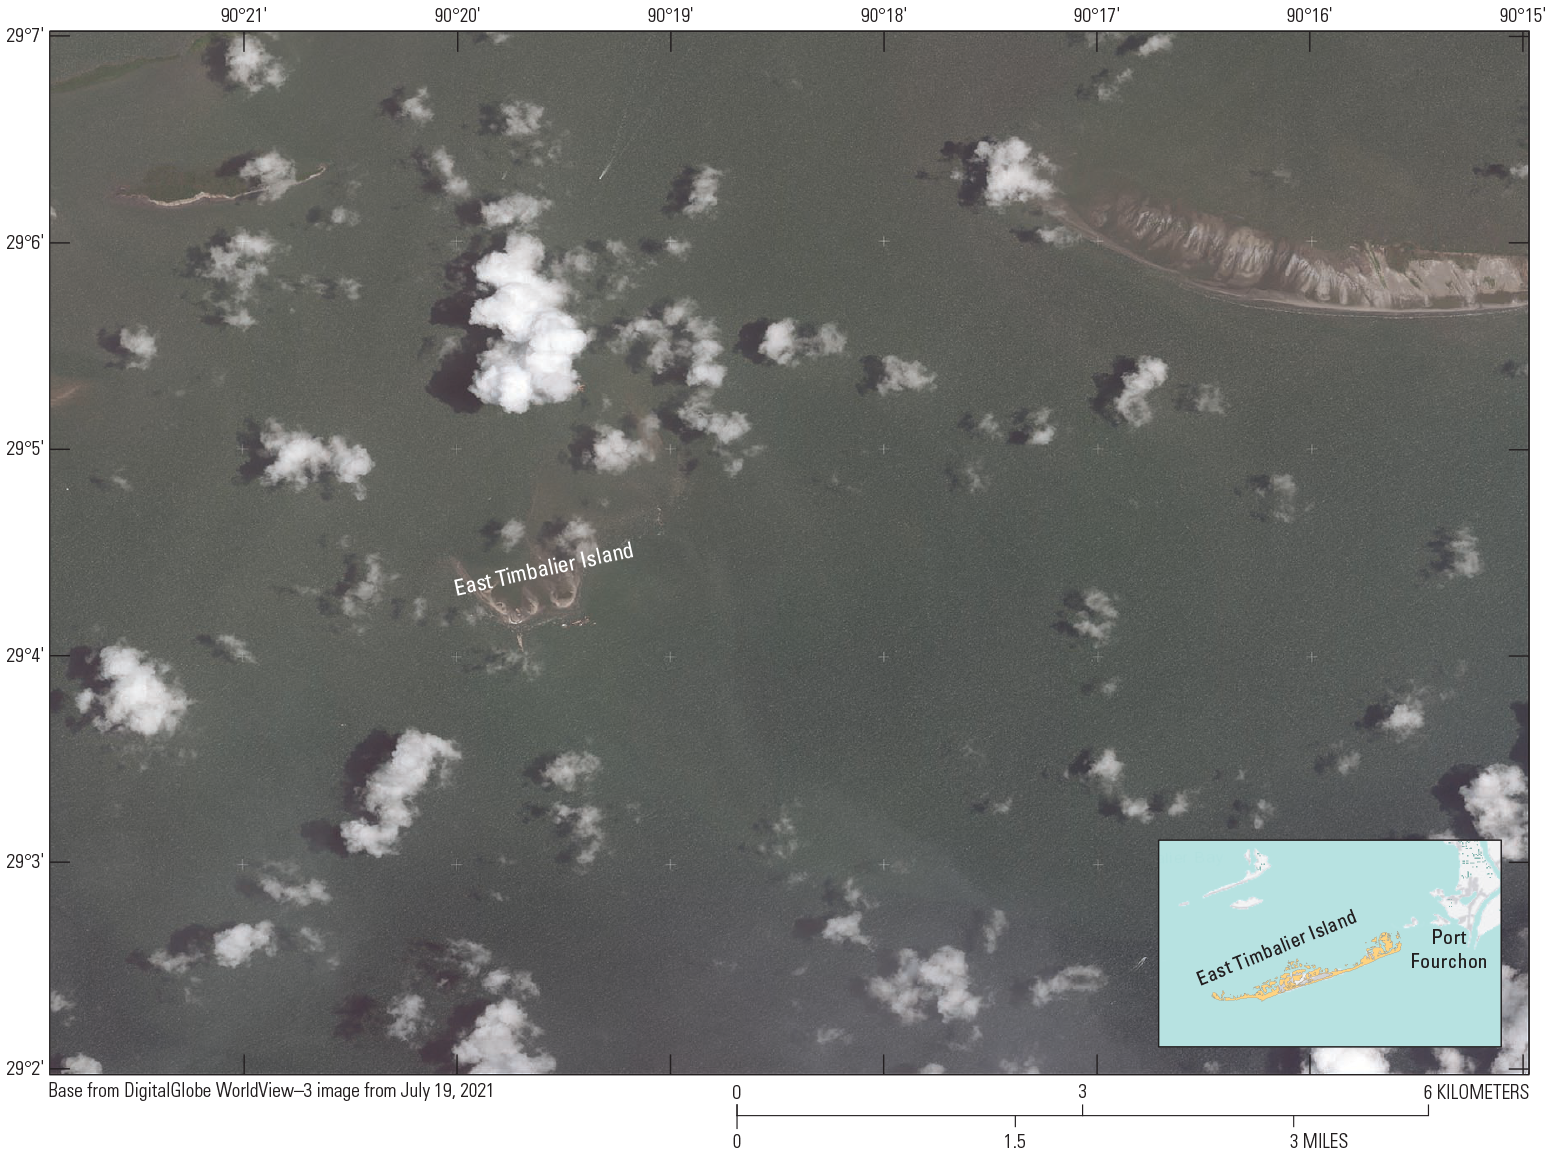
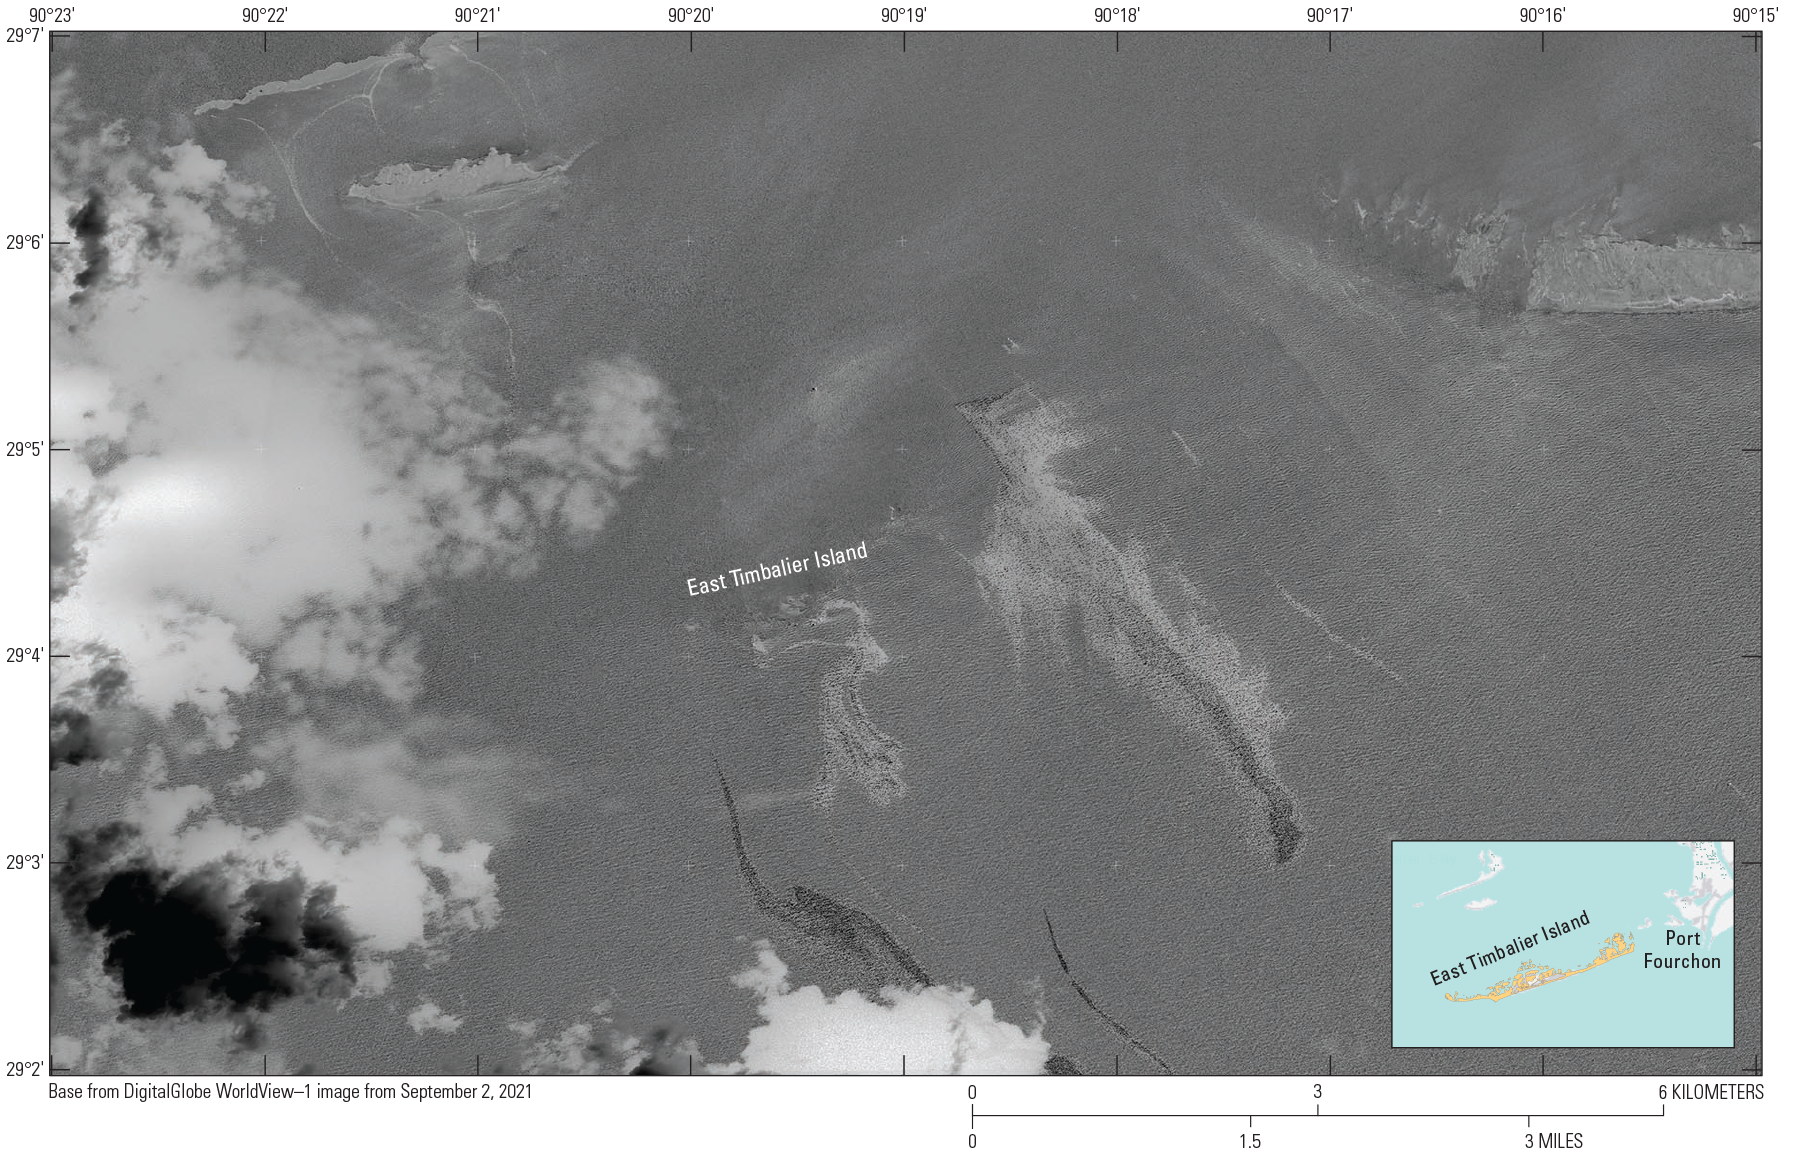
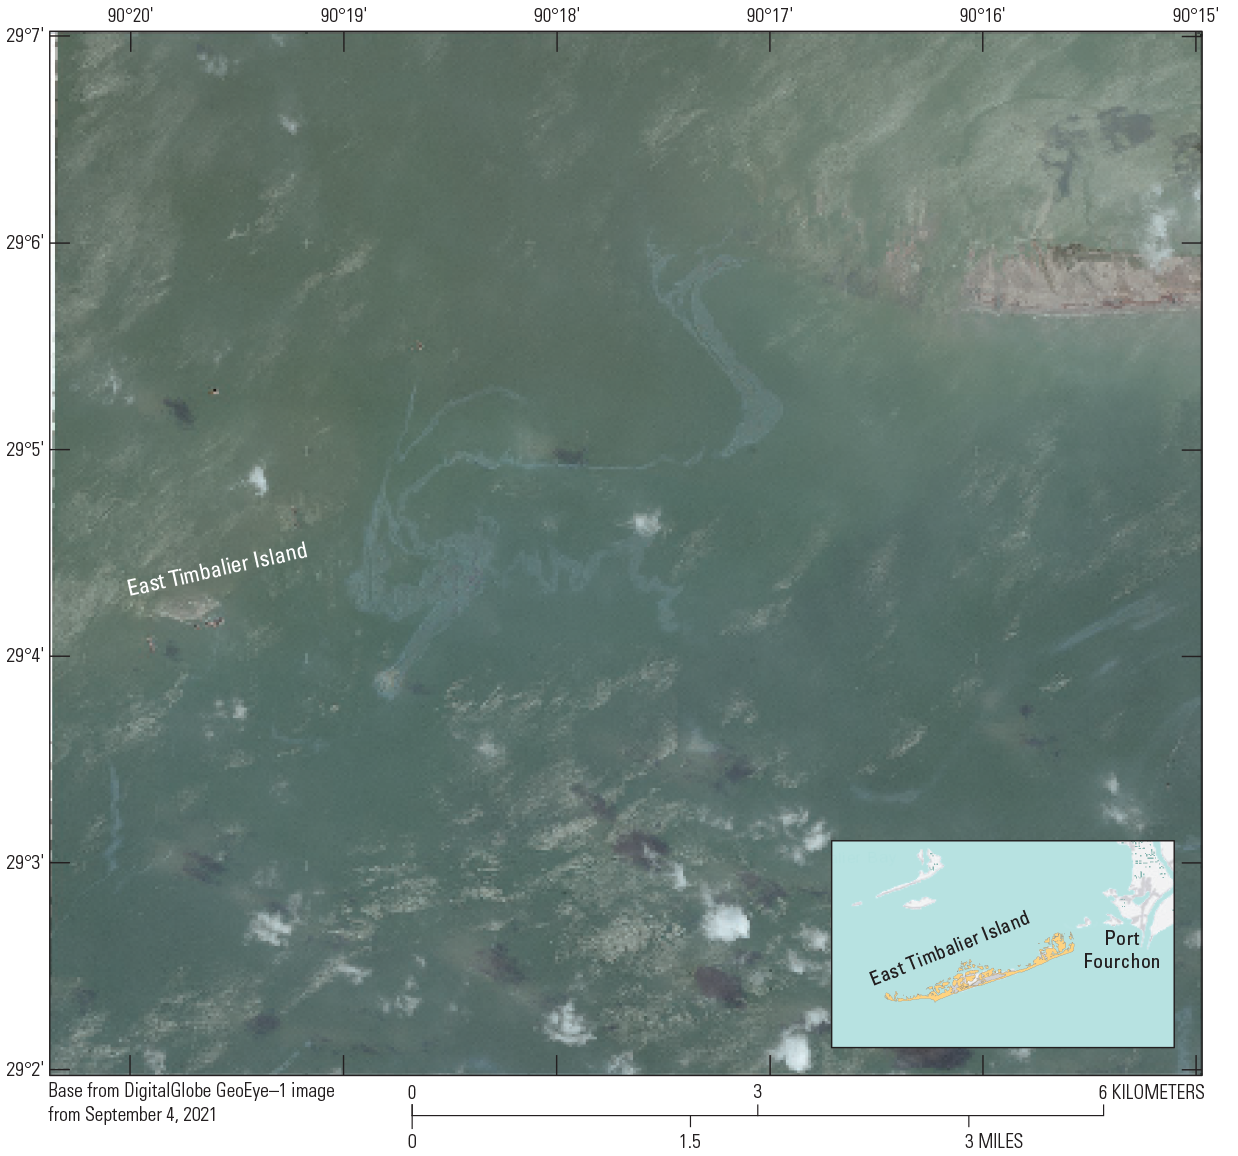
On June 18, 2021, Tropical Storm Claudette passed 67 km west of East Timbalier Island, causing erosion of the remaining land. While East Timbalier Island eroded from its original location, the shifting sand and sediment migrated northwest. With each passing storm, more sand and sediment was removed from the sand shoals and deposited further north into Timbalier Bay. This redistribution of sand is visible in the images in figure 8. The six images in figure 8 (A–F) show the central portion of the Island, with a focus on the remnants surrounding the oil and gas plant (fig. 8C). The resultant sand bars, which migrated to the north after Tropical Storm Claudette (fig. 8D), are also shown.
The rapid pace of Island erosion can be seen in the juxtaposition of the February 3, 2020, GFL image (fig. 8A) and the July 19, 2021, DigitalGlobe WorldView–3 image (fig. 8D). Each storm that passed the region during 2020 and 2021 caused significant erosion and the redistribution of sediment at the site of the Island. The site became completely submerged after Tropical Storm Claudette, and sand shoals emerged north of the site, although they are likely to dissipate. After Hurricane Ida passed over the site on August 29, 2021, the sand shoals north of the oil and gas plant disintegrated, and open water surrounded the site of the Island (figs. 1.26, 1.27).
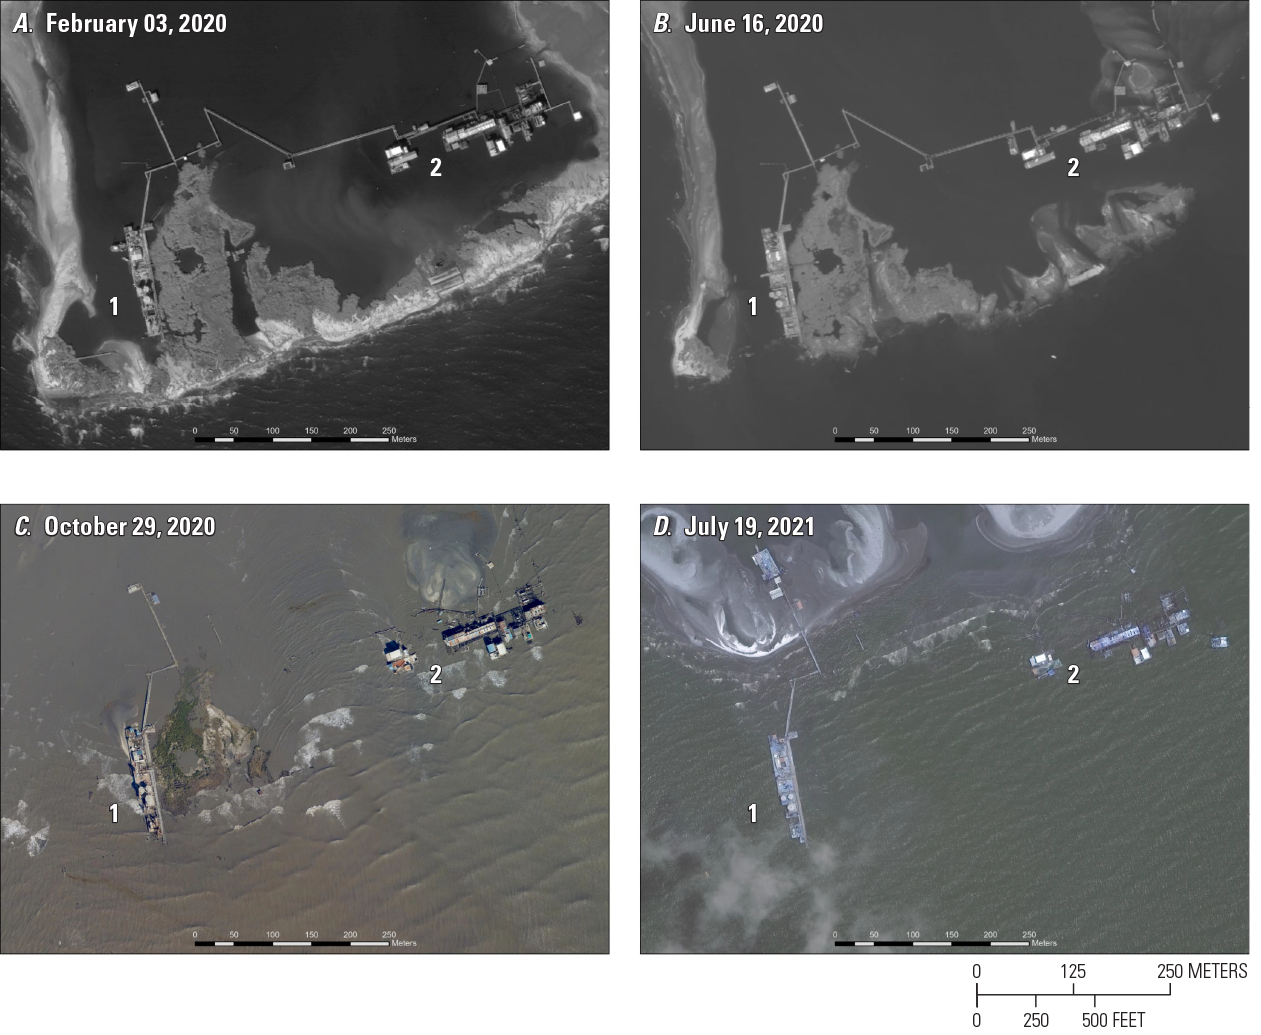
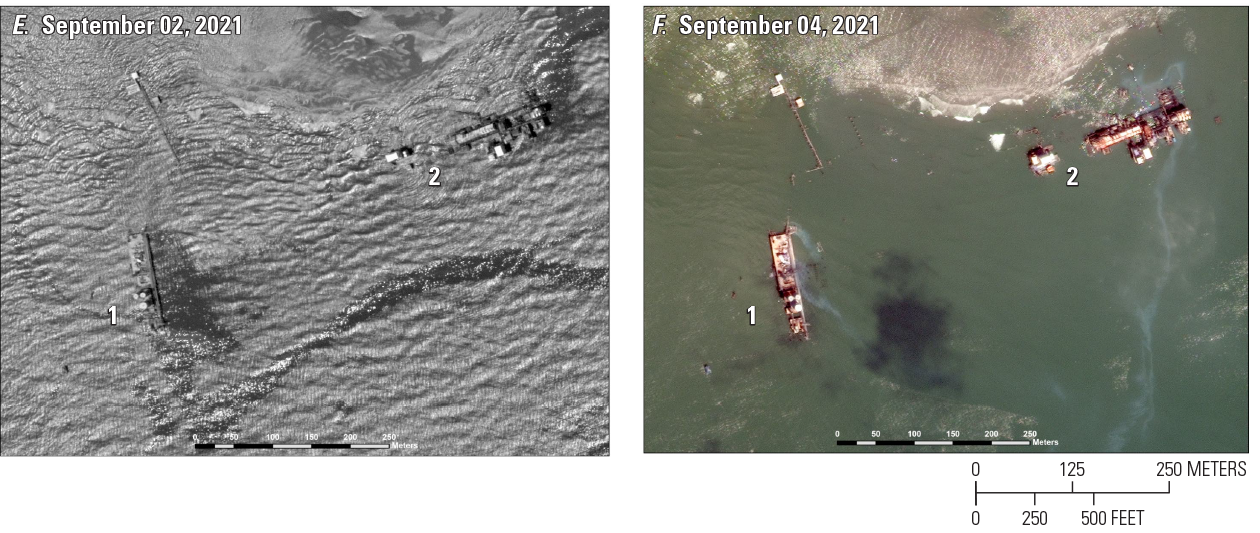
A collection of satellite images (A–F) of East Timbalier Island, Louisiana (La.), captured between February 3, 2020, and September 4, 2021. Locations 1 and 2 in the images are sections of oil and gas infrastructure. A. Global Fiducials Library (GFL) image from February 3, 2020, shows the Island as a contiguous whole, although it has large sand- and sediment-filled sacks covering a washover from late 2019, just below location 2. B. Breaches seen in GFL image from June 16, 2020—south of location 1 and east of location 2—created direct openings to both segments of infrastructure after being hit by Tropical Storm (TS) Cristobal, leaving both exposed to western- and northern-moving Gulf wave action for the first time. C. Last land-surface Island remnant, just east of location 1, can be seen in the October 29, 2020, National Oceanic and Atmospheric Administration Emergency Response Imagery (NOAA–ERI) image collected a day after Hurricane Zeta passed. Some catwalks and infrastructure connecting location 1 to location 2 were damaged. D. DigitalGlobe WorldView–3 image from July 19, 2021, shows, after TS Claudette in June, the migrated sand-sediment created shoals and bars north of where East Timbalier Island was located. Hurricane Ida, a Category 4 hurricane, passed east of the Island on August 29, 2021, and was devastating to southern Louisiana and carried torrential rain and flooding into the northeastern United States. E. In the DigitalGlobe WorldView–1 image from September 2, 2021, the wave action continues from the south and east through locations 1 and 2, dissipating where the sand bars once were. Oil slicks appear to be coming from locations 1 and 2, drifting east into the Gulf of Mexico. In the complete WorldView–1 image, numerous oil leaks are visible in the Gulf, east of East Timbalier Island and south of Port Fourchon, La., some of which are visible in figure 1.26. F. DigitalGlobe GeoEye–1 image from September 4, 2021, in which the seas have calmed from the effects of Hurricane Ida. Locations 1 and 2 are surrounded by water, with only the shallow shoal present northwest of location 2. Infrastructure damage is visible, as are the oil slicks.
Human-Induced Impacts
East Timbalier Island was a major transit location for the oil and gas industry operating in the central Gulf of Mexico. Approximately 150 active and abandoned oil and gas wells were constructed on the Island and in the surrounding waters. Dozens of pipelines crisscross the area and lead to a central processing plant on the north side of the Island. Before it became a major oil- and gas-transit hub, the Island was designated East Timbalier Island National Wildlife Refuge by President Theodore Roosevelt in 1907. The Island’s protections were revoked in 1969 to further develop the oil and gas industry on the Island.
The earliest pipelines, which crossed the Island, can be seen in the 1950s imagery. The images show two lines following the length of the Island westward from Belle Pass. Appendix 1 contains imagery for all high-resolution images referenced in this report for 1953–2021. The 1950s imagery also shows several canals dug on the east side of the Island near Raccoon Pass (figs. 1.1, 1.2), as well as several canals and straightened shorelines on the west-central part of the Island where the main processing plant is located. In 1965, the canal dug into the western end of Belle Pass, east of Raccoon Pass inlet, quickly eroded and became a parallel inlet on the east side of Raccoon Pass (fig. 1.3). By 1972, the two inlets had merged into a single, 17-m-wide inlet that separated East Timbalier Island from the Belle Pass barrier spit (fig. 1.4).
Similarly, the land along the east-west traversing pipelines quickly eroded during this period, narrowing the Island width to less than 100 m at the east-central part of the Island. In 1992, erosion from Hurricane Andrew, which passed 60 km west of the Island, created a new inlet at this narrow location (fig. 1.10). The Island then segmented into two sections: an eastern section of approximately 500 ha and a western section of approximately 1,100 ha. By late 1992, both sections of the Island had numerous oil and gas facilities, including pipelines, buildings, radio towers, and containment ponds. This period saw the most significant changes to the Island, most notably the restoration efforts that were part of the CWPPRA project in the late 1990s.
The land area gained by the completion of the CWPPRA project in 2000 quickly eroded over the next decade, with a loss of more than 47 percent of the land area by September 8, 2011 (fig. 1.13). The eastern section of East Timbalier Island migrated northward during this time while also quickly eroding. By September 2011, this section had become a sand bar approximately 2 km north of its pre-2000 location (fig. 1.13). The north side of the main, western section of the Island includes onshore and offshore petroleum-associated facilities and a quay. The GFL images from September 2011 to February 2020 (figs. 1.13–1.22) show both the east and west ends of this section of the Island migrating northward in a crescent shape while eroding closer to the processing plant. The June 2020 GFL image shows that these sections eroded, offering little protection to the main part of the island, which surrounded the oil and gas infrastructure.
The spits of land that formed on the west and east sides of the Island broke off, respectively, in February 2013 and December 2015 (figs. 1.15, 1.17). These newly created islands quickly eroded and became sand bars that occasionally reemerged and then disintegrated with seasons and tides. On June 16, 2020 (fig. 1.23), the size of the Island was slightly over 73,000 m2 and continuing to erode. The remaining section of the Island that was held in place by the oil and gas processing plant built in the 1960s (fig. 1.3) eroded until June 2021, when it disintegrated.
Hurricane Ida passed almost directly over the site of East Timbalier Island on August 29, 2021, causing significant destruction of the oil and gas plant. DigitalGlobe WorldView–1 and GeoEye–1 satellite imagery collected on September 2nd and 4th, respectively (figs 1.26 and 1.27), show two large oil spills south and east of the oil and gas plant. Several other oil spills were reported south and east of Port Fourchon (Biesecker, 2021; Singh and others, 2021), although the source of these spills is currently under investigation. Given the large concentration of petroleum infrastructure at the site of East Timbalier Island, environmental issues may be a continuing problem.
Implications for Timbalier Bay
Much of the change at East Timbalier Island was episodic, occurring during major storm events and seasonal high-water events when waves eroded vegetation and carried sand away from the Island. Ultimately, unmitigated erosion of the Island caused continued thinning and a shortening of the Island’s east end. After the 2020 and 2021 storms, only a series of small, northward-migrating sand shoals remained. The consequences include a loss of local oil-production infrastructure; hazards to navigation that require new charts of the area; accelerated erosion to the eastern end of Timbalier Island; and an increased risk of erosion to the eastern portion of Timbalier Bay, including Calumet and Casse-tete Islands, La. (fig. 2), and the western approaches to Port Fourchon, La., through West Belle Pass. Over the longer term, Timbalier Bay is expected to continue to be shaped by regional subsidence of the Mississippi River Delta Plain, additional localized subsidence related to oil and gas extraction from the bay area, and continued efforts to mitigate wetland loss in the area.
Across the period covered by this report, oil-production-related infrastructure was affected by changes at East Timbalier Island. In early 2020, commercial satellite images showed that sediment from dredged areas around the oil facility was deposited at both recent and potential washover sites. By February 2020, additional mitigation efforts were underway, including the placement of several 20-m-long, sand-filled, anti-erosion barriers. These mitigation efforts ended shortly thereafter due to increased costs and the accelerated loss of the Island. With the Island sand and sediment redeposited north of the oil and gas infrastructure, there was no longer an Island to function as a barrier for storm-driven waves and surges.
During the 21st-century, erosion of the Island outpaced efforts to chart the changes in the area, increasing the risk to navigation. The version of NOAA Chart 11365 (NOAA, 2018) available at the time of this report includes corrections before June 1, 2021, but changes to the shape of the Island outpace even this recent chart. Continually changing bottom depths and shifting shoals and sandbars characterize the area around the Island. Submerged segments of a sea wall and piles of rip rap, along with a network of submerged operational and legacy pipelines and other infrastructure, pose potential hazards to fishing nets and boating.
The loss of East Timbalier Island opens a gap at the eastern end of Timbalier Bay, exposing the bay to the direct force of sea waves and storm surges. Over the longer term, Calumet and Casse-tete Islands may face increased erosion from more direct exposure to ocean waves, especially during tropical storms (figs. 1.22–1.24).
GFL imagery, commercial satellite imagery, Landsat and Sentinel–2 satellite imagery, and historical aerial photography provide a unique record of the changes to East Timbalier Island across the last seven decades, ultimately depicting its disappearance. Continued monitoring can help in assessing changes after the loss of the Island and the subsequent effects on Timbalier Bay.
Conclusion
East Timbalier Island experienced extreme erosion over the past 68 years, changing from an area of over 6.6 million m2 in 1954, to less than 74,000 m2 in mid-2020, to completely eroding away in early Summer 2021. Island width continued to shrink, decreasing from a mean average of 235.8 m in 2011, to a mean average of 49 m in mid-2020, to a value of 0 in early Summer 2021. The causes for this extreme erosion are complex and varied. These causes include exposure to frequent tropical storms that breached the Island and eroded the shoreline; dredging and channeling from the infrastructure built to support the oil and gas industry; and mitigation projects that occurred between 1998 and 2000. A project that started in 2020 led to sand berms and rock revetment walls designed to protect the Island from erosion, but they failed because they undermined the sediment that they were designed to protect.
Image collection over East Timbalier Island has been extensive and varied. High-resolution aerial photography captured the development of the oil and gas infrastructure on the Island during the 1950s and 1960s. Declassified CORONA and HEXAGON imagery collected in the 1960s and 1970s provide a detailed look at changes from that period. The GFL imagery collected over the Island since 1991 enabled the frequent observation of changes to the Island caused by tropical storm damage and catastrophic threats to the environment caused by the failed infrastructure and remediation projects. Additionally, moderate-resolution Landsat and Sentinel–2 satellite imagery provided continuous observation of the extensive changes that have happened since 1972 and 2015, respectively. Newer commercial satellite systems now provide additional observation platforms to help document changes along the Louisiana coast.
The unprecedented hurricane seasons of 2020 and 2021 resulted in the final erosion of the Island. Given the frequent shifts in the surrounding sediment and exposure to the open waters of the Gulf of Mexico, the Island became a drifting sand bar only exposed at low water. This extensive loss of land leaves an open gap to Timbalier Bay that was once protected by the over 10 km of barrier island provided by East Timbalier Island. Given the demise of this protection, the shoreline of the central Louisiana coast is now vulnerable to increased erosion and land loss.
References Cited
Baker, J.D., and Zall, L., 2020, The Medea Program—Opening a window into new earth science data: Oceanography (Washington, D.C.), v. 33, no. 1, p. 20–31, accessed August 31, 2021, at https://doi.org/10.5670/oceanog.2020.104.
Barras, J.A., Bernier, J.C., and Morton, R.A., 2008, Land area change in coastal Louisiana—A multidecadal perspective (from 1956 to 2006) (ver. 1.0, May): U.S. Geological Survey Scientific Investigations Map 3019, 1 sheet, scale 1:250,000, 14-p. pamphlet, accessed August 31, 2021, at https://doi.org/10.3133/sim3019.
Barrineau, P., Wernette, P., Weymer, B., Trimble, S., Hammond, B., and Houser, C., 2015, The critical zone of coastal barrier systems, chap. 16 of Giardino, J.R., and Houser, C., eds., Developments in earth surface processes—Principles and dynamics of the critical zone: Amsterdam, Netherlands, Elsevier, v. 19, p. 497–522. [Also available at https://doi.org/10.1016/B978-0-444-63369-9.00016-1.]
Biesecker, M., 2021, Cleanup boats on scene of large Gulf oil spill following Ida: Associated Press, September 4, 2021, accessed September 6, 2021, at https://apnews.com/article/business-environment-and-nature-oil-spills-083370b76caf6d4e3099f90eb9ac4a9c?ref=upstract.com&curator=upstract.com&utm_sourc e=upstract.com.
Burr, D.H., [1839], Map of Mississippi, Louisiana & Arkansas exhibiting the post offices, post roads, canals, rail roads, &c., in The American atlas, exhibiting the post offices, post roads, rail roads, canals, and the physical & political divisions of the United States of North America—Constructed from the government surveys & other official materials, under the direction of the Post Master General: [London], John Arrowsmith, 1 sheet, accessed August 31, 2021, at http://usgwarchives.net/maps/louisiana/statemap/la1839s.jpg. [Link is to partial version of map made available by the USGenWeb Archives Special Projects website. Full map available at https://www.loc.gov/resource/g3935.rr001340.]
Byrnes, M.R., Berlinghoff, J.L., Griffee, S.F., and Lee, D.M., 2018, Louisiana Barrier Island Comprehensive Monitoring Program (BICM)—Phase 2—Updated shoreline compilation and change assessment, 1880s to 2015: Louisiana Coastal Protection and Restoration Authority report, prepared by Applied Coastal Research and Engineering, Mashpee, Mass., and Metairie, La., in cooperation with CDM Smith, [Boston, Mass.,] 46 p., accessed August 31, 2021, at https://www.lacoast.gov/reports/project/20180812_BICM_Phase2_Final_Report_plus_Appendices.pdf.
Couvillion, B.R., Beck, H., Schoolmaster, D., and Fischer, M., 2017, Land area change in coastal Louisiana (1932 to 2016): U.S. Geological Survey Scientific Investigations Map 3381, 1 sheet, scale 1:265,000, 16-p. pamphlet, accessed August 31, 2021, at https://doi.org/10.3133/sim3381.
Curole, J.P., Lee, D.M., and West, J.L., 2012, 2012 operations, maintenance, and monitoring report for East Timbalier Island sediment restoration (TE–25 & TE–30): State of Louisiana, Coastal Protection and Restoration Authority, Office of Coastal Protection and Restoration OM&M [Operations Monitoring & Maintenance] Report, prepared by Curole, J.P., Lee, D.M., and West, J.L., under State project nos. TE–25 and TE–30, 88 p., accessed August 31, 2021, at https://lacoast.gov/new/Projects/Info.aspx?num=TE-25.
Frazier, D.E., 1967, Recent deltaic deposits of the Mississippi River—Their development and chronology: Gulf Coast Association of Geological Societies Transactions, v. 17, p. 287–311, accessed August 31, 2021, at https://archives.datapages.com/data/gcags/data/017/017001/0287.htm.
Kindinger, J.L., Buster, N.A., Flocks, J.G., Bernier, J.C., and Kulp, M.A., 2013, Louisiana Barrier Island Comprehensive Monitoring (BICM) program summary report—Data and analyses 2006 through 2010: U.S. Geological Survey Open-File Report 2013–1083, 86 p., accessed August 31, 2021, at https://doi.org/10.3133/ofr20131083.
Kramer, J.N., III, 2016, Barrier spit evolution and primary consolidation of backbarrier facies—West Belle Pass Barrier, LA: New Orleans, La., University of New Orleans, Master’s thesis, 113 p, accessed August 31, 2021, at https://scholarworks.uno.edu/td/2214.
Kulp, M.A., FitzGerald, D., Penland, S., and Motti, J., 2003, Evolution and stratigraphy of a recent flood tidal delta—Raccoon Pass, Timbalier Islands Louisiana in Transactions of the 53rd annual convention, Gulf Coast Association of Geological Societies [and] 50th GCSSEPM [Gulf Coast Section of the Society for Sedimentary Geology] anniversary, Baton Rouge, Louisiana, October 22–24, 2003: Baton Rouge, La., Gulf Coast Association of Geological Societies Transactions, v. 53, p. 422–433, accessed August 31, 2021, at https://archives.datapages.com/data/gcags/data/053/053001/0422.htm.
Kulp, M.A., Georgiou, I.Y., Kramer, J.N., and Marchal, K.L., 2015, Geomorphic evolution of the coupled Raccoon Pass and West Belle Pass Barrier Spit, Louisiana: [Baton Rouge, La.], The Water Institute of the Gulf, Coastal Protection and Restoration Authority, and the Baton Rouge Area Foundation, 46 p., accessed August 31, 2021, at https://thewaterinstitute.org/assets/docs/reports/12_02_2016_Geomorphic-Evolution-of-the-Coupled-Raccoon-Pass-and-West-Belle-Pass-Barrier-Spit-Louisia na.pdf.
List, J.H., 2004, Louisiana's barrier islands—A vanishing resource: U.S. Geological Survey [Fact Sheet] web page, accessed August 31, 2021, at https://doi.org/10.3133/70182042.
List, J.H., Jaffe, B.E., Sallenger, A.H., Jr., Williams, S.J., McBride, R.A., and Penland, S., 1994, Louisiana barrier island erosion study; atlas of sea-floor changes from 1878 to 1989: U.S. Geological Survey Miscellaneous Investigations Series Report I–2150–B, 81 p., accessed August 31, 2021, at https://doi.org/10.3133/i2150B.
Louisiana Coastal Wetlands Conservation and Restoration Task Force, 2002, East Timbalier Island sediment restoration, phase 1 (TE–25): Louisiana Coastal Wetlands Conservation and Restoration Task Force Fact Sheet, October 2002, 2 p., accessed August 31, 2021, at https://www.lacoast.gov/reports/gpfs/TE-25_hq.pdf. [Revised report cost-figures from December 2021.]
McBride, R.A., Penland, S., Hiland, M.W., Jeffress Williams, S., Westphal, K.A., Jaffe, B.E., and Sallenger, A.H., Jr., 1992, Analysis of barrier shoreline change in Louisiana from 1853 to 1989, chap. 4 of Atlas of shoreline change in Louisiana from 1853 to 1989: U.S. Geological Survey Miscellaneous Investigations Series Report I–2150–A, p. 36–97, accessed August 31, 2021, at https://doi.org/10.3133/i2150A.
Merino, J., Aust, C., and Caffey, R., 2011, Cost-efficacy in wetland restoration projects in coastal Louisiana: Wetlands, v. 31, no. 2, p. 367–375, accessed August 31, 2021. https://doi.org/10.1007/s13157-011-0145-z.
Miner, M., Kulp, M.A., Penland, S., Weathers, D., Motti, J.P., McCarty, P., Brown, M., Martinez, L., Torres, J., Flocks, J.G., Dewitt, N., Ferina, N., Reynolds, B.J., Twichell, D., Baldwin, W., Danforth, B., Worley, C., and Bergeron, E., 2009, Part 1—South‐central Louisiana and northern Chandeleur Islands, bathymetry methods and uncertainty analysis—Final report (January 2009), in Louisiana Barrier Island Comprehensive Monitoring Program (BICM) volume 3—Bathymetry and historical seafloor change 1869–2007: Louisiana Department of Natural Resources, Coastal Restoration Division report, prepared by the U.S. Geological Survey and the University of New Orleans, Pontchartrain Institute for Environmental Sciences, funded through the LCA Science & Technology Program (a partnership between the Louisiana Department of Natural Resources [LDNR] and the U.S. Army Corps of Engineers) under LDNR interagency agreement no. 2512–06–06, 41 p., accessed August 31, 2021, at https://www.lacoast.gov/reports/project/BICM3_part1_methods.pdf.
Miner, M.D., FitzGerald, D.M., and Kulp, M.A., 2006, Morphologic evolution of a transgressive tidal inlet, Little Pass Timbalier, Louisiana in Transactions—Prepared for the 55th annual Convention of the Gulf Coast Association of Geological Societies, American Association of Petroleum Geologists regional meeting and the 52nd annual meeting of the Gulf Coast Section of the Society of Economic Paleontologists and Mineralogists, in New Orleans, Louisiana, September 25–28, 2005: [New Orleans, La.,] Gulf Coast Association of Geological Societies, v. 55, p. 532–541, accessed August 31, 2021, at https://archives.datapages.com/data/gcags/data/055/055001/pdfs/532.pdf.
Molnia, B.F., 2012, Global Fiducials Program imagery—Opportunities for monitoring climate change, observing Earth's dynamic processes, performing geospatial research, and supporting education [abs.], on 1 CD–ROM of International Geological Congress, 34th, Brisbane, Australia, August 5–10, 2012: International Geological Congress, abs. no. 1212.
Molnia, B.F., Angeli, K.M., Dilles, S.J., Fisher, G.B., and. Slonecker, E.T., 2019, The fluvial-marine transition in space and time—Using global fiducials high resolution imagery, Landsat, and aerial photography to monitor six decades of change at East Timbalier Island, Louisiana, 1953–2019: Geological Society of America Abstracts with Programs, v 51, no. 5, [1 p.], accessed August 31, 2021, at https://doi.org/10.1130/abs/2019AM-339109.
Molnia, B.F., Price, S.D., and King, S.E., 2011, Global Fiducials Program imagery—New opportunities for geospatial research, outreach, and education[abs.]: Geological Society of America Abstracts with Programs, v. 43, no. 5, p. 403. [Also available at https://ui.adsabs.harvard.edu/abs/2012AGUFMED34A..01P/abstract.]
Morgan, J.P., 1974, Recent geological history of the Timbalier Bay area and adjacent Continental Shelf: Rice University Studies, Rice Institute pamphlet, v. 65, no. 4, p. 575–589, accessed August 31, 2021, at https://scholarship.rice.edu/bitstream/handle/1911/63383/article_RIP654-5_part27.pdf?sequence=1. [Reprinted from Mélanges, no. 9, November 15, 1974.]
National Geospatial-Intelligence Agency, 2017, NextView License Information Paper: National Aeronautics and Space Administration website, accessed August 31, 2021, at https://cad4nasa.gsfc.nasa.gov/DOC/NextView_License_Information_Paper_20170503.pdf.
National Oceanic and Atmospheric Administration, [NOAA], 2018, Louisiana, Barataria and Bayou Lafourche waterways, Intracoastal waterway to Gulf of Mexico (25th ed. [corrected June 1, 2021]: NOAA Nautical Chart 11365, 1 sheet, scale 1:50,000, accessed August 31, 2021, at https://www.charts.noaa.gov/OnLineViewer/11365.shtml. [Current corrected charts only available at link; previous corrections, including the chart referenced here, may no longer be available at website.]
National Oceanic and Atmospheric Administration [NOAA], 2020a, Historical hurricane tracks web page: NOAA website, accessed August 31, 2021, at https://coast.noaa.gov/hurricanes/#map=4/32/-80.
National Oceanic and Atmospheric Administration, [NOAA], 2020b, State of the Climate—Hurricanes and tropical storms for annual 2019: NOAA National Centers for Environmental Information website, accessed August 31, 2021, at https://www.ncdc.noaa.gov/sotc/tropical-cyclones/201913.
National Reconnaissance Office, 1995, President orders declassification of historic satellite imagery citing value of photography to Environmnetal [sic] Science: National Reconnaissance Office press release, February 24, 1995, accessed December 8, 2021, at https://www.nro.gov/Portals/65/documents/news/press/1995/1995-01.pdf.
Penland, S., and Suter, J.R., 1985, Low profile barrier island overwash and breaching in the Gulf of Mexico, in Nineteenth Coastal Engineering Conference, Proceedings of the International Conference, September 3–7, 1984, Houston, Texas: New York, American Society of Civil Engineers, v. 3, p. 2339–2345, accessed August 31, 2021, at https://doi.org/10.1061/9780872624382.158.
Penland, S., and Ramsey, K.E., 1990, Relative sea-level rise in Louisiana and the Gulf of Mexico—1908–1988: Journal of Coastal Research, v. 6, no. 2, p. 323–342, accessed August 31, 2021, https://www.jstor.org/stable/4297682.
Penland, S., Zganjar, C., Westphal, K.A., Connor, P., List, J., and Jeffress Williams, S., 1997, Shoreline changes in the Timbalier Barrier Island arc—1887 to 1996, Terrebonne Parish, Louisiana, in Shoreline change posters of the Louisiana Barrier Islands—1885–1996: U.S. Geological Survey Open-File Report 03–398, 13 p., accessed August 31, 2021, at https://pubs.usgs.gov/of/2003/of03-398/posters/pdf/cont_pdf/ti_atlas.pdf.
Ruffner, K.C., ed., 1995, CIA Cold War records—CORONA—America’s first satellite program: Washington, D.C., Central Intelligence Agency, Center for the Study of Intelligence, History staff, [v. 4], 360 p., accessed August 31, 2021, at https://www.cia.gov/static/3d24f7019bf7e718fd1d2a5c57e6a646/corona.pdf.
Singh, K., Shalal, A., and Volcovici, V., 2021, Divers to try to locate source of reported oil spill in Gulf after Hurricane Ida: Reuters, September 5, 2021, accessed September 6, 2021, at https://www.reuters.com/world/us/divers-try-locate-source-reported-oil-spill-gulf-coast-guard-2021-09-05/.
Slonecker, E.T., Fisher, G.B., Dilles, S.J., Molnia, B.F., and Angeli, K.M., 2020, Six decades of change at East Timbalier Island, Louisiana: U.S. Geological Survey data release, accessed August 31, 2021, at https://doi.org/10.5066/P9O71HYS.
Thomas, J.P., Fisher, G.B., Chandler, L.A., Angeli, K.M., Wheeler, D.J., Glover, R.P., Schenck-Gardner, E.J., Wiles, S.E., Lindley, C.F., and Peccini, M.B., 2011, Using remote sensing and imagery exploitation to monitor the dynamics of East Timbalier Island, LA—2000–2010: Geocarto International, v. 26, no. 8, p. 613–632, accessed August 31, 2021. https://doi.org/10.1080/10106049.2011.623791.
Trickey, E., 2017, A hurricane destroyed this Louisiana resort town, never to be inhabited again: Smithsonian Magazine website, January 4, 2017, accessed August 31, 2021, at https://www.smithsonianmag.com/history/hurricane-destroyed-louisiana-resort-town-never-be-inhabited-again-180961645/.
U.S. Coast Guard [USCG], 2015, Louisiana—Timbalier lighthouse, a section in Historically famous lighthouses CG–232: Washington, D.C., U.S. Coast Guard, Public Information Division, 86 p., accessed August 31, 2021, at https://www.gutenberg.org/files/48617/48617-h/48617-h.htm#c19.
U.S. Geological Survey [USGS], 1894, Timbalier, Louisiana, (1894 ed.), scale 1:62,500, in Historical Topographic Map Collection: U.S. Geological Survey National Geologic Map Database, accessed August 31, 2021, at https://ngmdb.usgs.gov/topoview/viewer/. [Historical topographic map directly accessible at https://ngmdb.usgs.gov/ht-bin/tv_browse.pl?id=588db0a4d0fb037d892c0394589c2d8a.]
U.S. Geological Survey [USGS], 1999, Map accuracy standards: U.S. Geological Survey Fact Sheet 171–99, November, accessed August 31, 2021, at https://doi.org/10.3133/fs17199.
U.S. Geological Survey [USGS], 2021, EarthExplorer web page: U.S. Geological Survey website, accessed August 31, 2021, at https://earthexplorer.usgs.gov/.
van Beek, J.L., and Meyer-Arendt, K.J., 1982, Louisiana’s eroding coastline—Recommendations for protection: Coastal Management Section, Louisiana Department of Natural Resources report, prepared by Coastal Environments, Inc., Baton Rouge, La., funded under the Coastal Management Act of 1972 (Public Law 92–583, 86 Stat. 1280) and administered by the National Oceanic and Atmospheric Administration, U.S. Office of Coastal Zone Management, 49 p., accessed August 31, 2021, at https://biotech.law.lsu.edu/blog/LA-Eroding-Coastline-Recommendations-for-Protection.pdf.
Westphal, K., 2008, Part 3—2005–2007 photo‐pairs, in Louisiana Barrier Island Comprehensive Monitoring Program (BICM) volume 1—Barrier shoreline post‐storm assessment: [Louisiana Department of Natural Resources (LDNR), Coastal Restoration Division] report, prepared by University of New Orleans, Pontchartrain Institute for Environmental Sciences, New Orleans, La., 27 p., accessed August 31, 2021, at https://www.lacoast.gov/reports/project/3890913~1.pdf.
Appendix 1. High-Resolution Imagery for East Timbalier Island, 1953–2021
Historical aerial photograph of East Timbalier Island, Louisiana, March 26, 1953.
Historical aerial photograph of East Timbalier Island, Louisiana, January 1954.
Tobin Aerial Surveys image of East Timbalier Island, Louisiana, March 26, 1965.
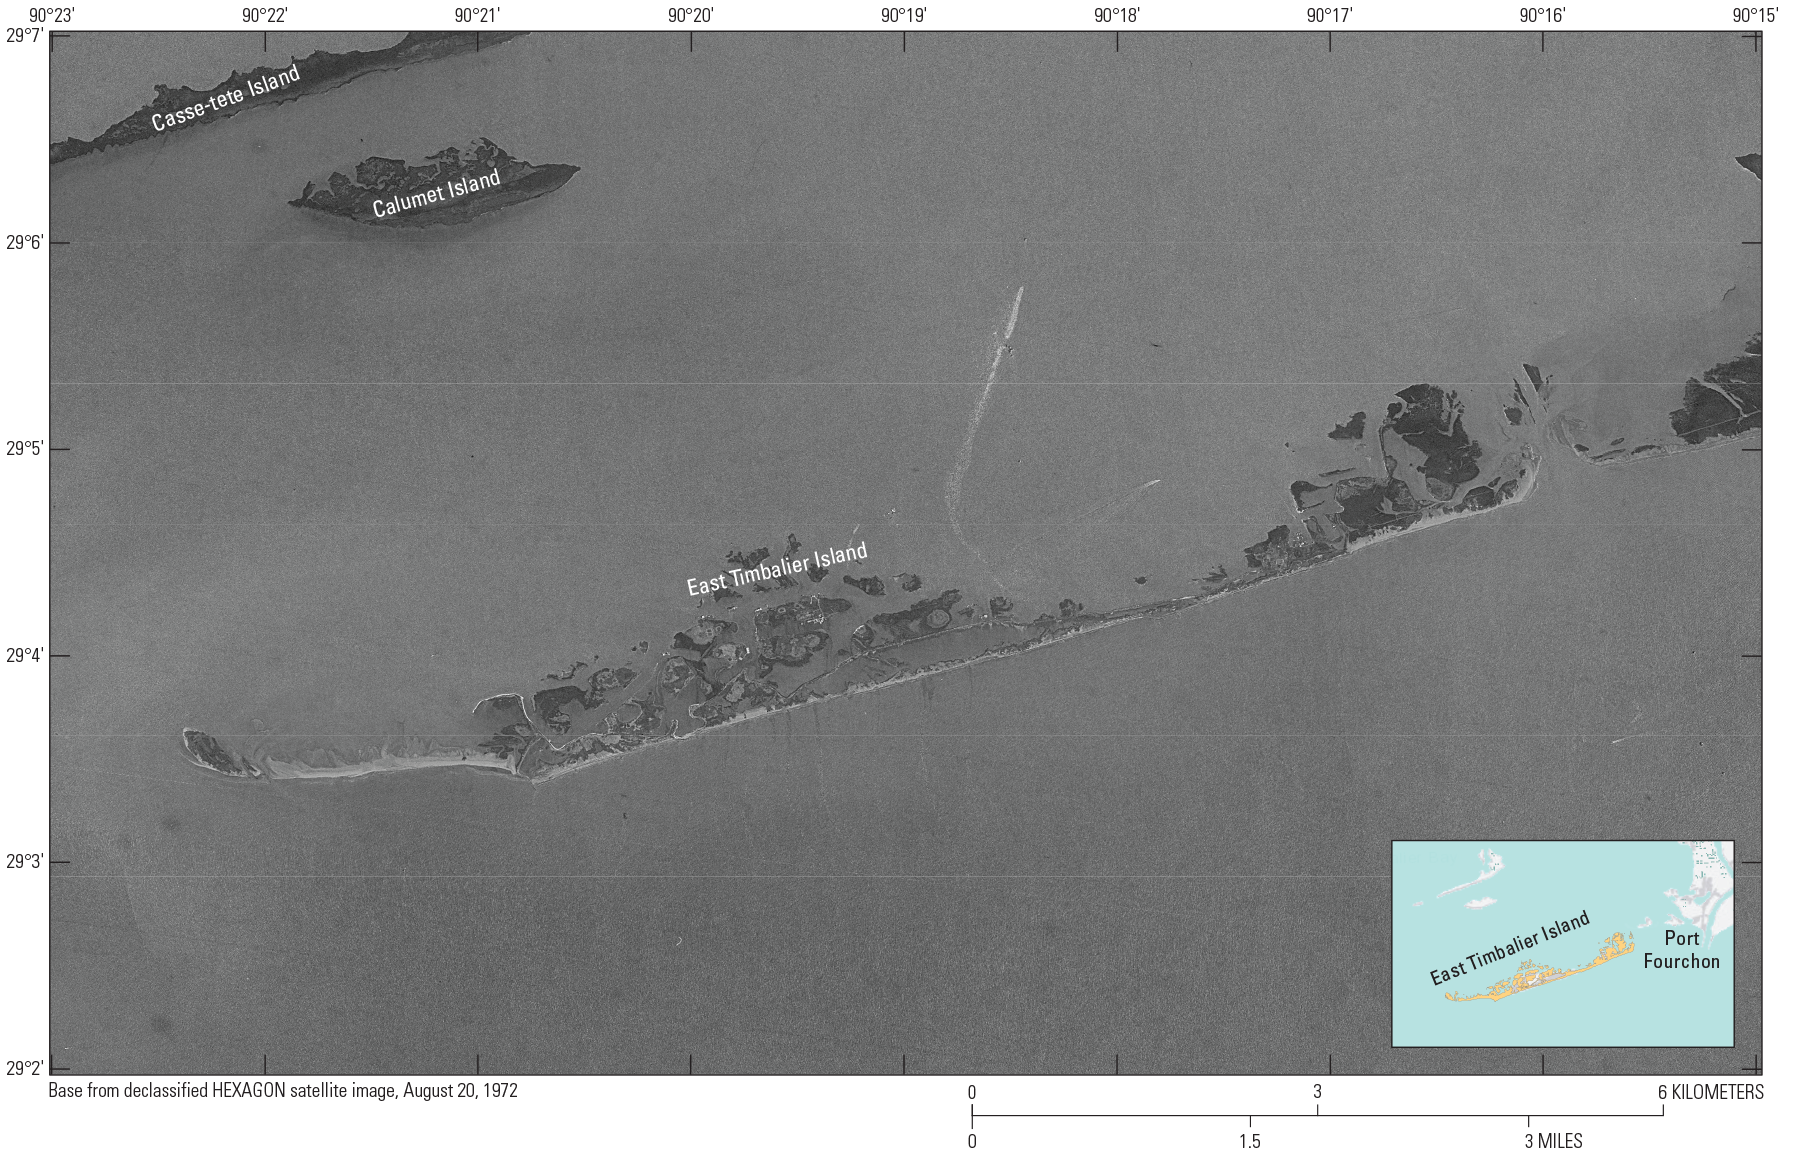
Declassified HEXAGON satellite image of East Timbalier Island, Louisiana, August 20, 1972.
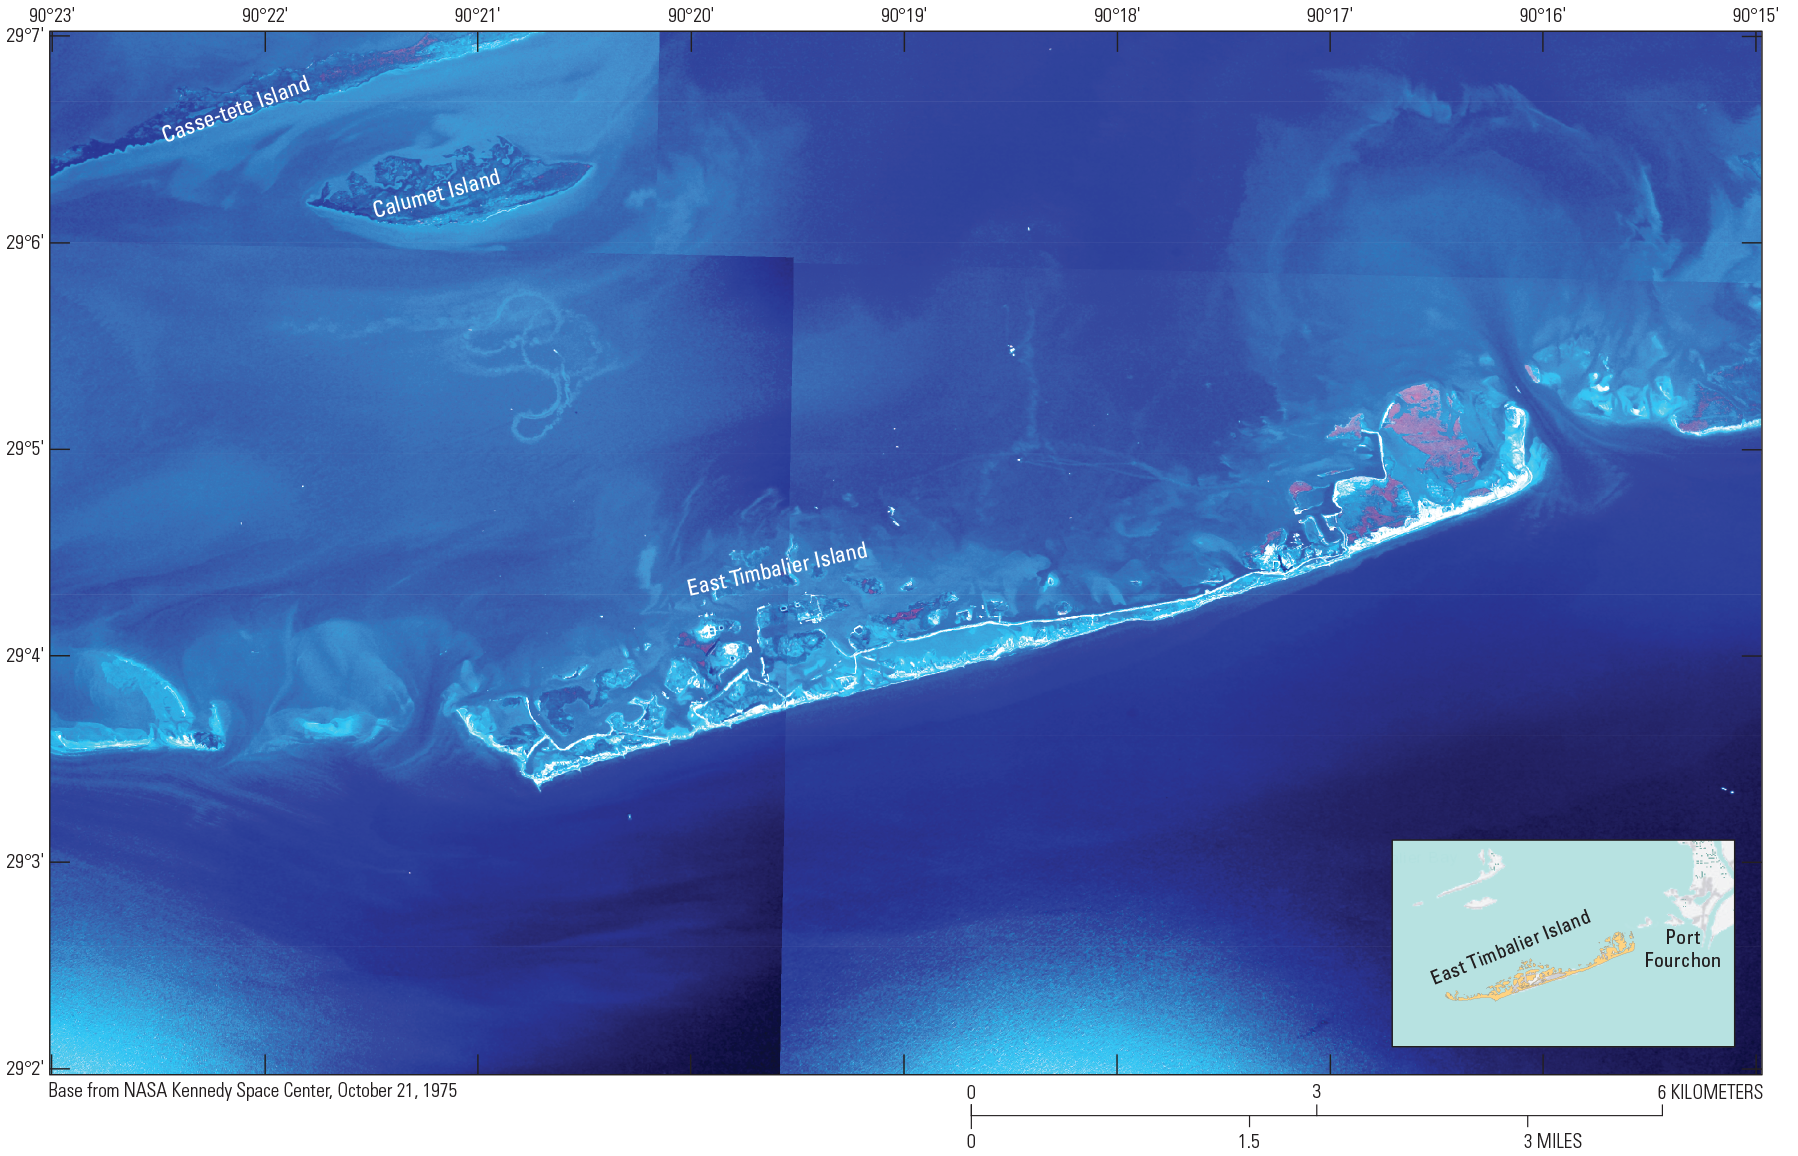
National Aeronautics and Space Administration aerial photograph of East Timbalier Island, Louisiana, October 21, 1975.
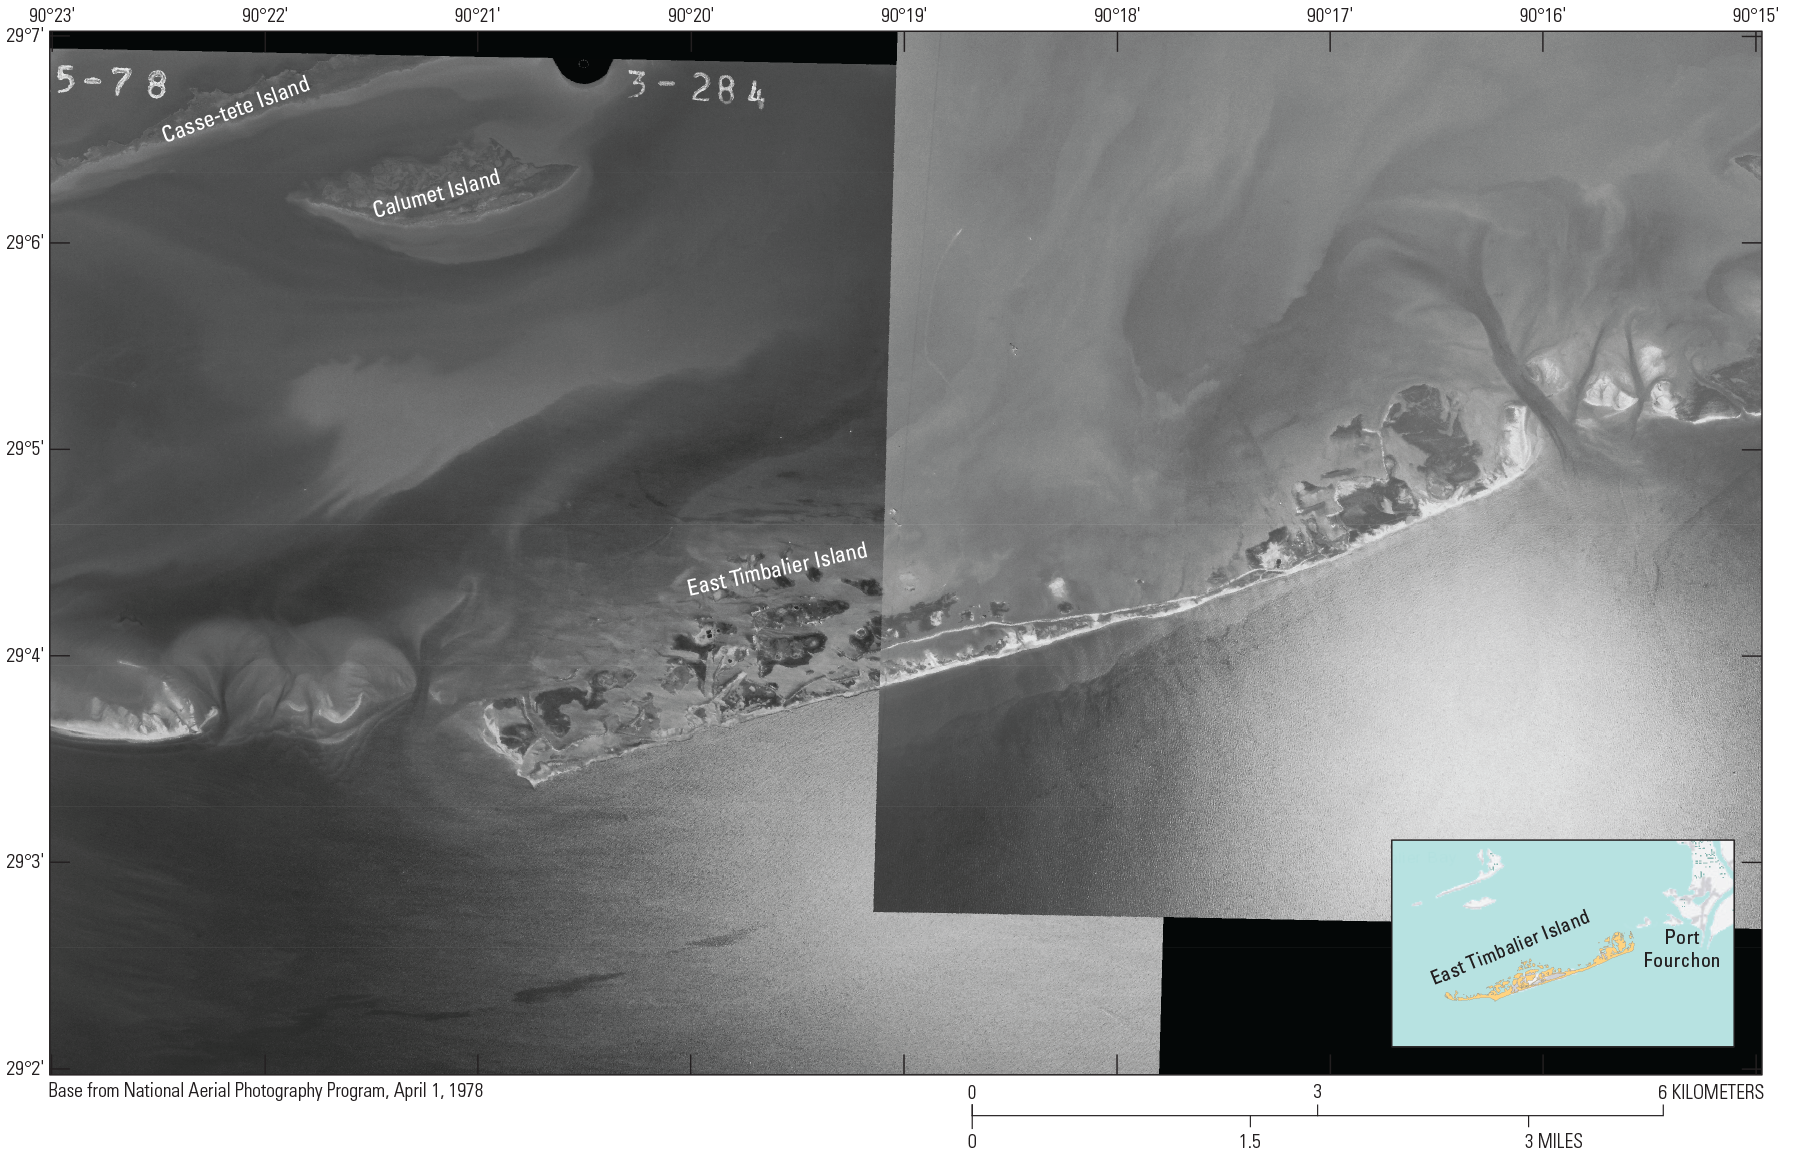
National Aerial Photography Program aerial photograph of East Timbalier Island, Louisiana, April 1, 1978.
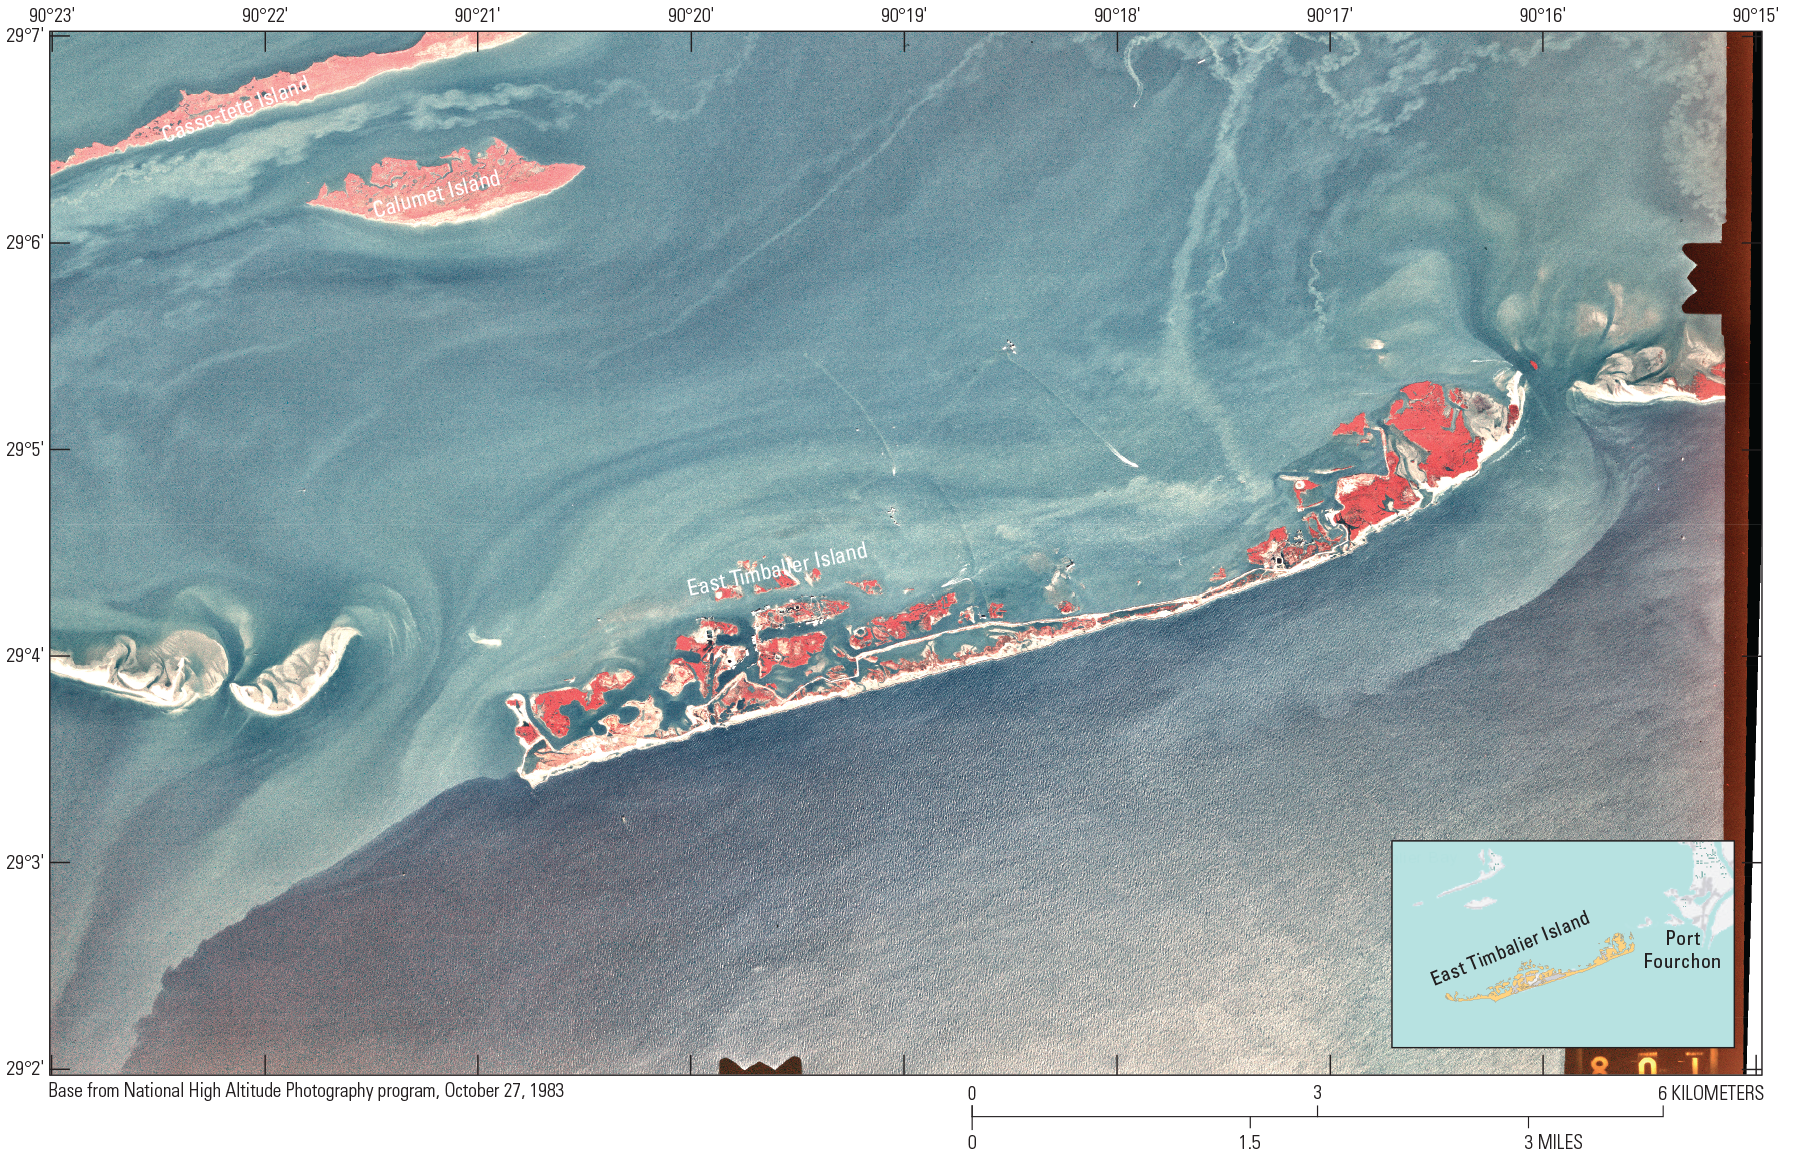
National High Altitude Photography program aerial photograph of East Timbalier Island, Louisiana, October 27, 1983.
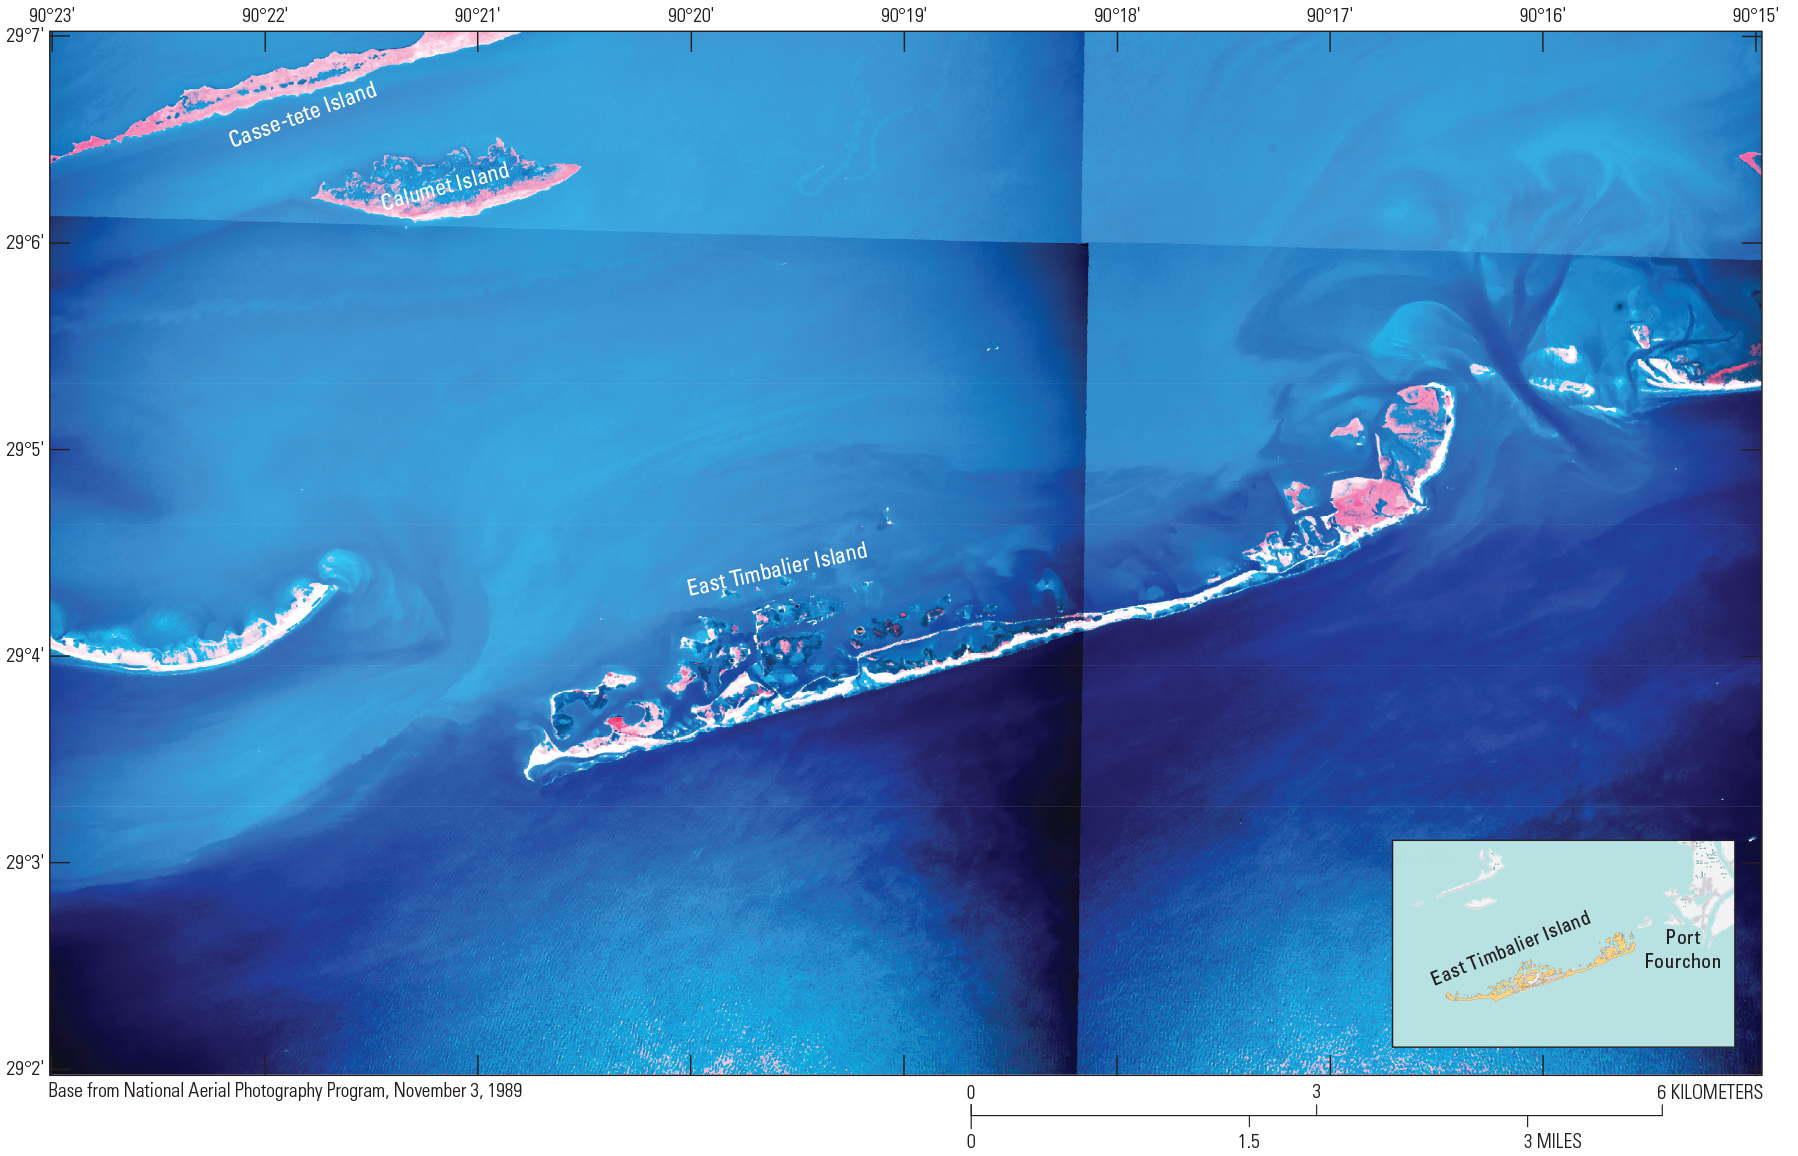
National Aerial Photography Program aerial photograph of East Timbalier Island, Louisiana, November 3, 1989.
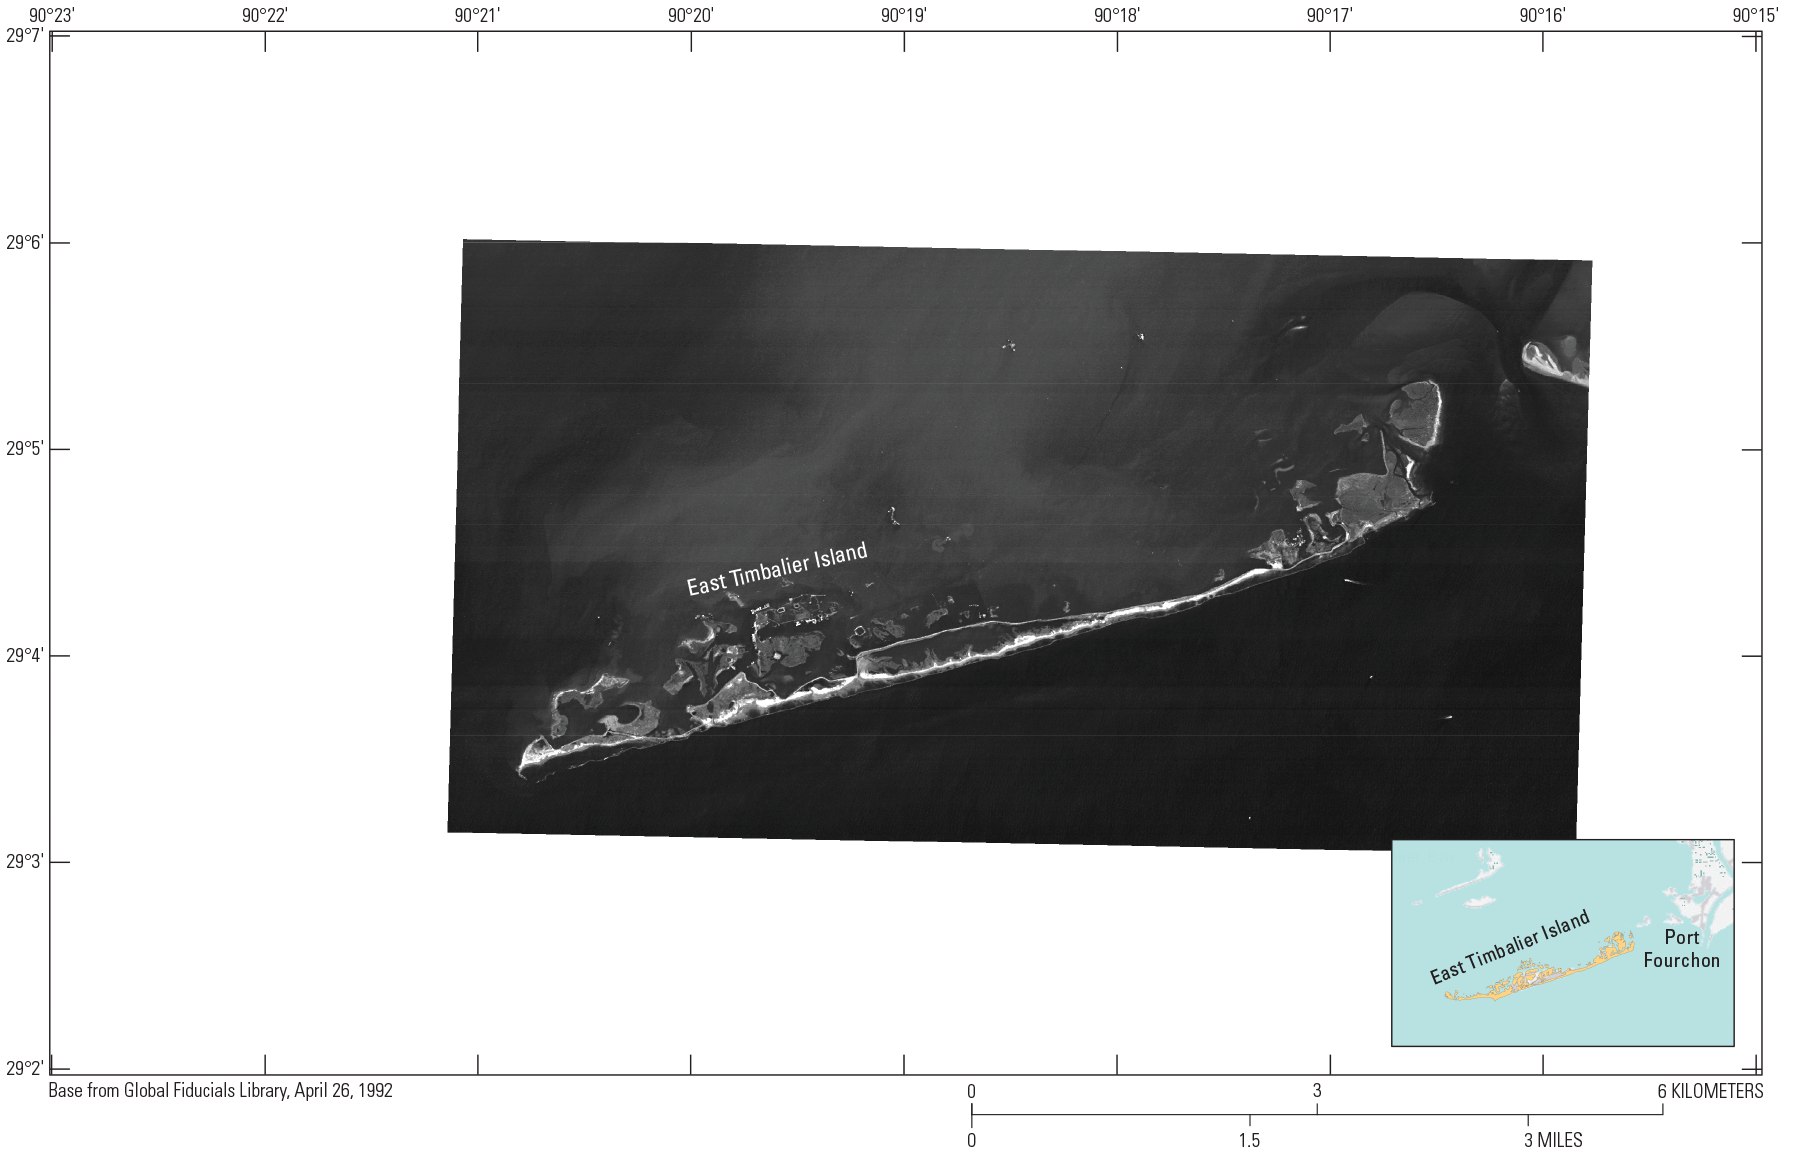
Global Fiducials Library image of East Timbalier Island, Louisiana, April 26, 1992.
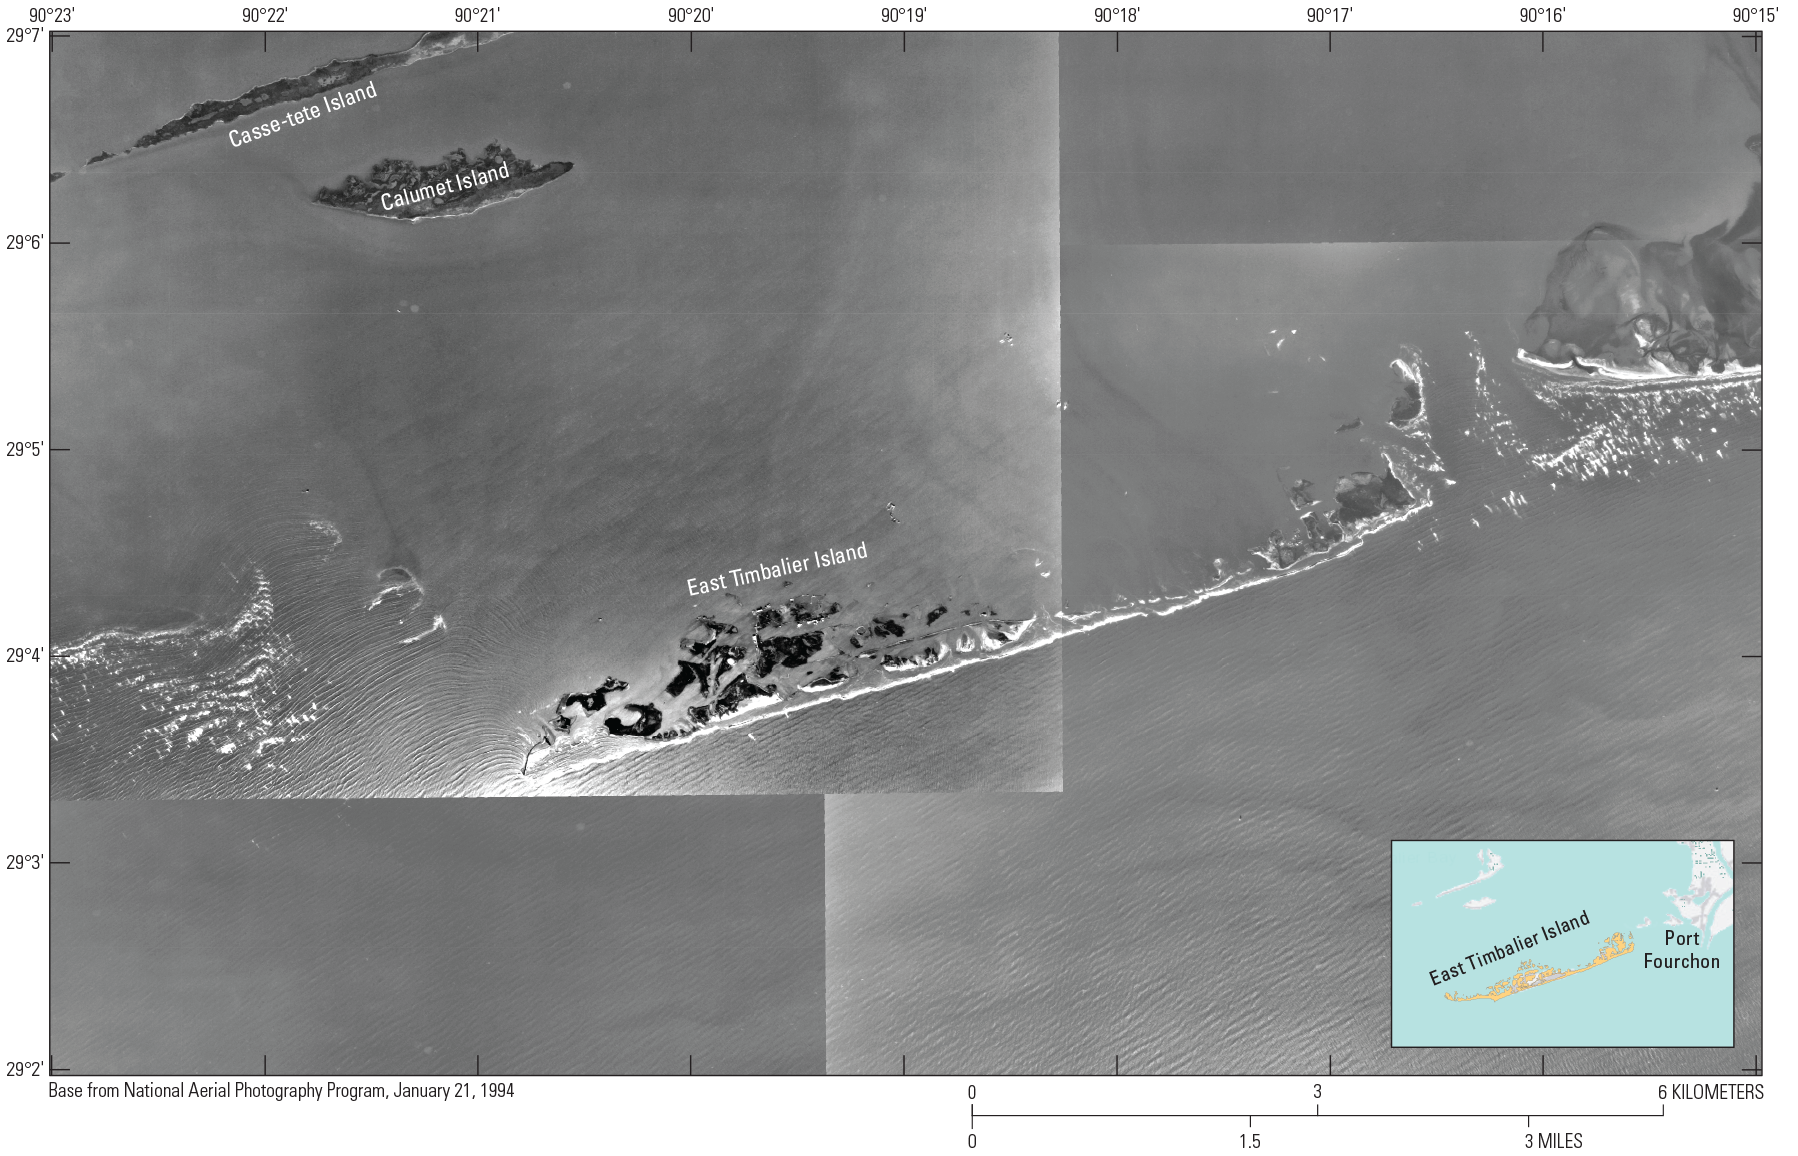
National Aerial Photography Program aerial photograph of East Timbalier Island, Louisiana, January 21, 1994.
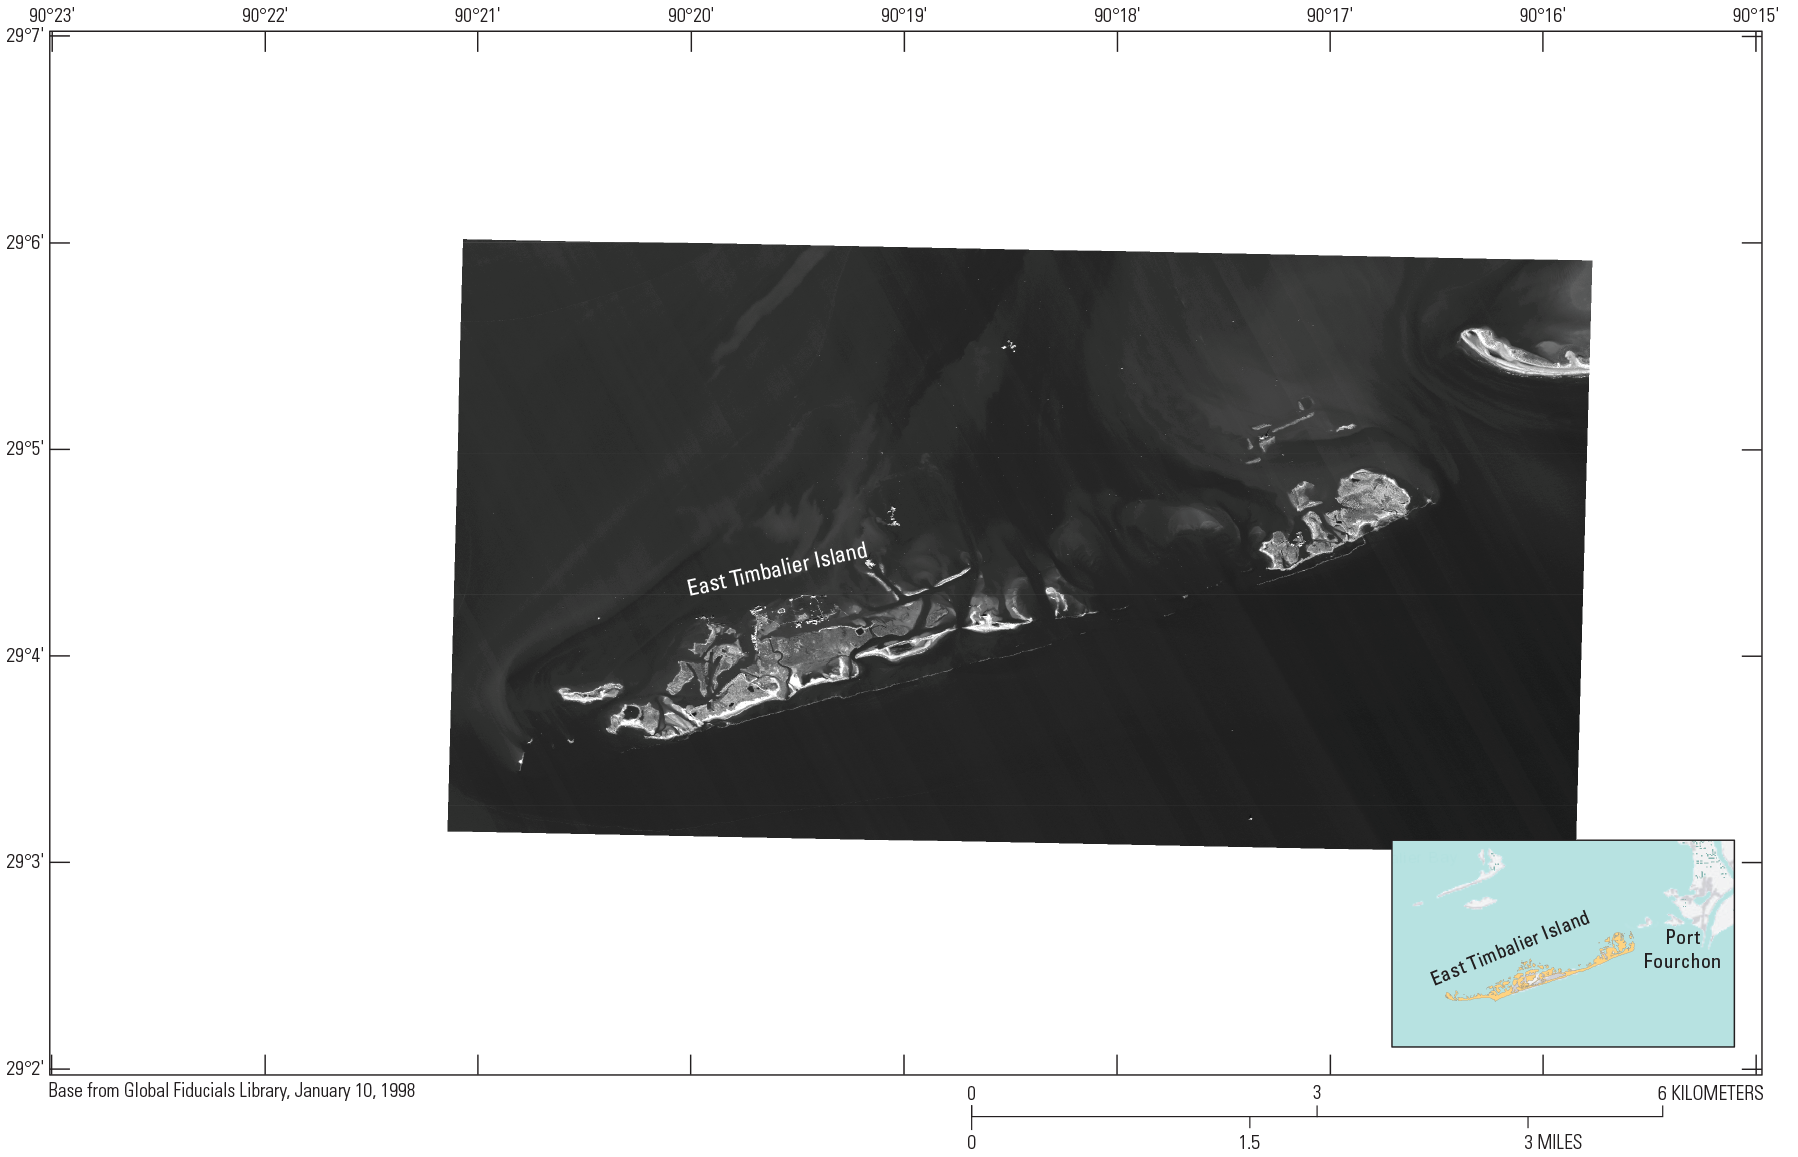
Global Fiducials Library image of East Timbalier Island, Louisiana, January 10, 1998.
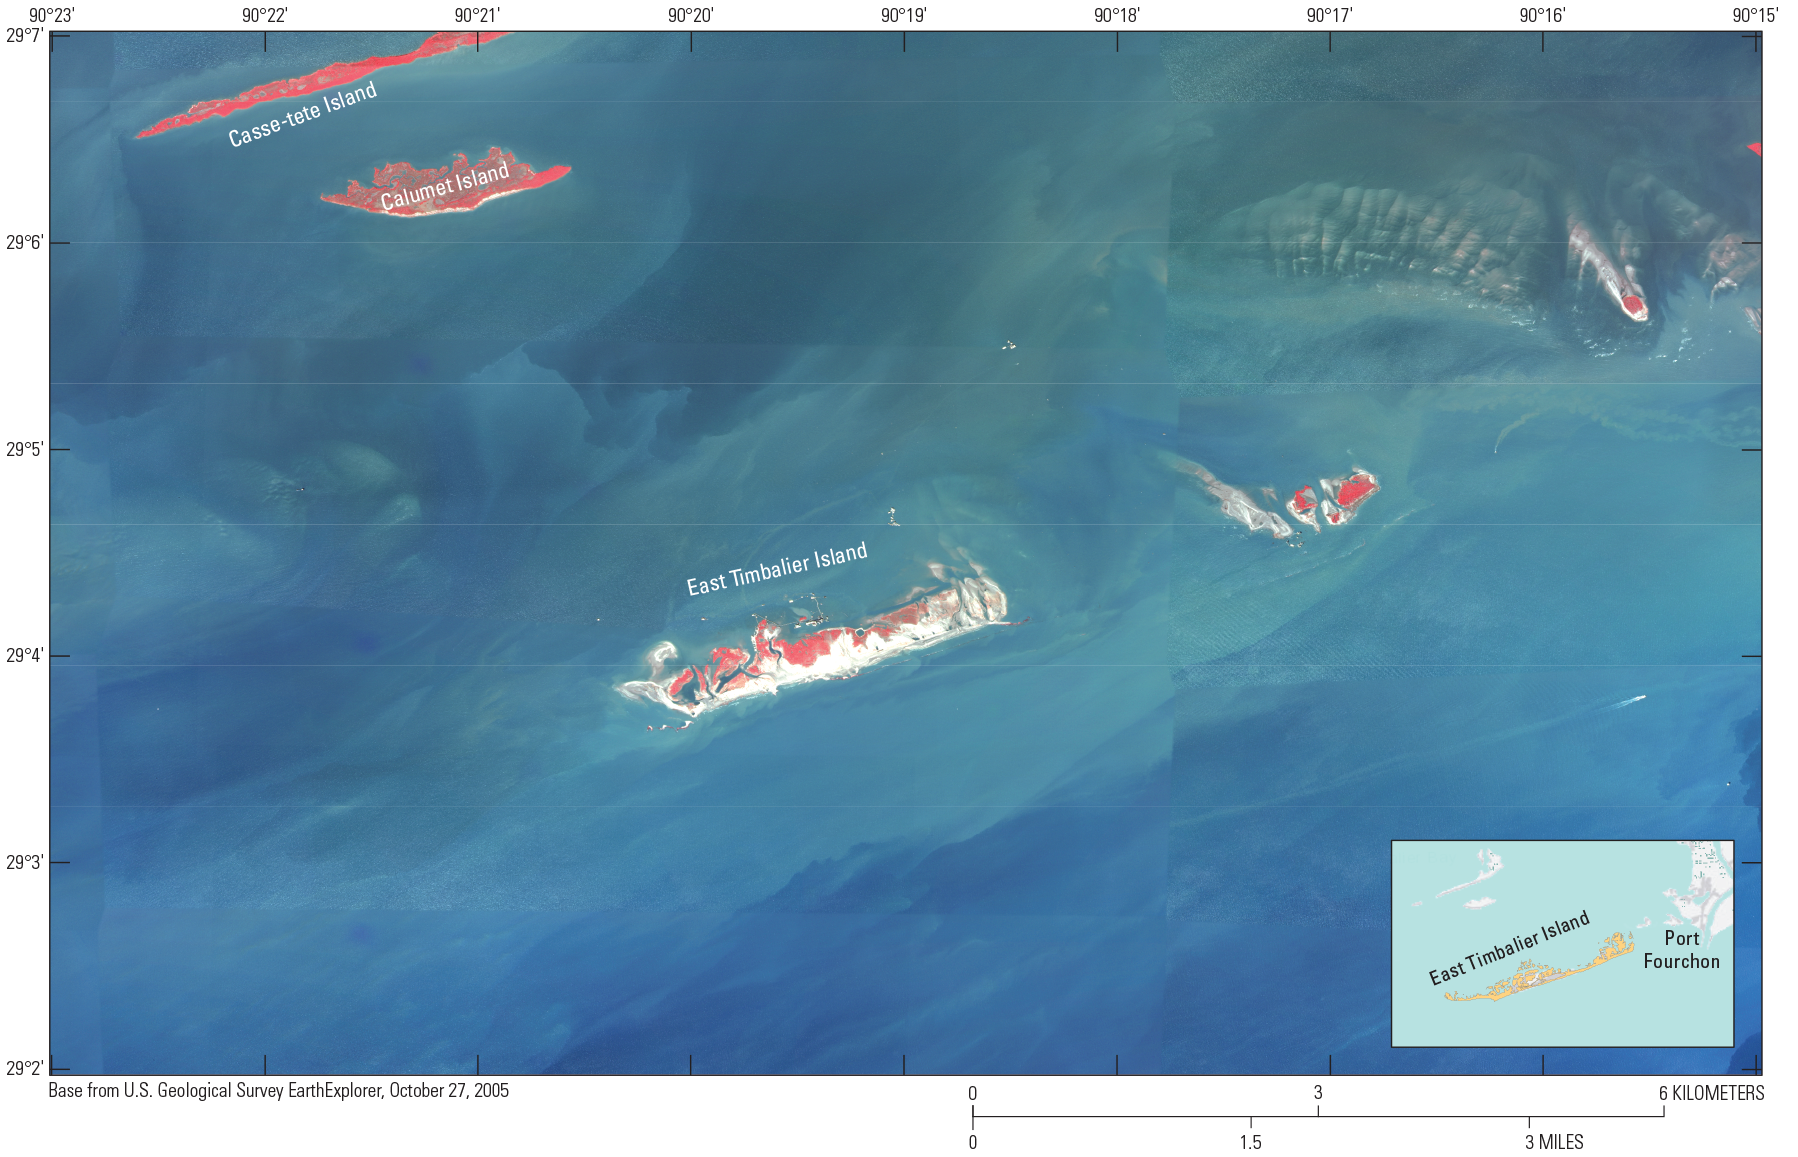
U.S. Army Corps of Engineers aerial photograph of East Timbalier Island, Louisiana, October 27, 2005.
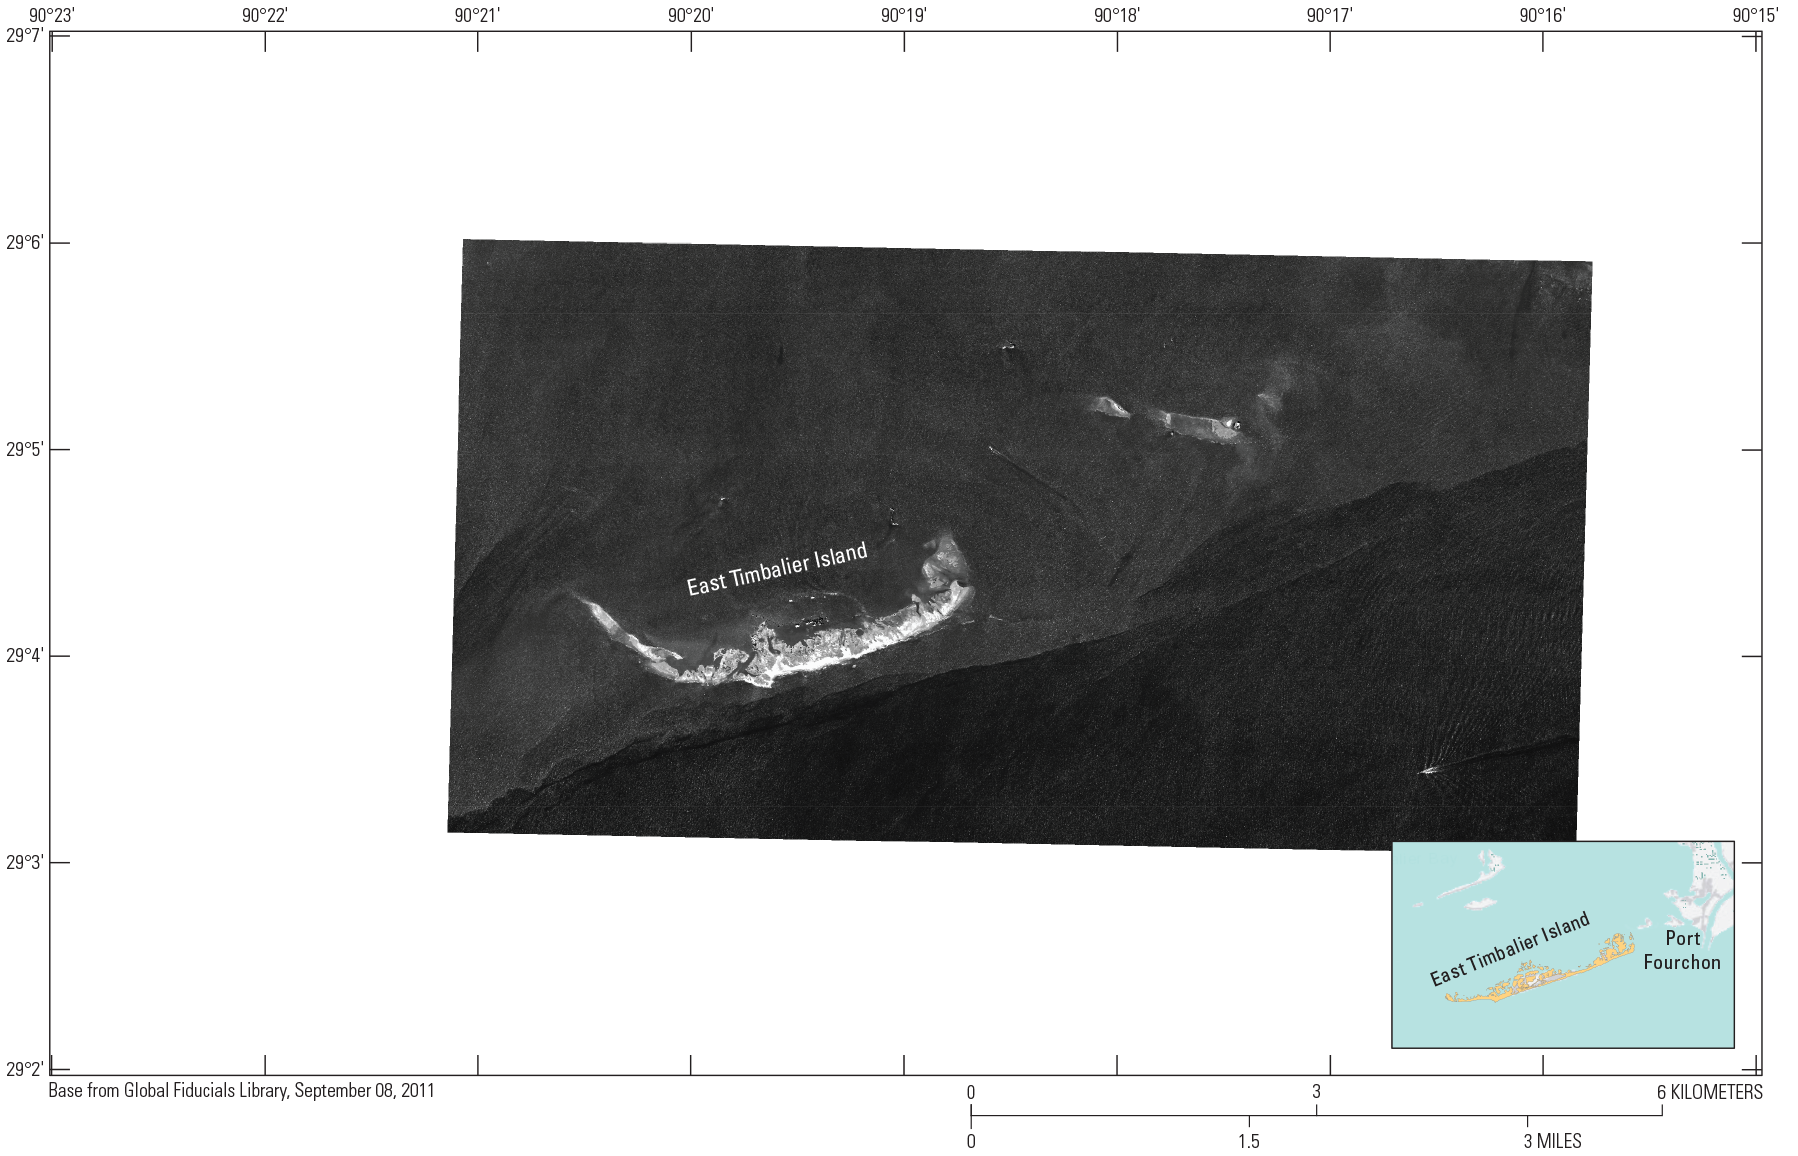
Global Fiducials Library image of East Timbalier Island, Louisiana, September 8, 2011.
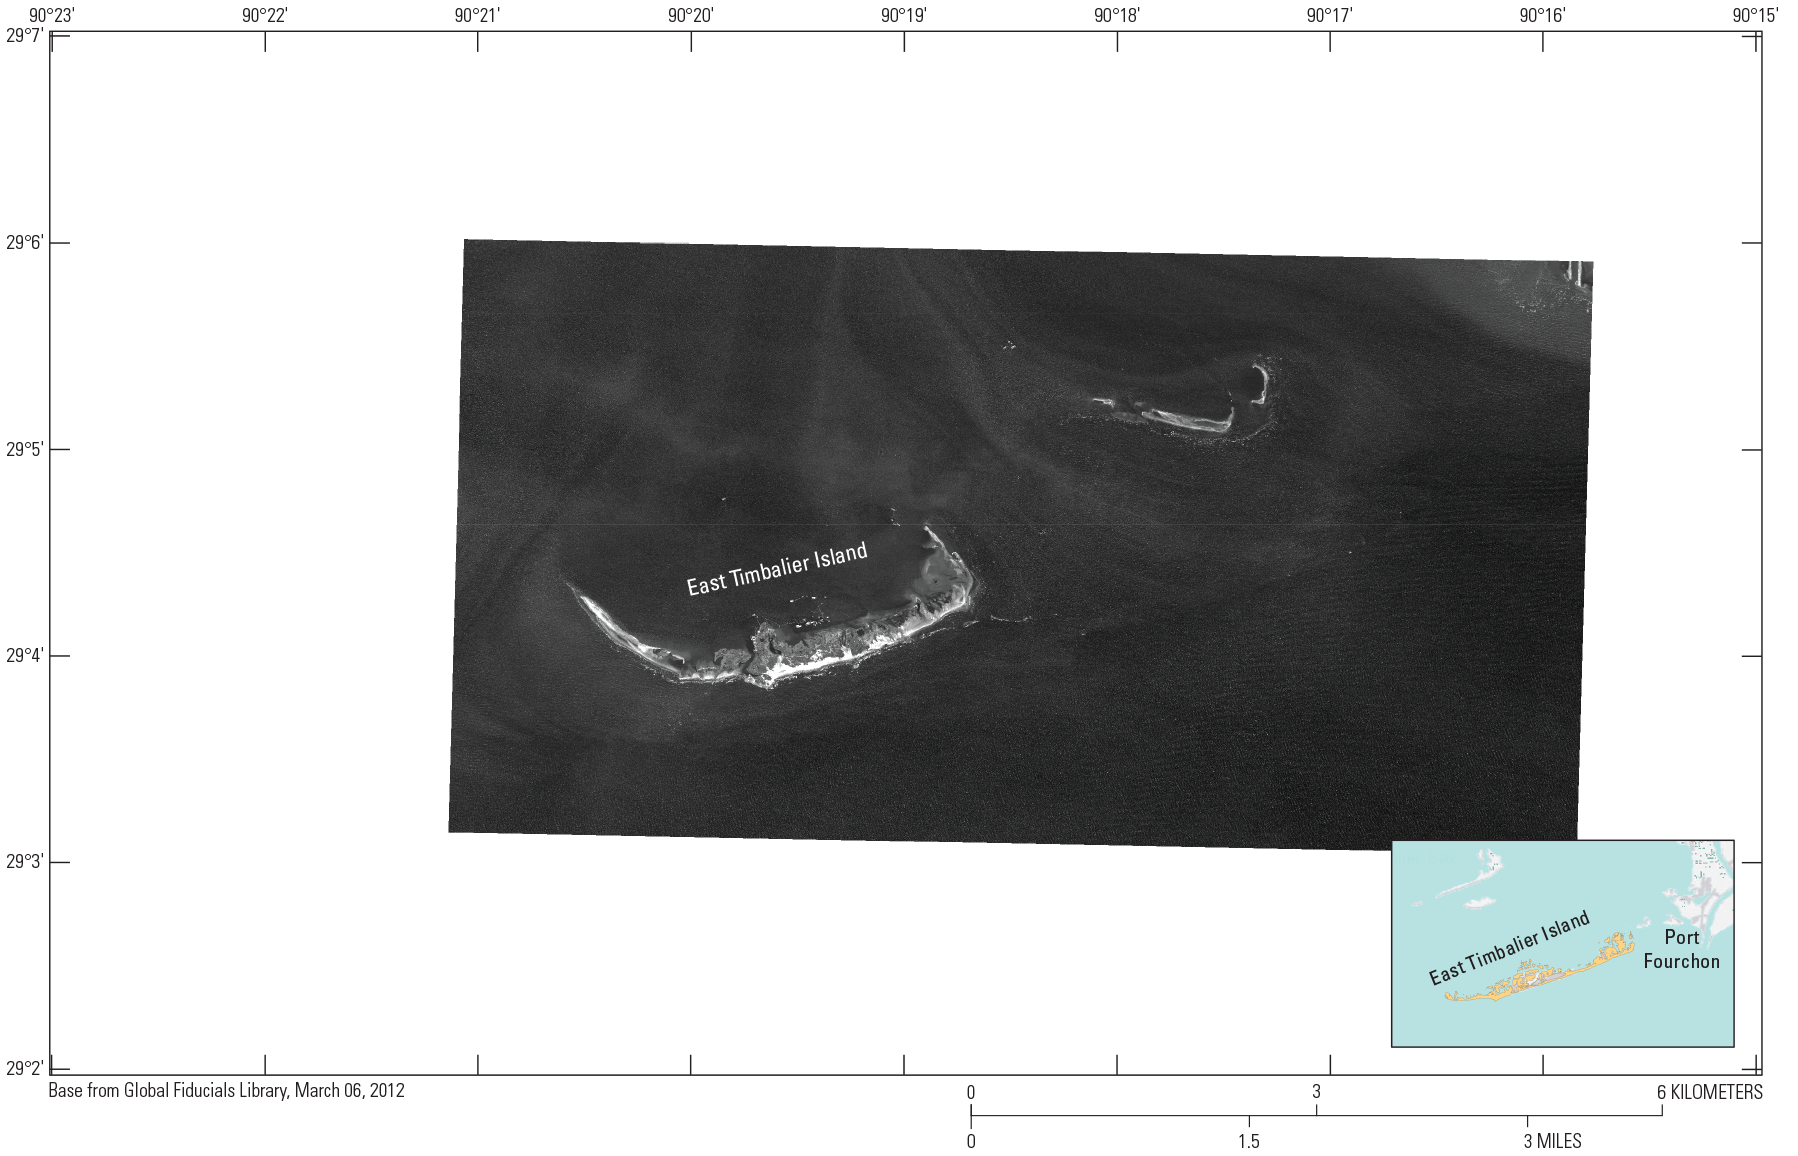
Global Fiducials Library image of East Timbalier Island, Louisiana, March 6, 2012.
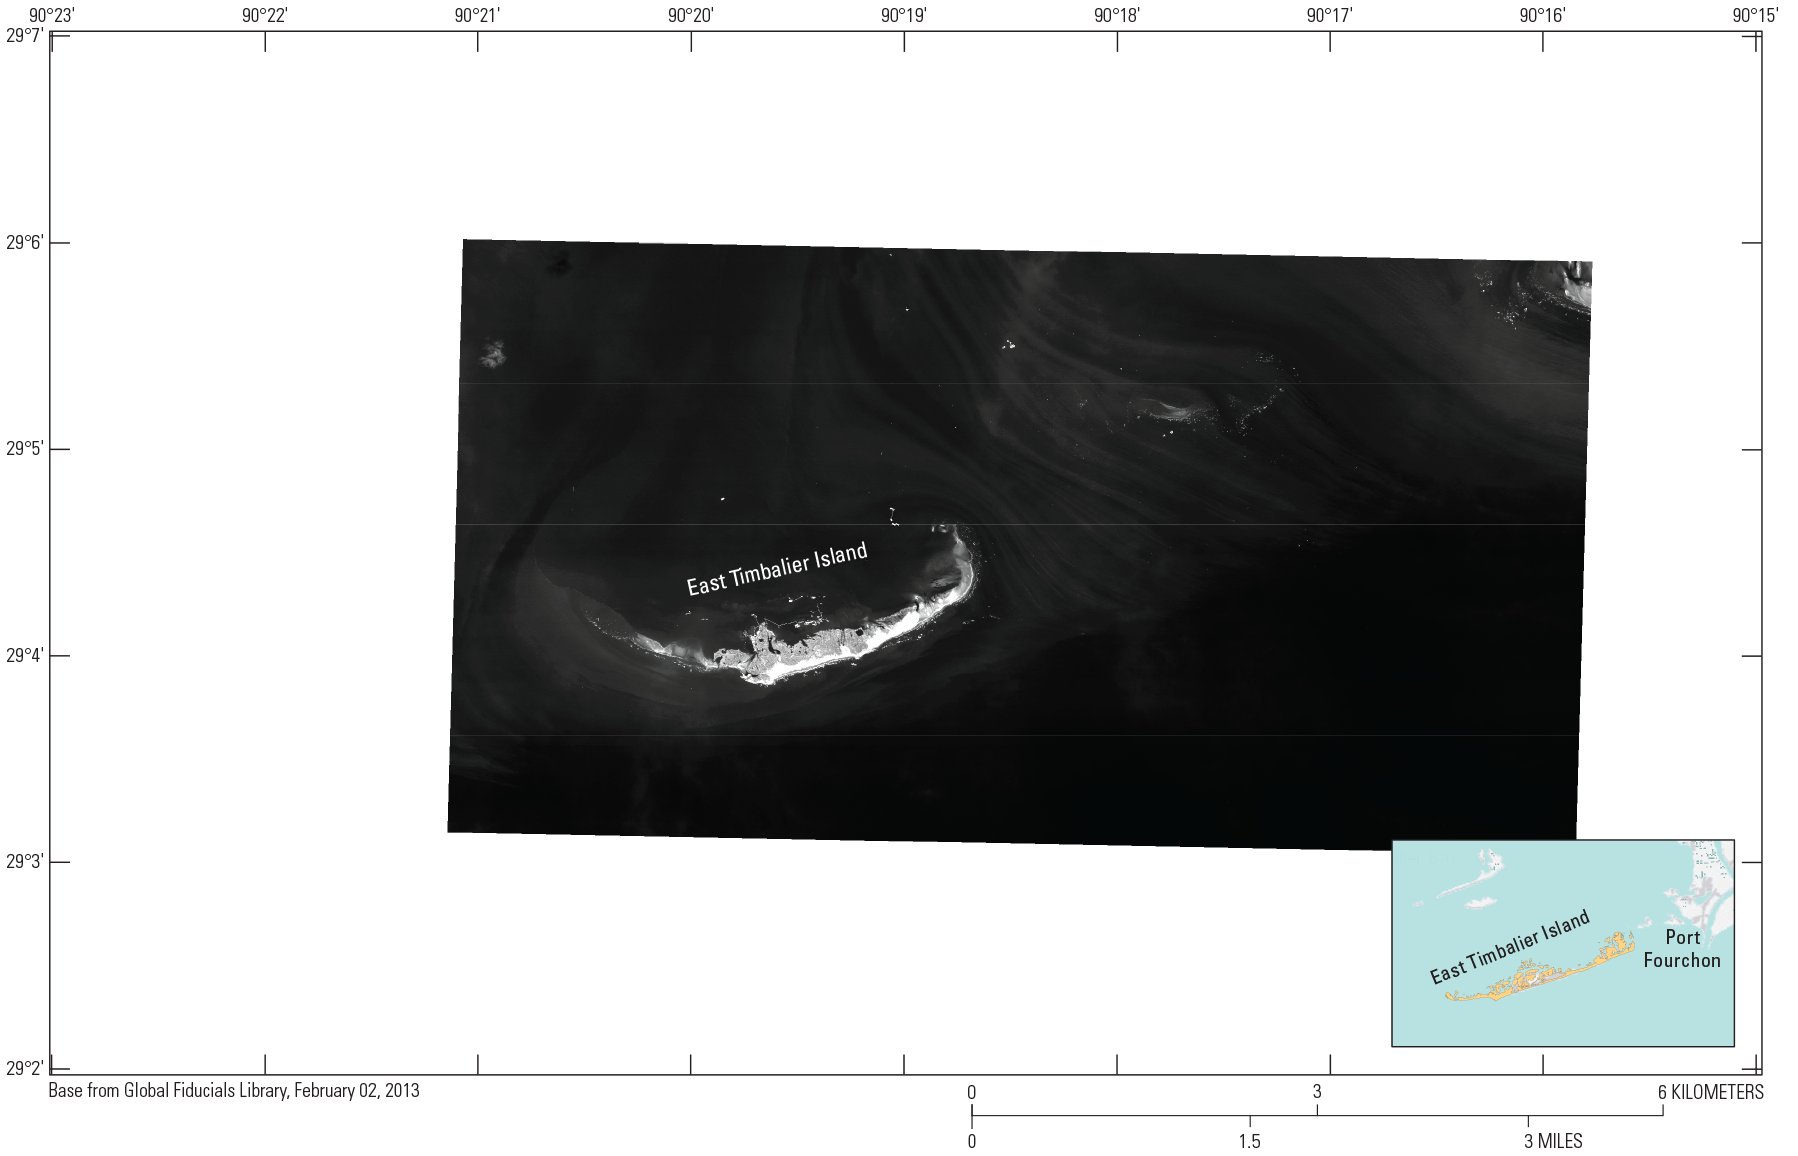
Global Fiducials Library image of East Timbalier Island, Louisiana, February 2, 2013.
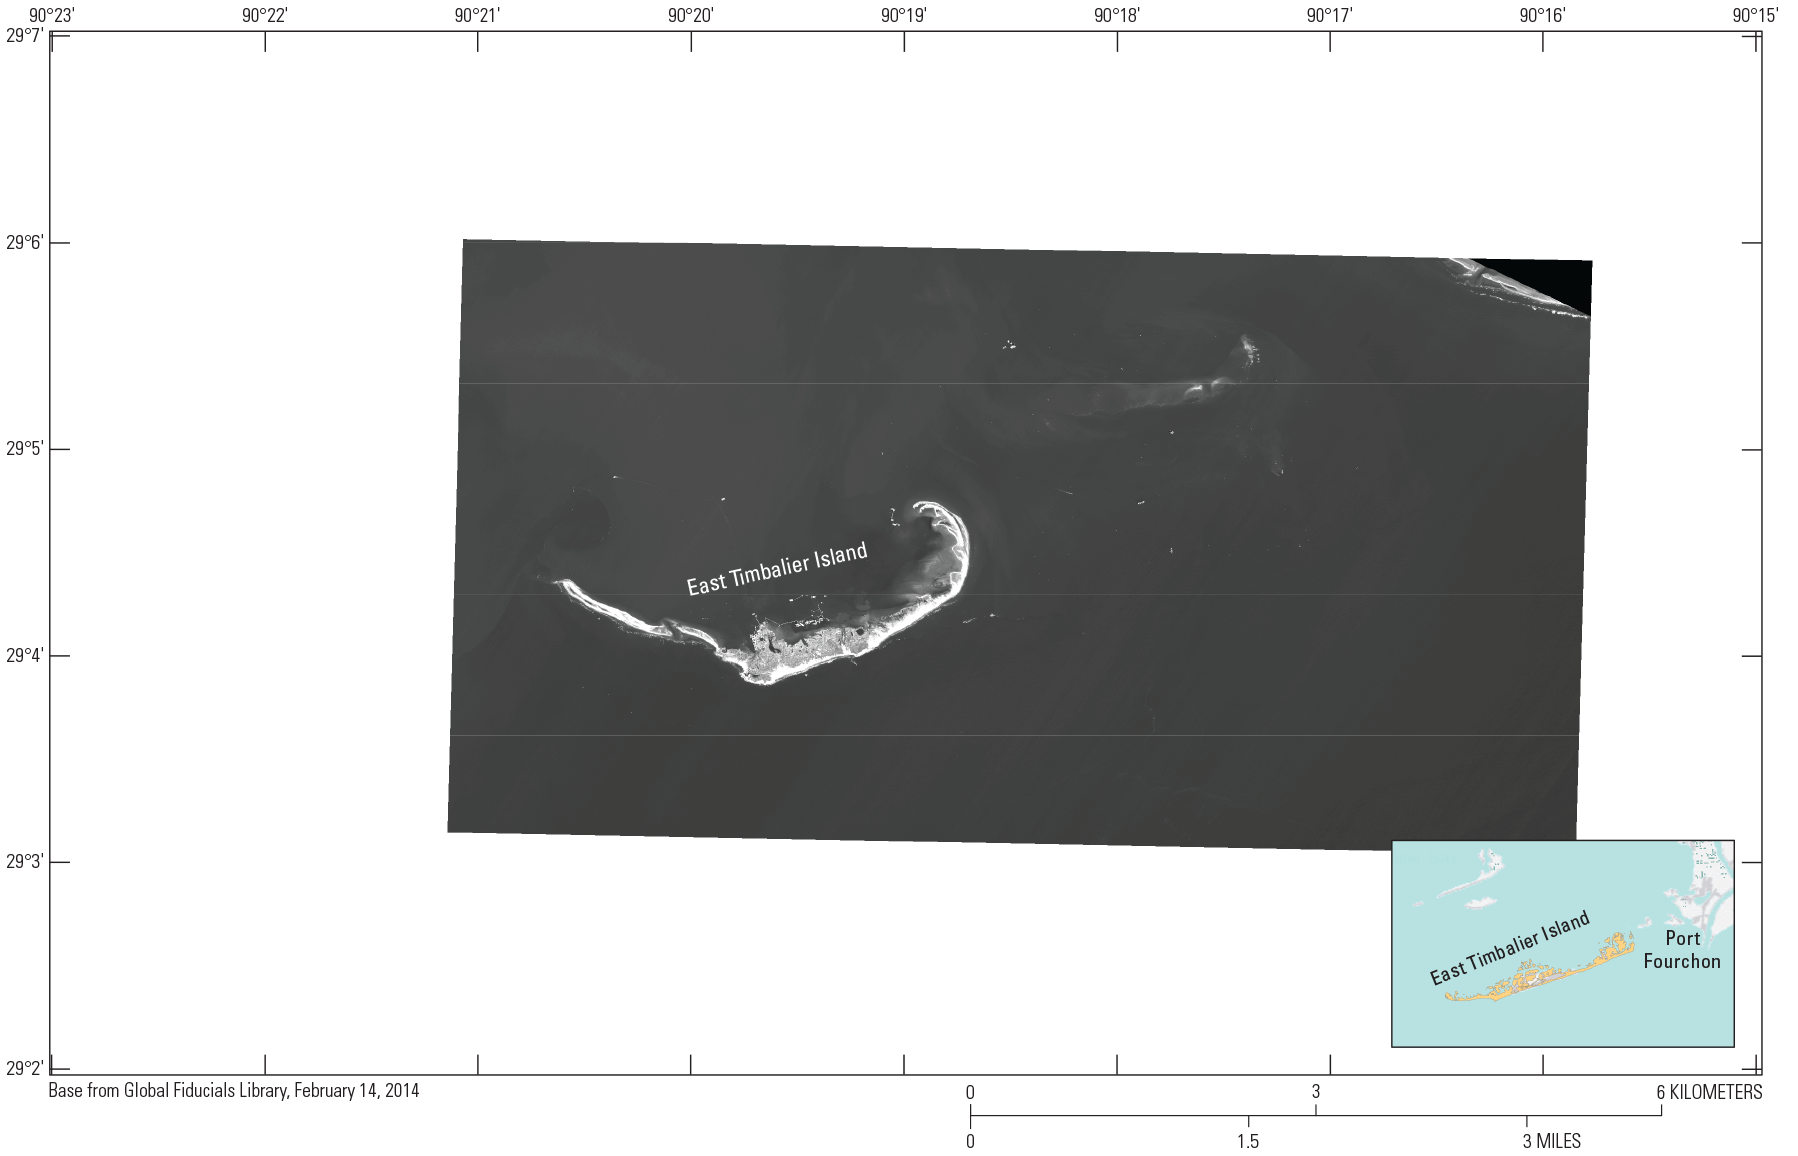
Global Fiducials Library image of East Timbalier Island, Louisiana, February 14, 2014.
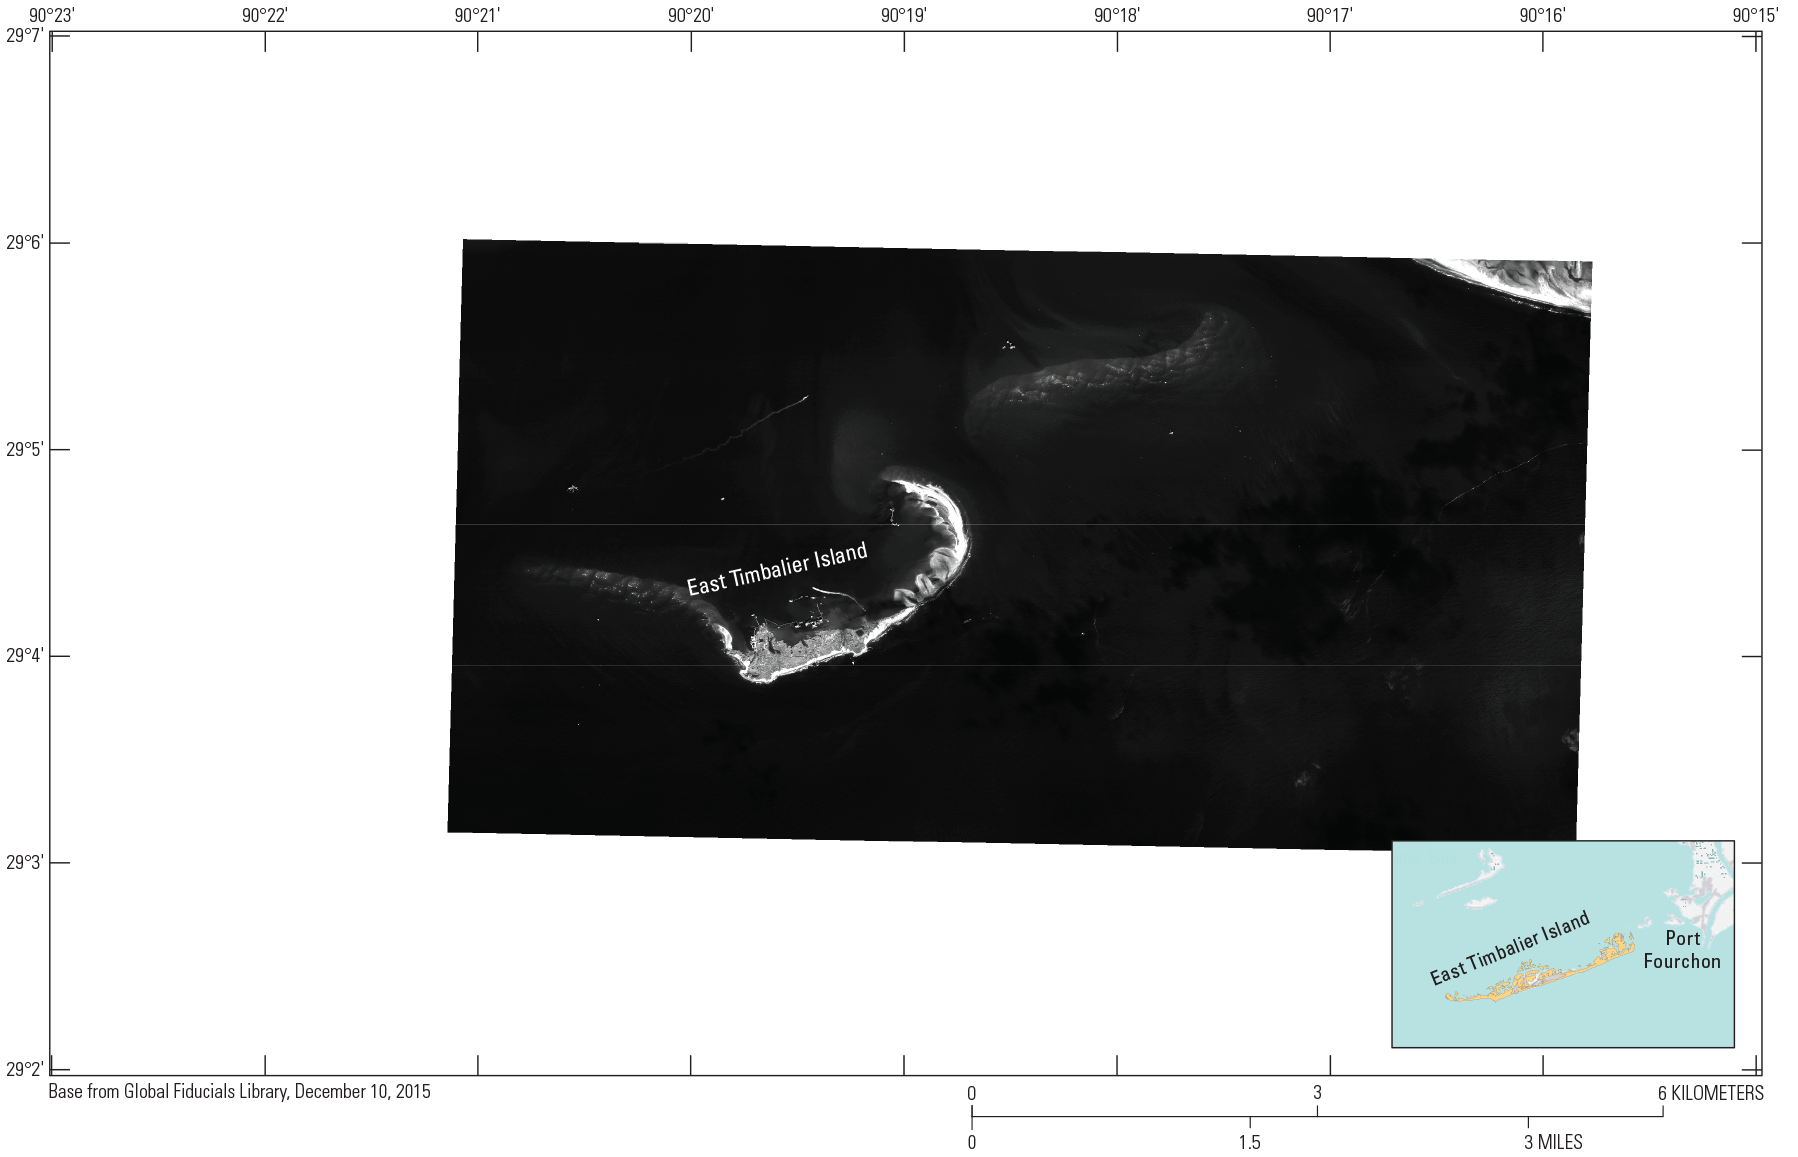
Global Fiducials Library image of East Timbalier Island, Louisiana, December 10, 2015.
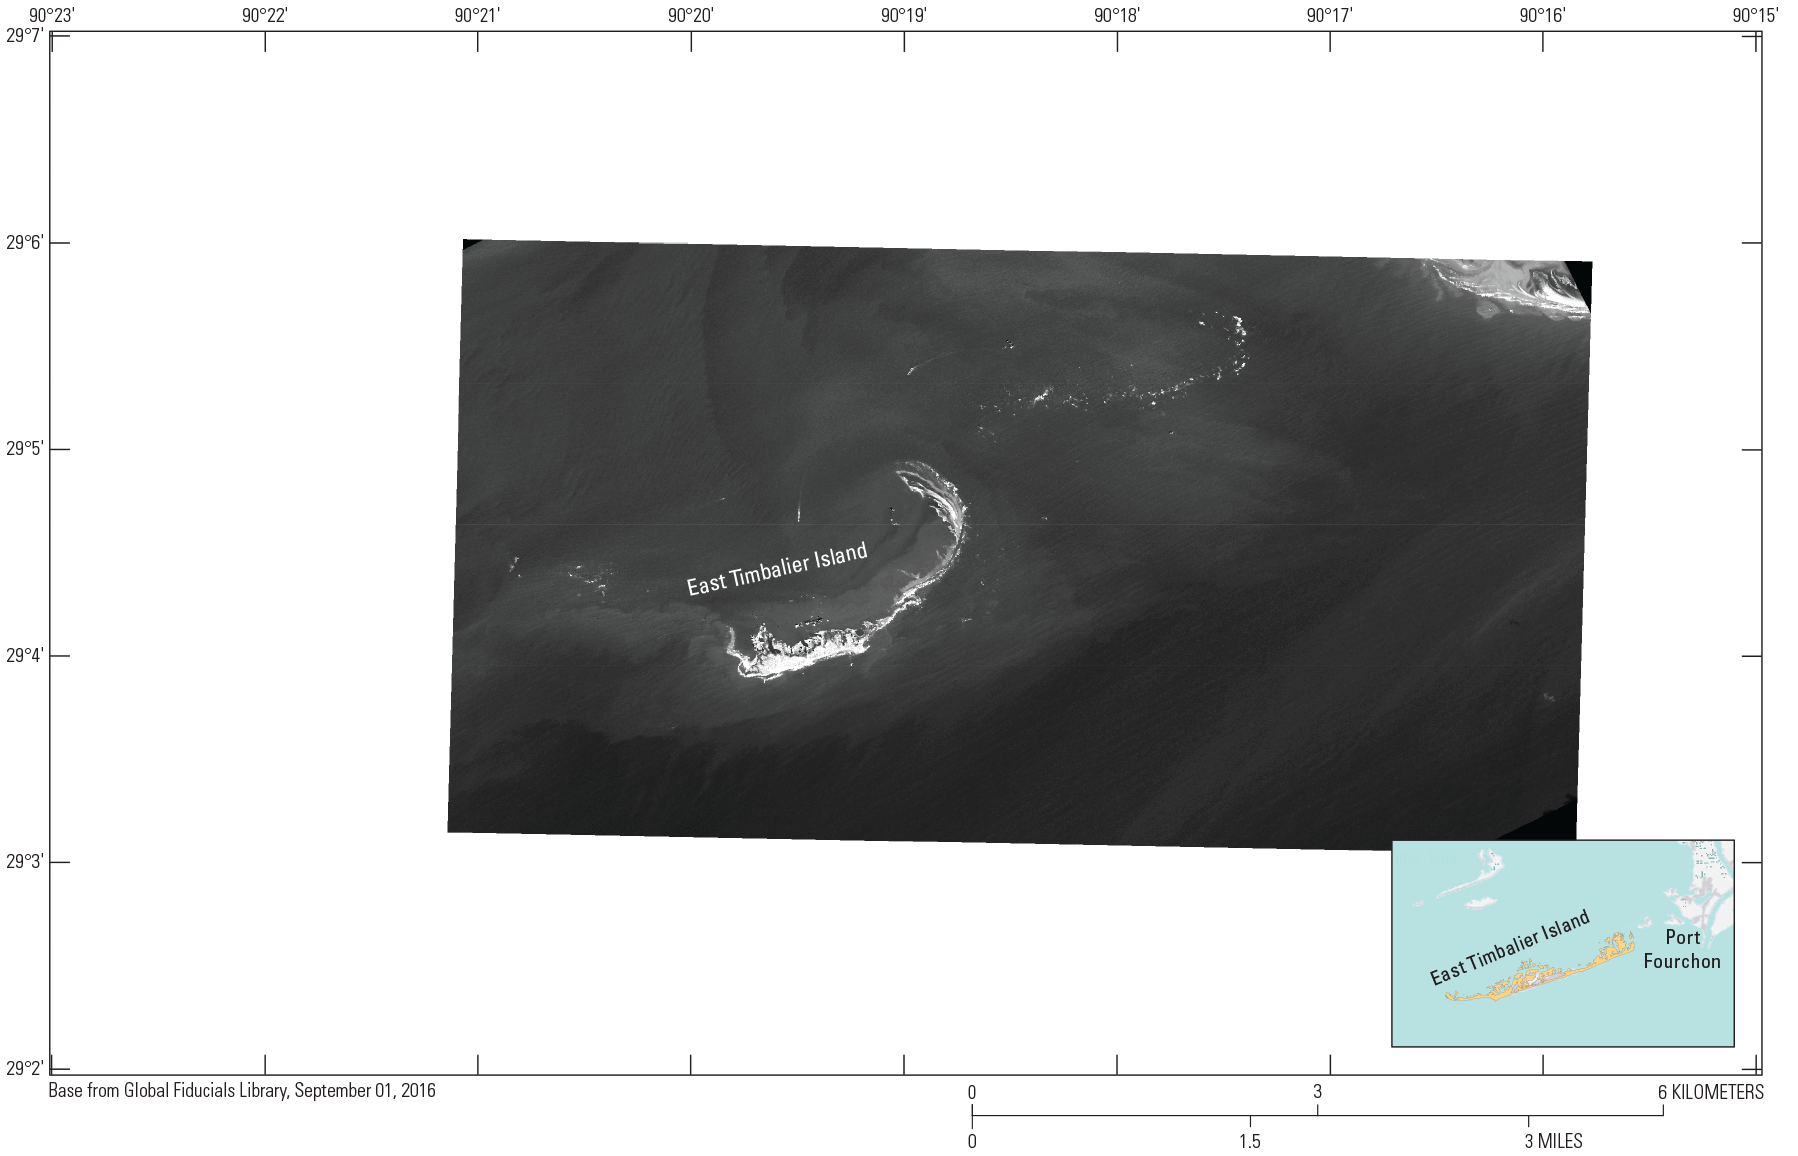
Global Fiducials Library image of East Timbalier Island, Louisiana, September 1, 2016.
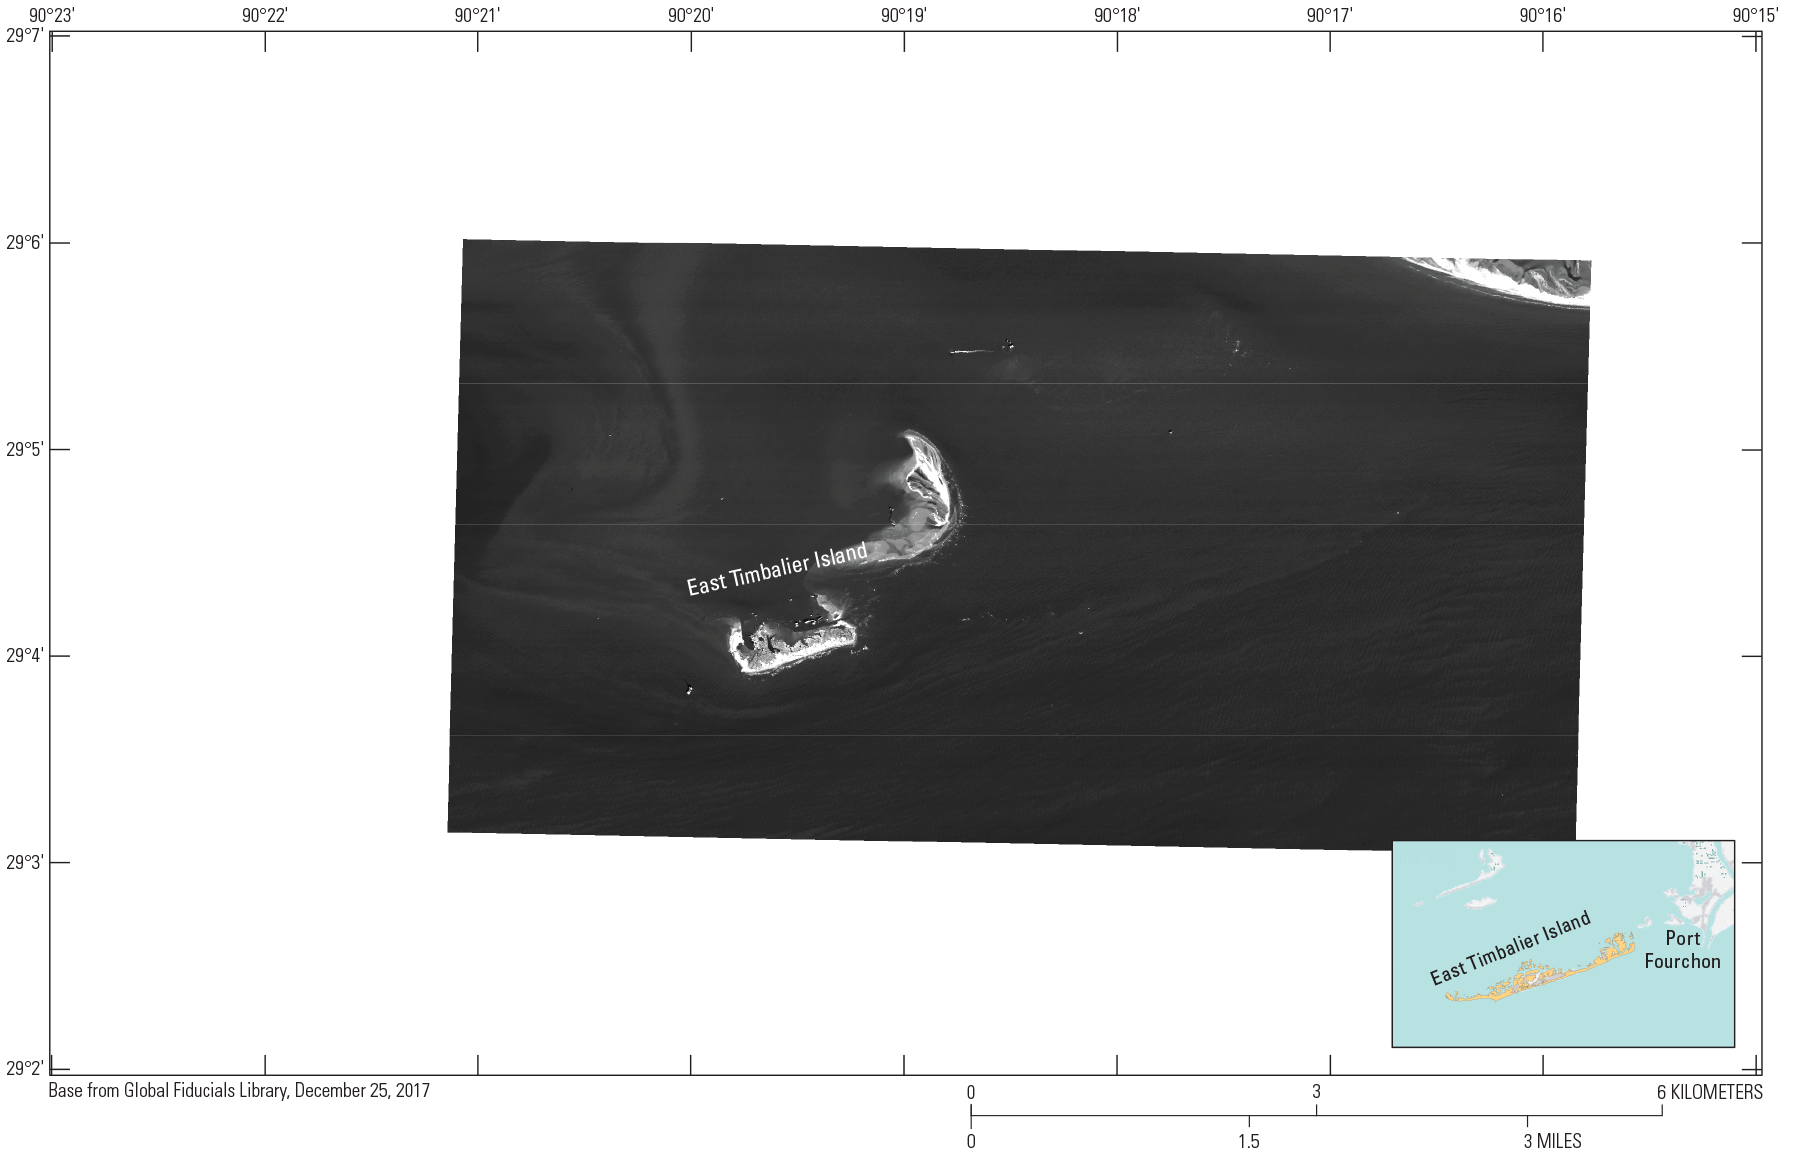
Global Fiducials Library image of East Timbalier Island, Louisiana, December 25, 2017.
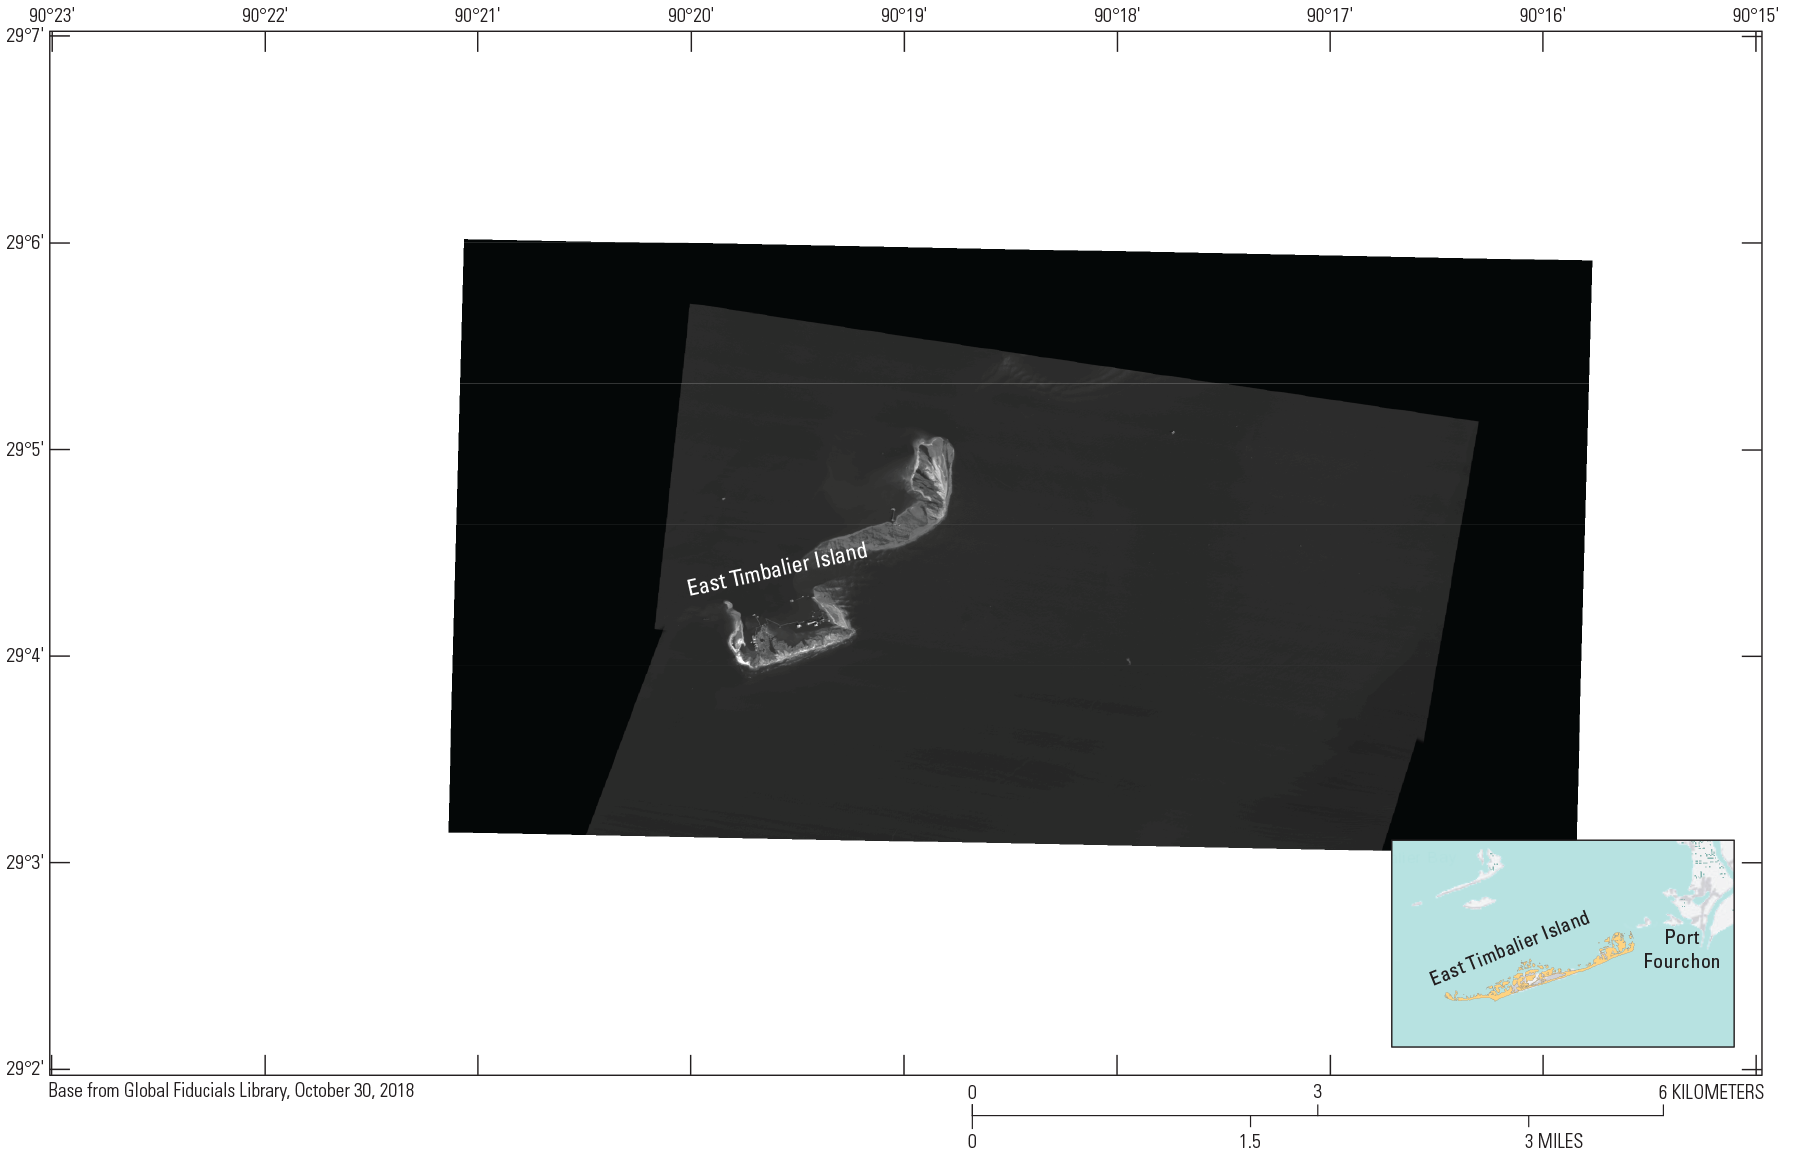
Global Fiducials Library image of East Timbalier Island, Louisiana, October 30, 2018.
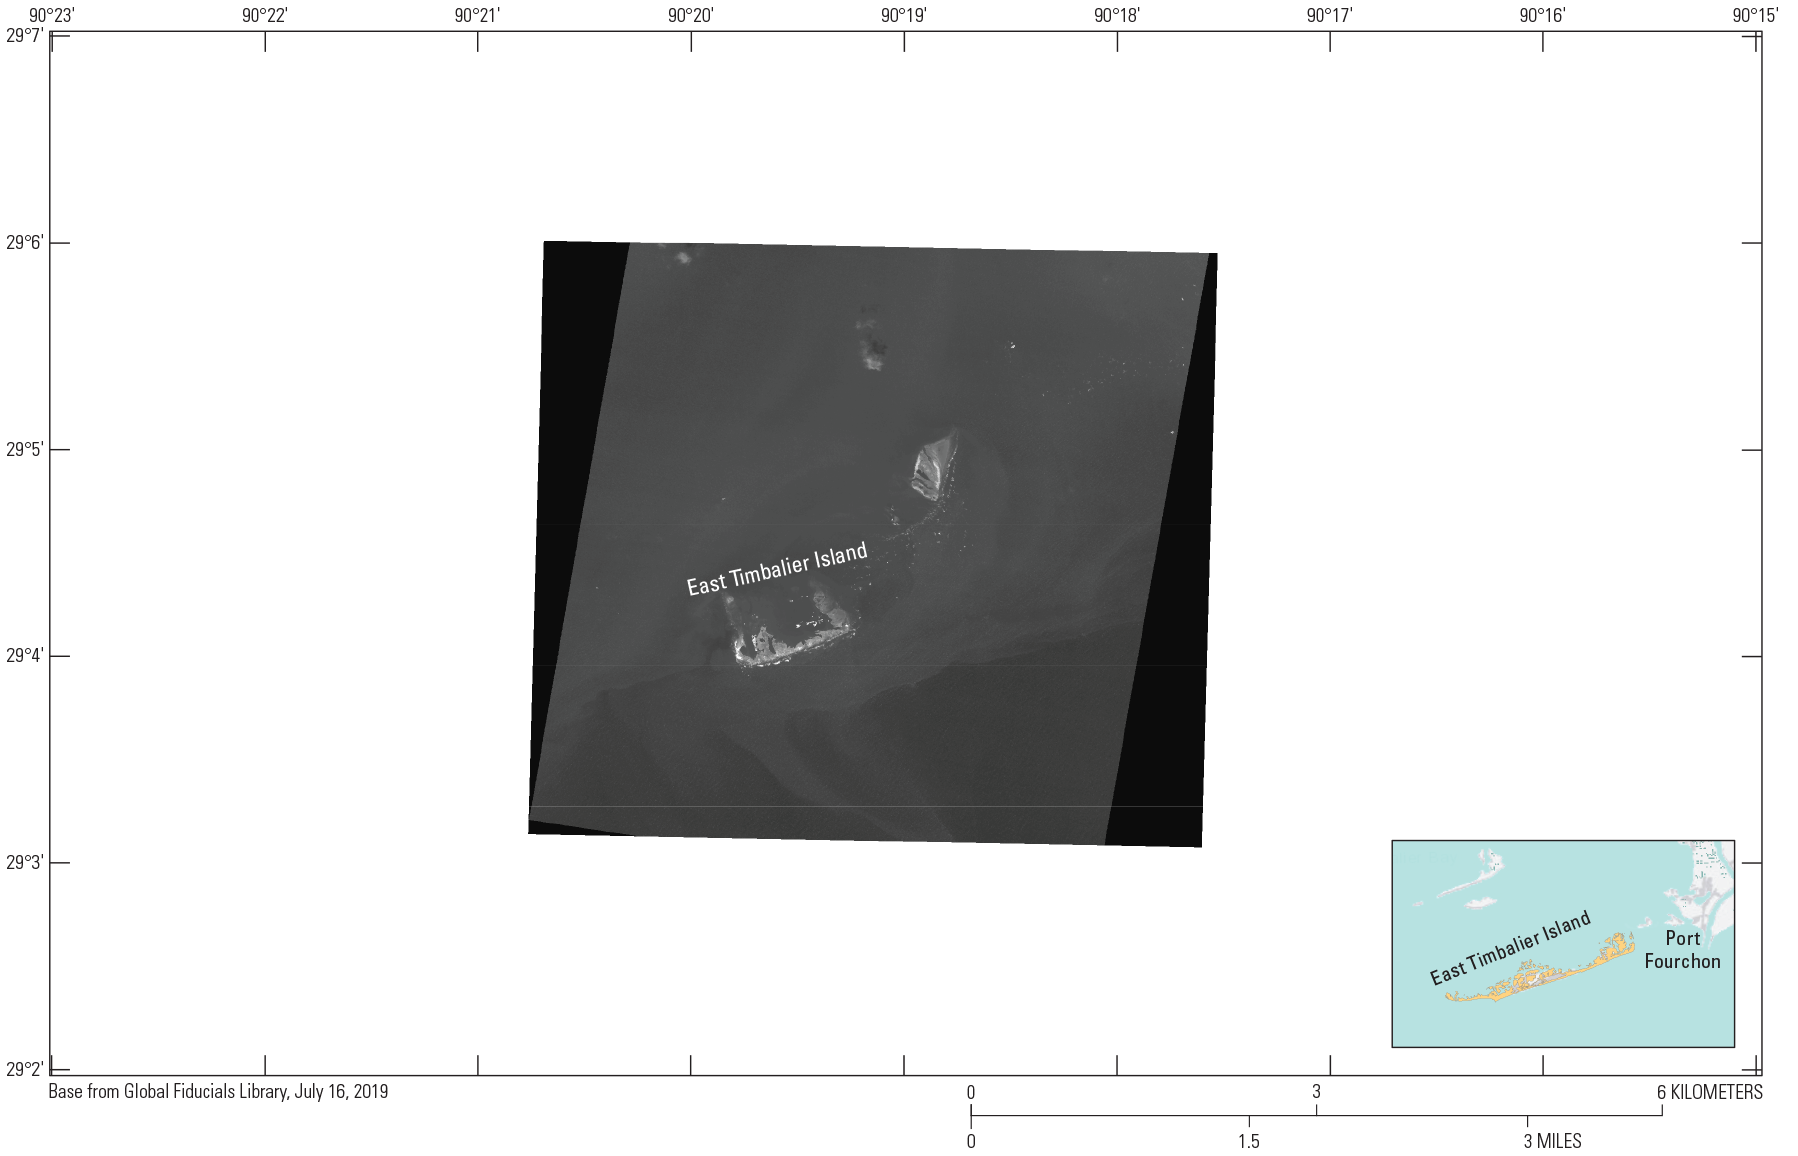
Global Fiducials Library image of East Timbalier Island, Louisiana, July 16, 2019.
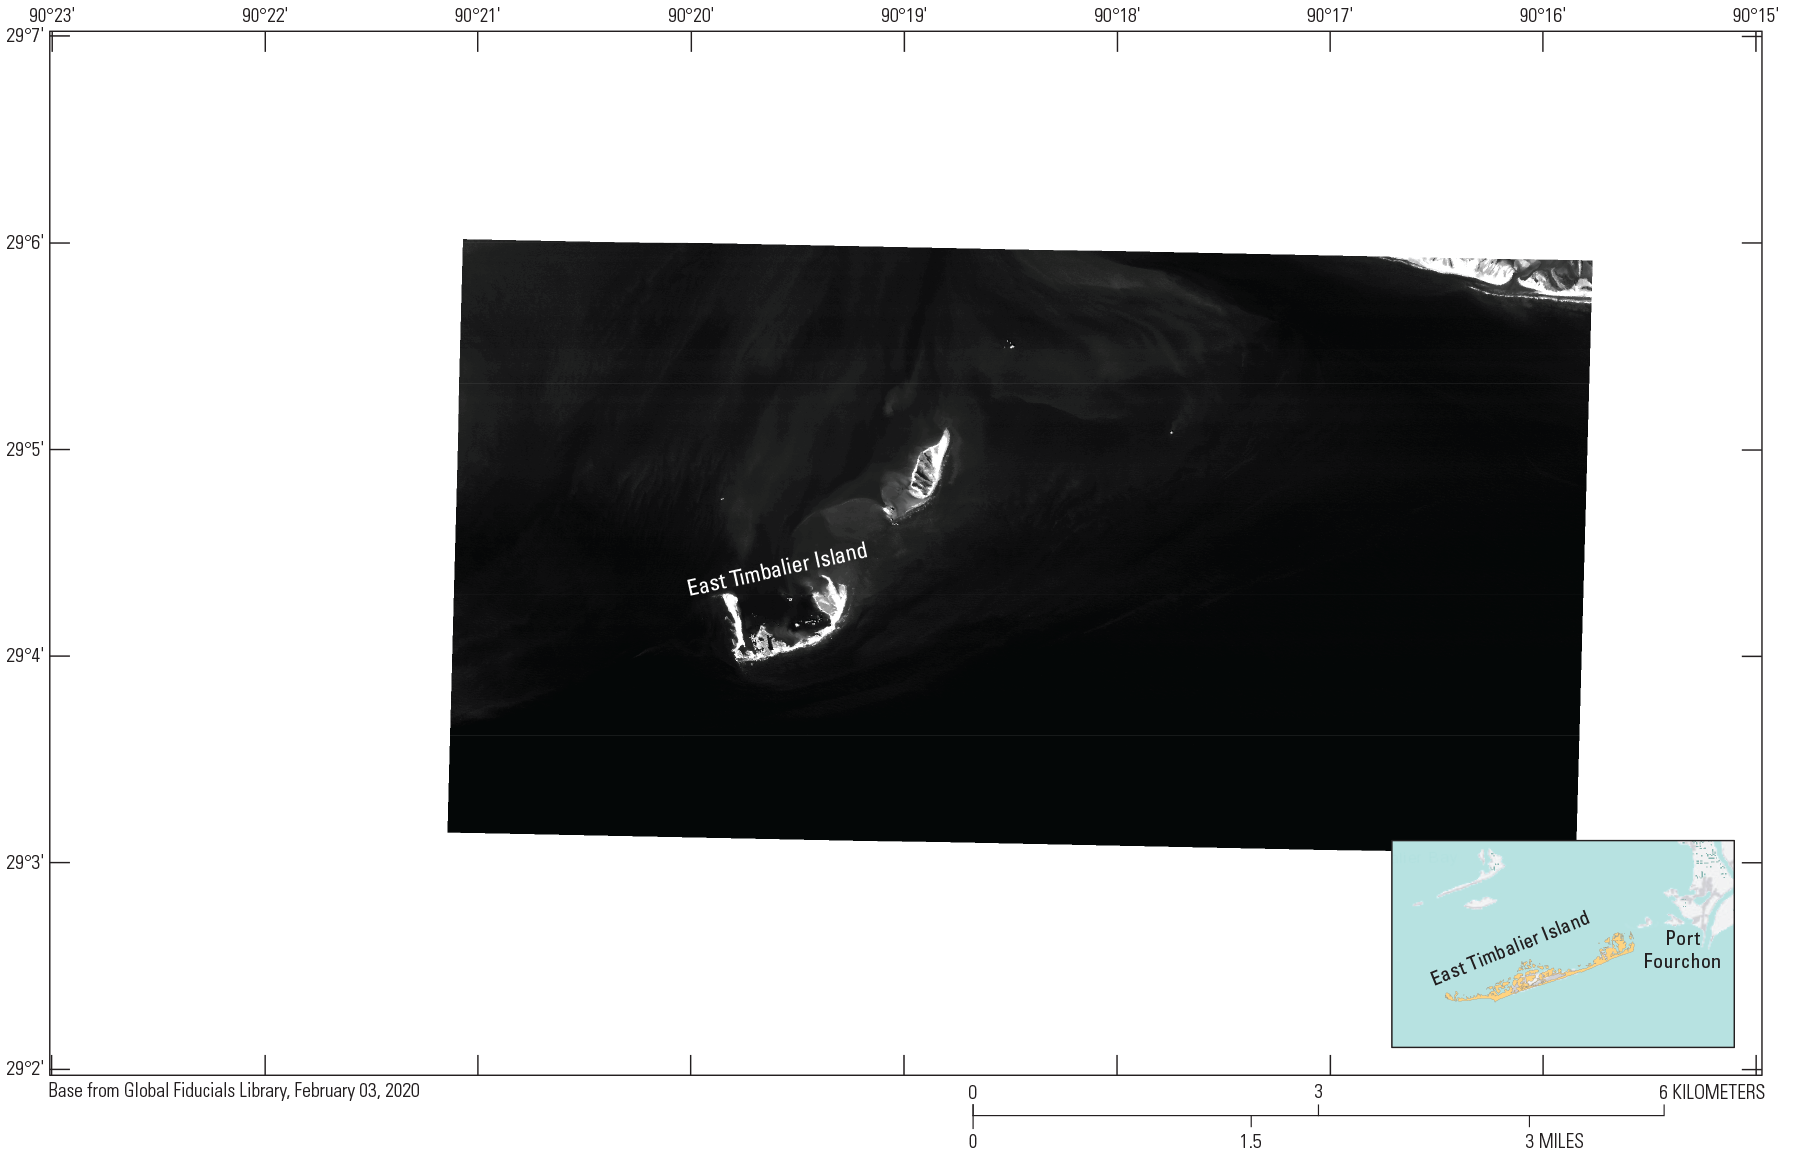
Global Fiducials Library image of East Timbalier Island, Louisiana, February 3, 2020.
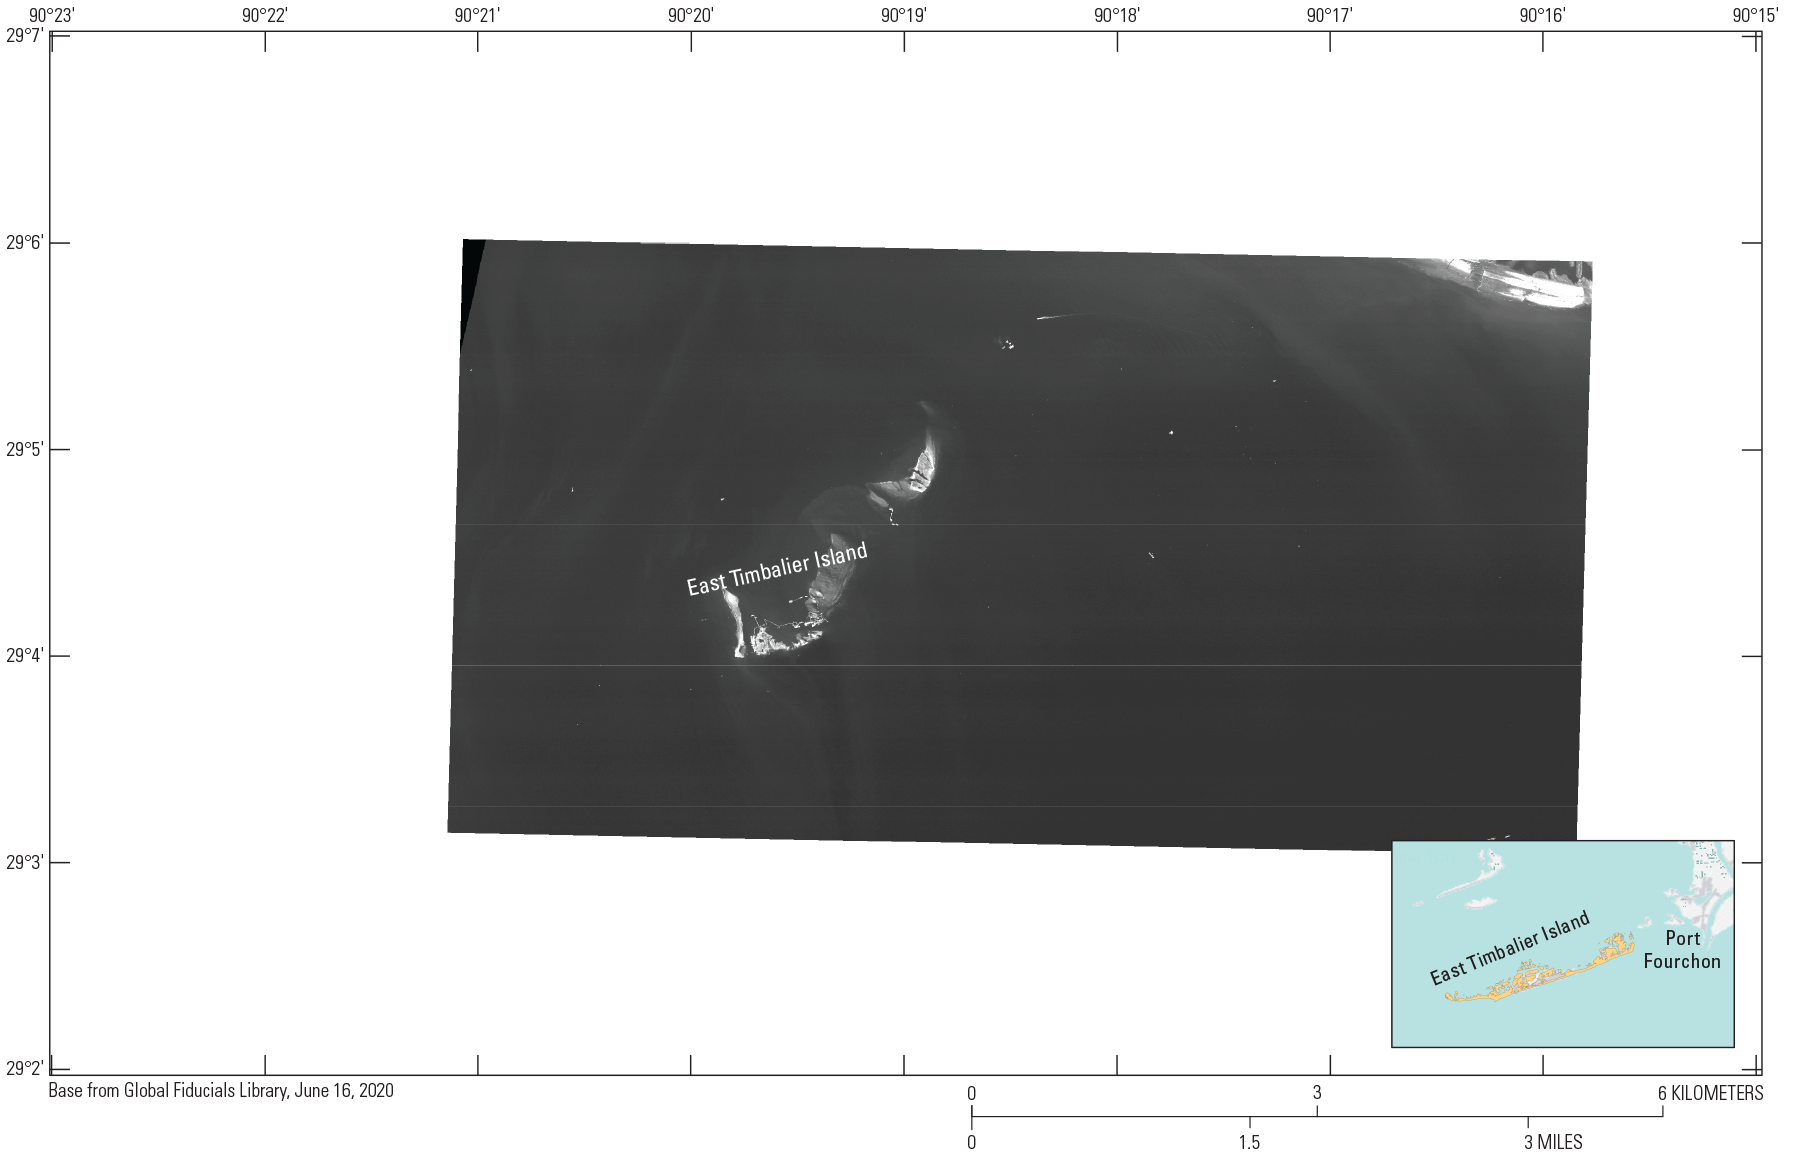
Global Fiducials Library image of East Timbalier Island, Louisiana, June 16, 2020.
National Oceanic and Atmospheric Administration Emergency Response Imagery (NOAA–ERI) for Hurricane Zeta at East Timbalier Island, Louisiana, October 29, 2020.
DigitalGlobe WorldView–3 image of the site of East Timbalier Island, Louisiana, July 19, 2021.
DigitalGlobe WorldView–1 image of the site of East Timbalier Island, Louisiana, September 2, 2021.
DigitalGlobe GeoEye–1 image of the site of East Timbalier Island, Louisiana, September 4, 2021.
Appendix 2. Historical Imagery Data
Table 2.1.
Data on historical imagery of East Timbalier Island, Louisiana, used in this report.[B/W, black and white panchromatic imagery; CIR, color infrared image; CRMS, Coastwide Reference Monitoring System; DOQ, digital orthophoto quadrangle; GOHSEP, Louisiana-Governor’s Office of Homeland Security and Emergency Preparedness; NAPP, National Aerial Photography Program; NARA, National Archives and Records Administration; NASA–JSC, National Aeronautics and Space Administration, Johnson Space Center; NHAP, National High Altitude Photography program; NOAA–ERI, National Oceanic and Atmospheric Administration, Emergency Response Imagery; USACE, U.S. Army Corps of Engineers; USGS–EE, U.S. Geological Survey EarthExplorer. CORONA is the shortened name for the U.S. CORONA satellite program. HEXAGON is a shortened name for the U.S. KH–9 HEXAGON satellite system]
Atlas is a data distribution system hosting a variety of publicly available geographic information system datasets for the State of Louisiana (https://atlas.ga.lsu.edu/).
Appendix 3. Global Fiducials Library Imagery Dates
Table 3.1.
Dates of Global Fiducials Library (GFL) images of East Timbalier Island, Louisiana, used in this report. These images are available through the Global Fiducials Library Data Access Portal (https://www.usgs.gov/global-fiducials-library-data-access-portal). All GFL images are black and white panchromatic.Appendix 4. DigitalGlobe Satellite Imagery Data
Table 4.1.
Dates of acquisition for satellite images of East Timbalier Island, Louisiana, and the DigitalGlobe sensor system used to acquire the images. Systems include GeoEye–1, QuickBird–1 and –2, and WorldView–1, –2, and –3.[QB–1, QuickBird–1; QB–2, QuickBird–2]
Appendix 5. Landsat Satellite Imagery Data
Table 5.1.
Landsat satellite image data for listed acquisition dates. Images are available at the U.S. Geological Survey (USGS) EarthExplorer website (https://earthexplorer.usgs.gov) (USGS, 2021).[For assistance using the table data to locate these images, refer to the USGS EarthExplorer Help Index (https://www.usgs.gov/centers/eros/science/earthexplorer-help-index)]
Appendix 6. Sentinel–2 Imagery Data
Table 6.1.
Sentinel–2 satellite image data for listed acquisition dates. Images are available at the U.S. Geological Survey (USGS) EarthExplorer website (https://earthexplorer.usgs.gov) (USGS, 2021).[For assistance using the table data to locate these images, refer to the USGS EarthExplorer Help Index (https://www.usgs.gov/centers/eros/science/earthexplorer-help-index)]
Abbreviations
BICM
Barrier Island Comprehensive Monitoring
CWPPRA
Coastal Wetlands Planning, Protection and Restoration Act
DOQ
digital orthophoto quadrangle
GFL
Global Fiducials Library
GFP
Global Fiducials Program
GSD
ground sample distance
ha
hectare
km
kilometer
km2
square kilometer
m
meter
m2
square meter
NAD 83
North American Datum of 1983
NAPP
National Aerial Photography Program
NCAC
National Civil Applications Center
NGVD 29
National Geodetic Vertical Datum of 1929
NHAP
National High Altitude Photography
NOAA
National Oceanic and Atmospheric Administration
NOAA–ERI
National Oceanic and Atmospheric Administration Emergency Response Imagery
TD
tropical depression
TS
tropical storm
UTM
Universal Transverse Mercator
USNIS
U.S. National Imaging Systems
USGS
U.S. Geological Survey
For more information, contact
Director
USGS National Civil Applications Center
12201 Sunrise Valley Drive, MS 562
Reston, VA 20192
703–648–4493
For additional information visit https://www.usgs.gov/programs/national-land-imaging-program
Publishing support provided by the Reston Publishing Service Center
Edited by Stokely J. Klasovsky
Layout by Jeffrey L. Corbett
Disclaimers
Any use of trade, firm, or product names is for descriptive purposes only and does not imply endorsement by the U.S. Government.
Although this information product, for the most part, is in the public domain, it also may contain copyrighted materials as noted in the text. Permission to reproduce copyrighted items must be secured from the copyright owner.
Suggested Citation
Fisher, G.B., Slonecker, E.T., Dilles, S.J., Molnia, B.F., and Angeli, K.M., 2023, Using Global Fiducials Library high-resolution imagery, commercial satellite imagery, Landsat and Sentinel satellite imagery, and aerial photography to monitor change at East Timbalier Island, Louisiana, 1953–2021 (ver. 1.1, May 2023): U.S. Geological Survey Scientific Investigations Report 2022–5107, 61 p., https://doi.org/10.3133/sir20225107.
ISSN: 2328-0328 (online)
ISSN: 2328-031X (print)
Study Area
| Publication type | Report |
|---|---|
| Publication Subtype | USGS Numbered Series |
| Title | Using Global Fiducials Library high-resolution imagery, commercial satellite imagery, Landsat and Sentinel satellite imagery, and aerial photography to monitor change at East Timbalier Island, Louisiana, 1953–2021 |
| Series title | Scientific Investigations Report |
| Series number | 2022-5107 |
| ISBN | 978-1-4113-4511-9 |
| DOI | 10.3133/sir20225107 |
| Edition | Version 1.0: January 2023; Version 1.1: May 2023 |
| Publication Date | January 20, 2023 |
| Year Published | 2023 |
| Language | English |
| Publisher | U.S. Geological Survey |
| Publisher location | Reston, VA |
| Contributing office(s) | National Civil Applications Center |
| Description | Report: vii, 61 p.; Data Release |
| Country | United States |
| State | Louisiana |
| Other Geospatial | East Timbalier Island |
| Online Only (Y/N) | N |
| Additional Online Files (Y/N) | N |