

Status and Trends of Total Nitrogen and Total Phosphorus Concentrations, Loads, and Yields in Streams of Mississippi, Water Years 2008–18
Links
- Document: Report (7.56 MB pdf) , HTML , XML
- Dataset: USGS National Water Information System database —USGS water data for the Nation
- Data Release: USGS data release - Datasets of streamflow, nutrient concentrations, loads and trends for the Mississippi Ambient Water-Quality Network stations, water years 2008 through 2018
- NGMDB Index Page: National Geologic Map Database Index Page (html)
- Download citation as: RIS | Dublin Core
Abstract
To assess the status and trends of conditions of surface waters throughout Mississippi, the U.S. Geological Survey, in cooperation with the Mississippi Department of Environmental Quality (MDEQ), summarized concentrations and estimated loads, yields, trends, and spatial and temporal patterns of total nitrogen (TN) and total phosphorus (TP) at 20 stream sites in MDEQ’s ambient water-quality monitoring network and 2 stream sites in the U.S. Geological Survey’s National Water-Quality Assessment Project’s monitoring network.
Comparison of streamflow at the time of water-quality sample collection to flow-duration curves for each site showed that samples were relatively evenly spread over a wide range of flows, indicating that load estimations were representative of a wide range of flows. Relation of streamflow to concentrations of TN and TP varied among sites and land use. Sites with high agriculture land use in the drainage basin tended to have a positive correlation between streamflow and concentration, suggesting influence of event-driven nonpoint-source runoff. Sites near urban (developed) areas tended to have a negative correlation between streamflow and concentration, suggesting chronic point-source influences during low-flow conditions. Sites with high forest land use and lower agriculture and urban (developed) land use showed little to no association between streamflow and concentration.
Seasonal distributions of concentrations of TN and TP also corresponded closely with variations in land use. Sites near urban (developed) land had the highest concentrations in late summer and fall, sites with a high percentage of agricultural land had the highest concentrations in the spring, and sites that were primarily forested or with little developed land did not exhibit substantial changes in concentration across seasons.
Eight sites had statistical likelihoods for upward trends of TN loads, and seven sites had statistical likelihoods for downward trends. Trends in TN loads at six sites were considered “about as likely as not,” meaning that a site has an equal chance of having an upward or downward trend. Trend results of mean annual flow-normalized loads of TP for the period of analysis (2008–18) showed that 16 sites had upward trends, 3 sites had downward trends, and 2 sites were considered “about as likely as not.”
Results from our study were compared to results from existing regional models to assess accuracy of predictions at a local scale. Comparisons of yields predicted from 2012 regional-scale SPAtially Referenced Regressions on Watershed attributes (SPARROW) to results from this study showed the 2012 SPARROW-predicted estimates varied in consistency with results from this study. The 2012 SPARROW-prediction model underestimated TN yields, more often and by a slightly larger degree, more than it overestimated TN yields. The 2012 SPARROW-predicted model tended to underestimate yields at study sites with higher yields. All four sites in the predominantly agricultural area of northwest Mississippi, locally known as the Mississippi Delta, were underestimated by 2012 SPARROW. For TP, yield comparisons at sites with lower yields were consistent, yields at sites with midrange yields tended to be overestimated by SPARROW, and yields at sites with high yields tended to be underestimated by SPARROW. TP yields at four sites in the Mississippi Delta were underestimated by the 2012 SPARROW-predicted model.
Results of select sites from our study were also compared to other published load estimates from an earlier time period to evaluate possible trends. Comparison of TN yields at four sites and TP yields at three sites from the study-derived estimates to estimates made from data spanning 1993–2004 showed decreasing TN yields at all four sites and decreasing TP yields at two of three sites, with increasing yields of TP at the Yazoo River lower site. Also, a third comparison of the TN and TP yields of the Yazoo River lower site of this study to estimates made from data spanning 1996–97 showed decreasing TN yields but similar TP yields. This suggests that TN yields may have decreased over the last 20–30 years, but TP yields remain constant or are increasing.
Introduction
Nutrients occur naturally in aquatic ecosystems and are essential for the growth of algae and aquatic plants that serve as an important food source for many invertebrates and fish. The most common nutrients in waterways are organic and inorganic forms of nitrogen (N) and phosphorus (P). Commonly, N and P occur in relatively small amounts in natural ecosystems; the primary natural sources of P are soil and rocks, and the primary natural sources of N are leaves, organic debris from riparian vegetation, and atmospheric deposition of nitrogen gas from chemical reactions. Although nutrients occur and are transported naturally in aquatic systems, anthropogenic inputs of excess N and P from fertilizers, animal manure, seepage from wastewater and sewage, erosion of soils high in P, and combustion of fossil fuels, such as coal and gasoline, that result in unnatural atmospheric inputs of N continue to be a leading cause of stream impairment throughout the United States (Carpenter and others, 1998; Smith and others, 1999; Dodds, 2002; U.S. Environmental Protection Agency [EPA], 2006).
Increased concentrations of N and P in waterways can cause excessive algae and plant growth and lead to eutrophication, a condition characterized by a shift in stream metabolism with increased primary production (photosynthesis) and associated secondary production (respiration) from the decomposition of organic material. Ecological response to changes in metabolic conditions include changes in ecosystem structure and function caused by altered biological communities and food webs, increases in plant and algae biomass, and changes in dissolved oxygen regimes and rates of nutrient and carbon cycling (Meyer and others, 2005; Clapcott and others, 2010; Miltner, 2010). Severe cases of eutrophication and the resulting cascade of biological and ecological effects may lead to ecosystem simplification and loss of ecosystem services, as well as economic losses and increased human health risks (Dodds and Smith, 2016; Stoddard and others, 2016). Negative consequences of excess nutrients may occur locally as well as downstream to receiving waters through transport and delivery. In extreme cases, excessive loading to downstream receiving lakes, large rivers, bays, and estuaries can lead to a deficiency of oxygen called hypoxia and large areas of hypoxic waters called hypoxic zones.
The largest hypoxic zone in the United States forms each summer in the northern Gulf of Mexico off the coasts of Louisiana and Texas because of excess nutrients from the Mississippi/Atchafalaya River Basin (Diaz and Rosenberg, 2008). In 1997, the Hypoxia Task Force (HTF) was formed to understand the causes and effects of eutrophication in the Gulf of Mexico; coordinate activities to reduce the size, severity, and duration of the hypoxic zone; and ameliorate the effects of hypoxia (Mississippi River/Gulf of Mexico Watershed Nutrient Task Force, 2008). The HTF recommended that regulatory agencies in the United States should develop science-based nutrient reduction strategies that focus on implementation of best management practices to reduce nonpoint-source nutrient runoff and protect the physical, chemical, and biological integrity of aquatic ecosystems (Mississippi River/Gulf of Mexico Watershed Nutrient Task Force, 2008). The HTF has set a goal to reduce the 5-year running average areal extent of the Gulf of Mexico hypoxic zone to less than 5,000 square kilometers (km2) by the year 2035 and an interim target of a 20-percent reduction of N and P by 2025.
Nutrients (N and P) are commonly cited as principal reasons why water bodies do not fully support their designated uses in Mississippi (Mississippi Department of Environmental Quality [MDEQ], 2020). The MDEQ has developed and continues to implement nutrient reduction strategies throughout the State to mitigate harmful effects caused by excess nutrients in streams, including the Mississippi Alluvial Plain ecoregion (locally known as the Mississippi Delta), the coastal areas of Mississippi, and the upland areas of Mississippi (MDEQ, 2021). Because of an anticipated increase of urbanization and agricultural activities in future decades due to growing populations, further development, and greater demand for food production (Carpenter and others, 1998; Tilman and others, 2001), a comprehensive base of information could assist decision makers in evaluating conditions and making resource-management decisions for using and protecting water resources and, thus, allow for the development and implementation of effective management plans in the future. To understand the extent of overenrichment, one must understand the current conditions (concentrations and loads). Similarly, to measure the success of management efforts one must track status over time. In 2020, the U.S. Geological Survey (USGS), in cooperation with the MDEQ, conducted an investigation to summarize concentrations of total nitrogen (TN) and total phosphorus (TP) and to provide estimates of TN and TP loads and yields for 22 stream-water-quality monitoring stations in Mississippi from 2008 through 2018.
Purpose and Scope
The purpose of this report is to present a quantified understanding of current nutrient concentrations and loads in rivers and streams across the State of Mississippi and to examine the variability of concentrations and loads spatially, seasonally, between years, and in response to streamflow. Specifically, this report summarizes concentrations of TN and TP and provides estimates of TN and TP loads and yields using continuous streamflow data measured by the USGS and discrete water-quality samples collected at 22 stream locations across the State of Mississippi. Water-quality data were screened and analyzed for the period of record during water years (WYs) 2008–18. This information can augment efforts to:
-
• Provide a baseline of current nutrient conditions;
-
• Provide an estimate of nutrient trends over an 11-year study period;
-
• Provide the data to inform future actions to meet HTF goals and State water management goals; and
-
• Provide the foundation for continued tracking of nutrient concentrations and loads.
Description of Study Area and Study Sites
Sites selected for summary include 20 water-quality monitoring stations operated by MDEQ and 2 water-quality monitoring stations operated by USGS. The USGS operated streamflow gages at all 22 sites (fig. 1; table 1). The MDEQ stations are part of their ambient water-quality monitoring network, which is a component of their Surface Water Monitoring Program (SWMP) that has been maintained and implemented for decades to address mandates of the Federal Clean Water Act under Sections 303(d), 305(b) and 314 of the Clean Water Act (U.S. Code 33 U.S.C. §1251 et seq.) to collect data used to assess the quality of all waters within Mississippi. The two USGS stations are part of a long-term National Water-Quality Assessment (NAWQA) Project (U.S. Department of the Interior, U.S. Geological Survey, 1999) located in the Mississippi Delta.
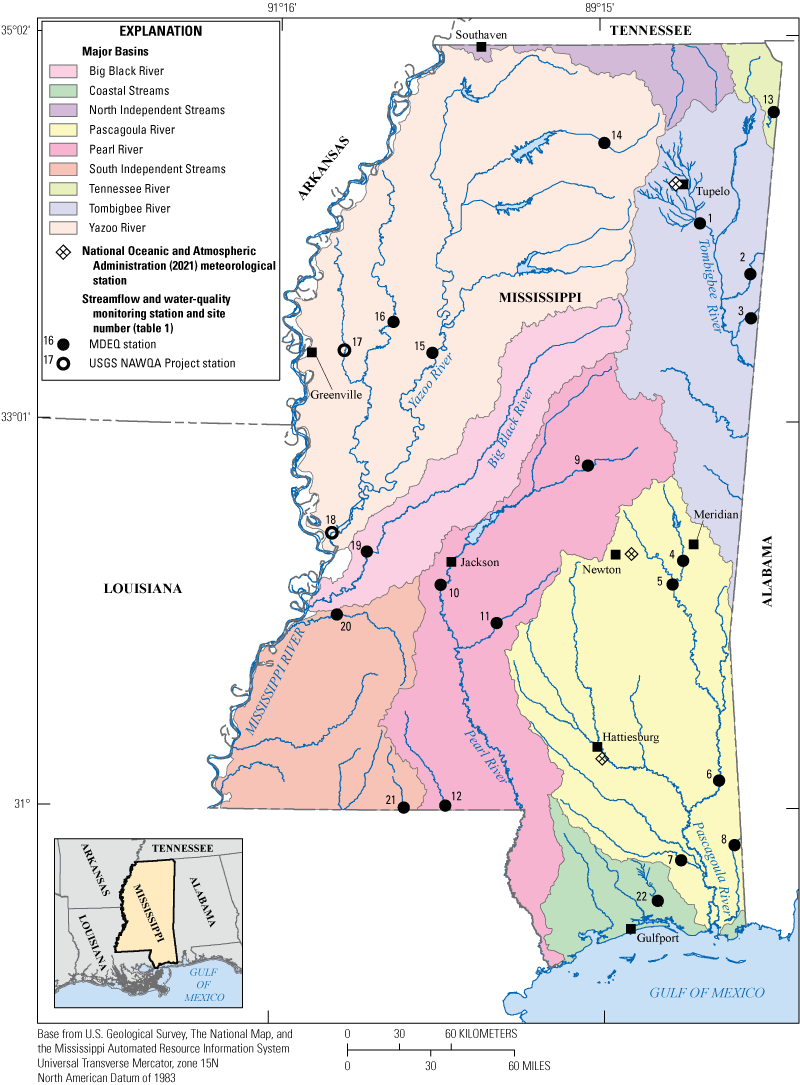
Location of selected streamflow and water-quality monitoring stations from the Mississippi Department of Environmental Quality (MDEQ) ambient water-quality network and the U.S. Geological Survey (USGS) National Water-Quality Assessment (NAWQA) Project.
Table 1.
Station information for selected streamflow and water-quality monitoring stations from the Mississippi Department of Environmental Quality (MDEQ) ambient water-quality monitoring network and U.S. Geological Survey (USGS) National Water-Quality Assessment (NAWQA) Project.[km2, square kilometer; EPA, U.S. Environmental Protection Agency; MS, Mississippi]
Mississippi ranks 32nd in the United States in land size, with 125,438 km2 of total area (U.S. Census Bureau, 2012). Mississippi is bordered by four States: Alabama, Tennessee, Arkansas, and Louisiana. The western border is formed by the Mississippi River, and the southern border is formed by the Gulf of Mexico.
Natural and human factors, such as population, physiography, geology, climate, hydrology, land uses, and land cover types, collectively affect the physical, chemical, and biological condition of surface water in Mississippi. These factors and their combinations may influence patterns and associations of nutrient conditions across streams and rivers in Mississippi.
Population
Mississippi ranks 32nd in the United States in population with 2.97 million people in 2010, a 4.3-percent increase from 2.84 million in 2000, and a population density of 24 persons per km2 (U.S. Census Bureau, 2012). The 2010 census classified 49.3 percent of the population as urban and 50.7 percent as rural. Approximately 40 percent of the population of Mississippi is concentrated in 9 of the 82 counties, located in 4 spatial urban clusters: DeSoto County in northwest Mississippi; Hinds, Rankin, and Madison Counties in central Mississippi; Forrest and Lamar Counties in southeast Mississippi; and Harrison, Jackson, and Hancock Counties in south Mississippi (fig. 2). The highest growth rates during 2000–10 were in DeSoto (50.4 percent), Lamar (42.5 percent), Madison (27.5 percent), and Rankin (22.8 percent) Counties. The lowest growth rates were in the Mississippi Delta in Issaquena (−38.2 percent) and Sharkey (−25.2 percent) Counties.
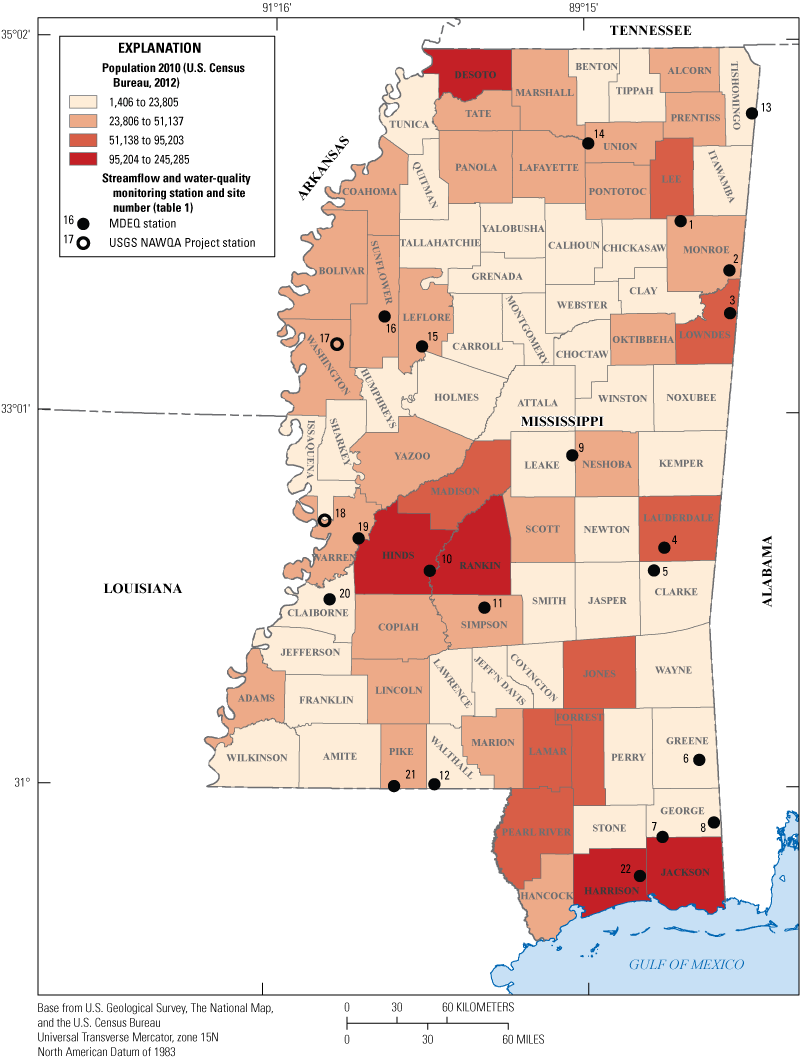
Total population by county in Mississippi, 2010, and location of selected streamflow and water-quality monitoring stations from the Mississippi Department of Environmental Quality (MDEQ) ambient water-quality monitoring network and the U.S. Geological Survey (USGS) National Water-Quality Assessment (NAWQA) Project.
Physiography and Geology
Mississippi lies within the Coastal Plain Physiographic Province (Fenneman, 1938) and includes a wide variety of landscapes. It is flat and relatively featureless in some areas, but elsewhere it consists of rounded and eroded hills and floodplains of large rivers. The Coastal Plain developed on Mesozoic sedimentary rock. The rocks are mainly composed of chalk, sandstone, limestone, and claystone. The unconsolidated sediment units, composed mainly of sediments, are described as gravels, sands, silts, and clays.
Ecoregions are delineations of areas with similar climate, geology, soils, vegetation, topography, and hydrology (Omernik and Griffith, 2008). They are intended to serve as a framework for research, assessment, management, and monitoring of ecosystems and ecosystem components. Mississippi is composed of parts of four level III ecoregions (fig. 3). The study sites are in 3 of the 4 level III ecoregions: Southeastern Plains (15 sites), Mississippi Alluvial Plain (4 sites), and Mississippi Valley Loess Plains (3 sites) (EPA, 2021).
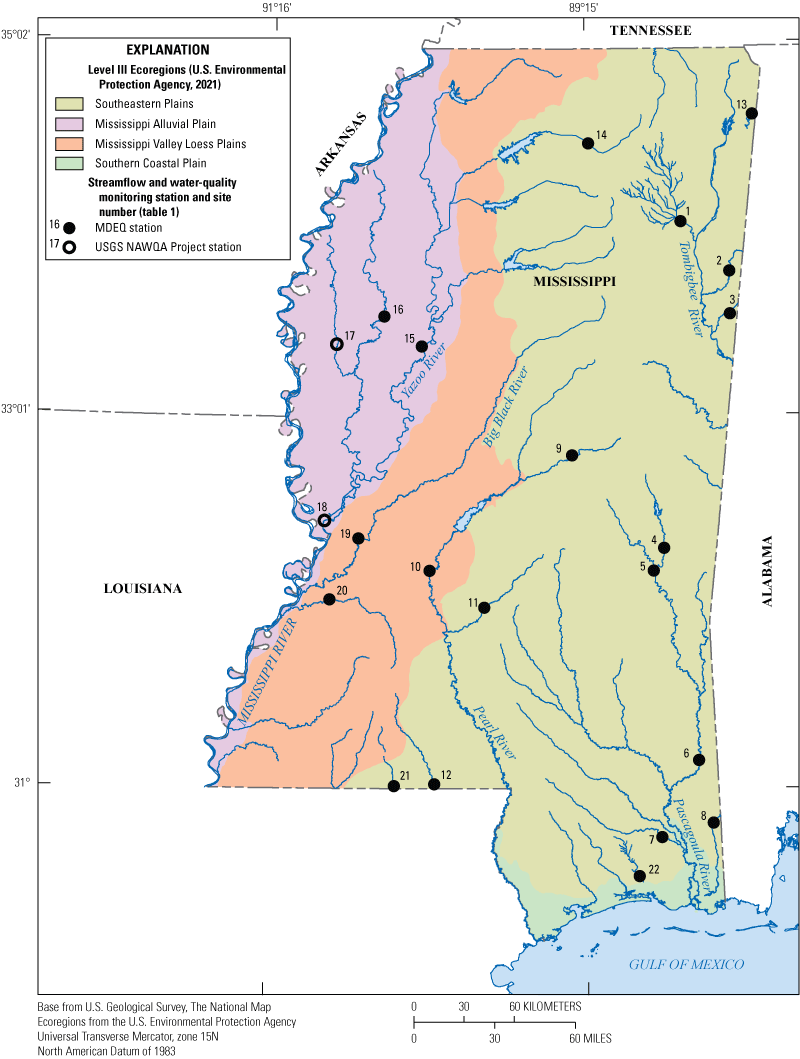
U.S. Environmental Protection Agency level III ecoregions in Mississippi and location of selected streamflow and water-quality monitoring stations from the Mississippi Department of Environmental Quality (MDEQ) ambient water-quality monitoring network and the U.S. Geological Survey (USGS) National Water-Quality Assessment (NAWQA) Project.
Land Cover
The 2016 National Land Cover Database (NLCD) was used to identify land cover and use throughout Mississippi (Yang and others, 2018; Homer and others, 2020). The 2016 NLCD is a 16-class, 30-meter-resolution dataset primarily based on a combination of Landsat data and geospatial ancillary data, combined with training datasets as well as decision-tree classifications. The 2016 NLCD provides an updated dataset of land cover data for 2001, 2003, 2006, 2008, 2011, 2013, and 2016. The 2013 land cover dataset with eight aggregated 2016 NLCD Anderson Level I classes (Anderson and others, 1976) was used in this study (table 2). For example, the land cover classes “Deciduous forest,” “Evergreen forest,” and “Mixed forest” were aggregated to “Forest” (table 2). Land cover in Mississippi is primarily forest and agricultural (fig. 4; table 3), with nearly half of the State covered by forests and about a fourth of the State covered by agriculture lands. Only 6.17 percent of Mississippi is classified as developed. The percentages of land cover for the drainage areas of the 22 study sites were calculated by using the 2016 NLCD dataset, with Anderson Level I classifications (table 4) (Homer and others, 2020).
Table 2.
Classification scheme of Anderson Level I and Level II systems used with the 2016 National Land Cover Data dataset (Anderson and others, 1976).Table 3.
Percentage of land use/land cover for Mississippi for 2013 from the 2016 National Land Cover Data dataset (Homer and others, 2020) using Anderson Level I classifications (Anderson and others, 1976).[km2, square kilometer]
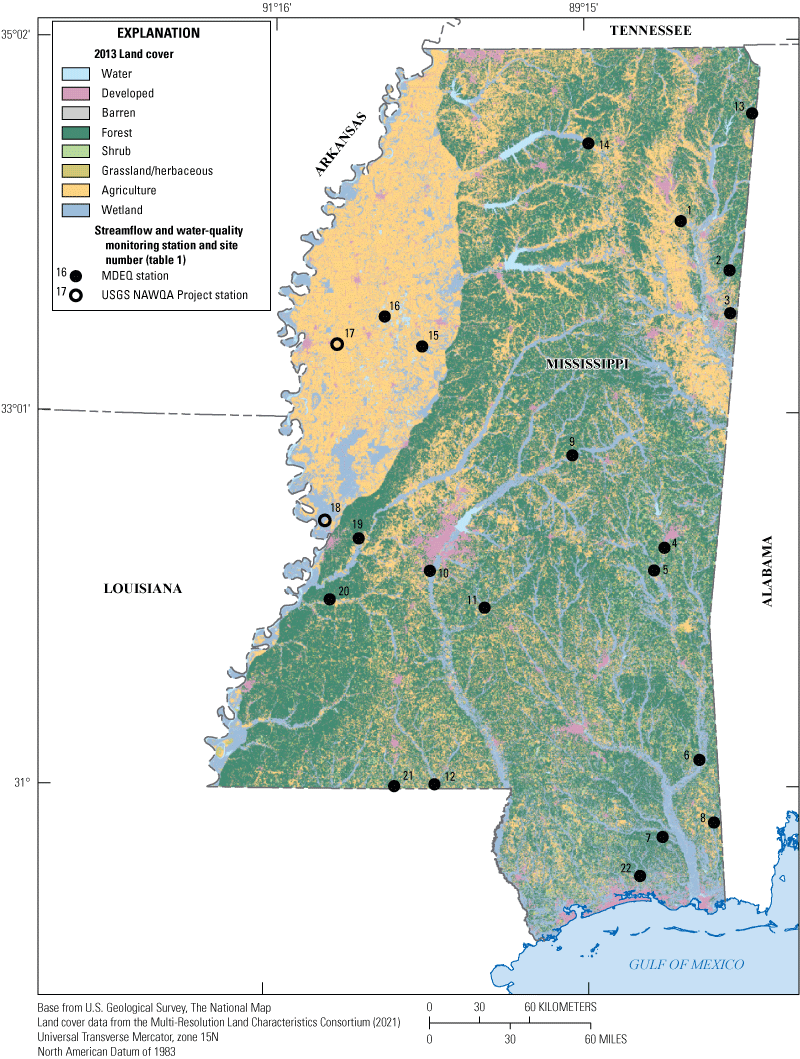
Land cover in Mississippi, 2013. The 2016 National Land Cover Data (Homer and others, 2020) was aggregated to eight Anderson level I classes (Anderson and others, 1976).
Table 4.
Percentage of land use/land cover from the 2016 National Land Cover Data dataset (Homer and others, 2020) using Anderson Level I classification (Anderson and others, 1976) for areas draining selected streamflow and water-quality monitoring stations from the Mississippi Department of Environmental Quality (MDEQ) ambient water-quality monitoring network and the U.S. Geological Survey (USGS) National Water-Quality Assessment (NAWQA) Project.[<, less than]
| Site number (fig. 1) | USGS or MDEQ1 station number | Short name | 1 Water | 2 Developed | 3 Barren | 4 Forest | 5 Shrub | 6 Grassland/ Herbaceous | 7 Agriculture | 8 Wetlands |
|---|---|---|---|---|---|---|---|---|---|---|
| Percent | ||||||||||
| 1 | 02436500 | Town | 1.44 | 12.0 | 0.07 | 35.1 | 2.32 | 1.42 | 43.0 | 4.71 |
| 2 | 02439400 | Buttahatchee | 0.22 | 5.39 | 0.07 | 62.3 | 8.81 | 3.01 | 10.8 | 9.36 |
| 3 | 02443000 | Luxapallila | 0.43 | 6.16 | 0.12 | 56.0 | 7.39 | 4.39 | 11.7 | 13.8 |
| 4 | 02476600 | Okatibbee | 3.22 | 12.3 | 0.14 | 43.9 | 10.8 | 4.88 | 9.88 | 15.0 |
| 5 | 02477000 | Chickasawhay upper | 0.63 | 4.76 | 0.01 | 52.8 | 9.27 | 4.71 | 10.7 | 17.1 |
| 6 | 02478500 | Chickasawhay lower | 0.91 | 4.53 | 0.09 | 49.5 | 10.1 | 5.12 | 7.84 | 21.9 |
| 7 | 02479300 | Red | 0.91 | 4.99 | 0.26 | 41.9 | 9.81 | 4.15 | 10.3 | 27.7 |
| 8 | 02479560 | Escatawpa | 0.64 | 3.27 | 0.07 | 47.8 | 8.58 | 6.36 | 7.92 | 25.4 |
| 9 | 02482000 | Pearl upper | 0.80 | 5.37 | 0.03 | 47.4 | 3.86 | 2.61 | 18.9 | 21.0 |
| 10 | 02486500 | Pearl lower | 2.12 | 10.2 | 0.03 | 46.7 | 3.29 | 2.79 | 15.4 | 19.5 |
| 11 | 02487500 | Strong | 0.57 | 4.58 | 0.01 | 56.3 | 4.22 | 3.28 | 16.0 | 15.0 |
| 12 | 02490900 | Bogue Chitto | 0.38 | 6.92 | 0.07 | 49.2 | 6.00 | 4.03 | 23.9 | 9.56 |
| 13 | 03592100 | Bear | 1.37 | 7.07 | 0.21 | 54.1 | 5.64 | 2.36 | 26.9 | 2.39 |
| 14 | 07268000 | Little Tallahatchie | 0.76 | 6.28 | 0.08 | 45.6 | 3.81 | 1.70 | 35.6 | 6.19 |
| 15 | 07287120 | Yazoo upper | 3.14 | 5.04 | 0.12 | 38.4 | 2.71 | 1.17 | 39.6 | 9.87 |
| 16 | 07288500 | Big Sunflower | 1.73 | 5.57 | 0.06 | 0.07 | <0.01 | 0.01 | 82.3 | 10.3 |
| 17 | 07288650 | Bogue Phalia2 | 0.59 | 3.95 | 0.03 | 0.01 | 0.01 | <0.01 | 87.7 | 7.75 |
| 18 | 07288955 | Yazoo lower2 | 3.51 | 4.29 | 0.28 | 13.8 | 0.36 | 0.14 | 58.4 | 19.2 |
| 19 | 07290000 | Big Black | 1.10 | 4.95 | 0.05 | 50.3 | 3.41 | 2.71 | 24.9 | 12.6 |
| 20 | 07290650 | Bayou Pierre | 0.58 | 3.58 | 0.17 | 60.3 | 6.37 | 4.26 | 17.5 | 7.20 |
| 21 | 07375280 | Tangipahoa | 0.88 | 11.4 | 0.10 | 46.5 | 5.81 | 3.87 | 21.3 | 10.1 |
| 22 | 111B59 | Tuxachanie | 0.17 | 3.81 | 0.11 | 51.8 | 8.86 | 3.12 | 2.26 | 29.8 |
Climate
The climate of Mississippi is warm and humid, ranging from temperate in north Mississippi to subtropical near the coast (MDEQ, 2020b). The land-surface altitude and distance from the Gulf of Mexico are major factors influencing climate. In the summer months, the Gulf of Mexico produces warm, humid air masses that move inland and provide precipitation in the form of thunderstorms, especially near the coast. Arctic fronts that move south from the midwestern part of the continent contribute most of the precipitation in the winter months. Mean annual precipitation from 2008 through 2018 was approximately 148.79 centimeters per year (National Oceanic and Atmospheric Administration [NOAA], 2021).
Hydrologic Conditions
Hydrologic conditions vary spatially and seasonally across Mississippi and mainly follow patterns in precipitation. High-flow conditions in streams generally occur in the spring, and low-flow conditions generally occur in late summer or early fall. However, flooding can occur at any time of the year. The State is divided into 9 major river basins (fig. 1), and the total length of streams is more than 131,966 kilometers (km) (MDEQ, 2020a). Perennial streams are characterized by flowing water throughout the year, and they represent 32 percent of Mississippi’s streams. Intermittent streams flow during rainy seasons but are dry during summer months, and they represent 65 percent of Mississippi’s streams. More than 3,863 km of man-made ditches and canals are in the State (MDEQ, 2020b). The Mississippi River (approximately 644 km) and the Pearl River (approximately 130 km) form Mississippi's border with Arkansas and Louisiana on the west side of the State. The southern edge of Mississippi's contiguous land mass borders the Gulf of Mexico; the coastline totals approximately 135 km (MDEQ, 2020b). Mississippi includes hundreds of publicly owned lakes, reservoirs, and ponds covering a combined area of approximately 1,052 km2. Impoundments may increase base flow in streams when water is released during dry periods and reduce flood peaks by storing floodwaters. Eight of the nine major river basins in Mississippi were represented by at least 1 station in this study and were analyzed for hydrologic patterns in nutrient conditions (table 1).
Data Collection
The MDEQ developed and is primarily responsible for the implementation and maintenance of the SWMP (MDEQ, 2020b). The SWMP is designed for the collection of surface-water samples to characterize and assess statewide water-quality status and trends in the State’s streams, lakes, estuaries, and coastal waters for general reporting as outlined in the §305(b) section of the Clean Water Act (U.S. Code 33 U.S.C. §1251 et seq.). A major component of the SWMP is the MDEQ ambient water-quality monitoring network of stations distributed throughout the northern, central, and southern regions of the State in streams, rivers, bayous, and estuaries. These stations were selected for the MDEQ ambient water-quality monitoring network at specific targeted locations to characterize conditions of major perennial streams and to meet one or more of the following criteria:
-
• Proximity to a USGS streamgage;
-
• Strategic watershed location (lower end of watershed, confluence of major streams, mouth of major tributary, and maximum spatial coverage);
-
• High recreational activity or designated use;
-
• Interstate waters; and (or)
-
• Waters of some ecological, public health, or economic significance (below major pollution sources, in a fish advisory area, ecoregional reference site, high quality waters, endangered/threatened species, and high economic interest).
The stations in the MDEQ ambient water-quality monitoring network were sampled monthly by MDEQ for a uniform set of physical and chemical water-quality parameters. Water-quality samples were collected at MDEQ sites according to MDEQ surface water-quality monitoring standard operating procedures (MDEQ, 2017). Water-quality samples were collected at USGS NAWQA sites according to standard methods outlined in the USGS National Field Manual (USGS, 2006). Samples were collected based on a schedule without regard to flow conditions during the scheduled site visits. Water samples from MDEQ sites were analyzed at the MDEQ laboratory in Pearl, Miss., in accordance with EPA Methods for Chemical Analysis of Water and Wastes (EPA, 1983) and the Standard Methods for Examination of Water and Wastewater (Eaton and others, 2005). Water samples from the USGS NAWQA sites were analyzed at the USGS National Water Quality Laboratory in Denver, Colorado, and colorimetry was used to analyze the water samples for N and P species (Patton and Truitt, 1992; Fishman, 1993; O’Dell, 1993; Patton and Kryskalla, 200345).
Station Selection, Period of Record, and Data Screening
Station selection for loads and yields was based on the availability of long-term water-quality data at a station. Station selection was carried out with assistance from MDEQ staff. Twenty of the 40 current MDEQ ambient water-quality monitoring network stations were chosen for inclusion in this study. Remaining stations were excluded based on an insufficient amount of water-quality data and (or) the ability to associate the water-quality site with a suitable nearby streamgage. The two stations from the USGS NAWQA long-term trend network (USGS, 2019) that were selected for this study are the Bogue Phalia (site number [site no.] 17) and Yazoo lower (site no. 18) (fig. 1).
Streamflow data and monthly water-quality data from the selected sites were investigated, retrieved, compiled, and evaluated for the period 2008–18. All data were retrieved and analyzed by WY. A WY is defined as the 12-month period from October 1 through September 30 and is designated by the calendar year in which the WY ends. Streamflow and water-quality data were retrieved from the USGS National Water Information System database (USGS, 2020); monthly water-quality data were provided by the MDEQ and are available in a companion data release (Crain and others, 2023). During some years, samples were not collected each month for a particular station. A summary of missing data is provided in table 5.
Table 5.
Number of missing discrete total nitrogen and total phosphorus samples at selected streamflow and water-quality monitoring stations from the Mississippi Department of Environmental Quality (MDEQ) ambient water-quality monitoring network and the U.S. Geological Survey (USGS) National Water-Quality Assessment (NAWQA) Project.[TN, total nitrogen; TP, total phosphorus. The total expected number of samples for each constituent from water years 2008–18 is 132 samples]
| Site number (fig. 1) |
USGS or MDEQ1 station number | Number of missing discrete TN samples | Number of missing discrete TP samples | Date(s) of missing samples |
|---|---|---|---|---|
| 1 | 02436500 | 1 | 1 | January 2013 |
| 2 | 02439400 | 2 | 2 | November 2011; January 2013 |
| 3 | 02443000 | 1 | 1 | January 2013 |
| 4 | 02476600 | 2 | 1 | October 2007; February 2016 |
| 5 | 02477000 | 1 | 1 | May 2009 |
| 6 | 02478500 | 1 | 1 | August 2012 |
| 7 | 02479300 | 6 | 4 | August 2012; April 2015; June 2015; December 2015; January 2018; July 2018 |
| 8 | 02479560 | 2 | 3 | October 2008; July–August 2015 |
| 9 | 02482000 | 1 | 1 | December 2011 |
| 10 | 02486500 | 1 | 1 | July 2011 |
| 11 | 02487500 | 0 | 0 | None |
| 12 | 02490900 | 0 | 0 | None |
| 13 | 03592100 | 2 | 2 | April 2011; January 2013 |
| 14 | 07268000 | 1 | 1 | January 2013 |
| 15 | 07287120 | 1 | 1 | January 2013 |
| 16 | 07288500 | 1 | 1 | January 2013 |
| 17 | 07288650 | 30 | 30 | January 2008; December 2008; January–September 2009; March–December 2011; January–September 2012 |
| 18 | 07288955 | 0 | 0 | None |
| 19 | 07290000 | 0 | 0 | None |
| 20 | 07290650 | 2 | 2 | February 2016; July 2018; July 2015; June 2018 |
| 21 | 07375280 | 0 | 0 | None |
| 22 | 111B59 | 0 | 1 | October 2016 |
The values used in the load calculations were concentrations of unfiltered total nitrogen as N (TN) and unfiltered total phosphorus as P (TP), both expressed in units of milligrams per liter. If a TN concentration was not available, it was estimated by using the analytic results for dissolved nitrate plus nitrite as N (NO3+NO2) and results for total Kjeldahl nitrogen as N (TKN), which includes organic N and ammonia. If neither NO3+NO2 nor TKN concentrations were less than the detection limits, the TN concentration was simply their sum. If the concentration of TKN was less than the method detection limit of 0.1 milligram per liter (mg/L) or the concentration of NO3+NO2 was less than the method detection limit of 0.02 mg/L, the following rules were applied to estimate concentrations of TN:
-
1. If the TKN concentration was greater than the detection limit and the concentration of NO3+NO2 was less than the detection limit, then TN was assumed to be the concentration of TKN.
-
2. If the concentration of TKN was less than the detection limit and NO3+NO2 was less than 0.02 mg/L, then TN was assumed to be less than 0.1 mg/L.
-
3. If the concentration of TKN was less than the detection limit and NO3+NO2 was greater than or equal to 0.02 mg/L, then TN was assumed to be equal to the concentration of NO3+NO2.
Note that a positive bias in a TN concentration is likely when the concentrations of TKN and NO3+NO2 are summed because of the reduction of nitrate to ammonium during the Kjeldahl digestion process. This process causes some double counting of NO3+NO2 concentrations in the analytical results for TKN concentrations and in the calculated sum of TN (Mueller and Spahr, 2006).
For summaries and analyses of concentrations in this report, TN and TP values less than the detection limit are given as the detection limit and are referred to as “censored values.”
Estimates of Daily Streamflow
Daily mean streamflows were estimated at 7 of the 22 water-quality sampling sites where no streamflow data were available or where the available streamflow record was incomplete (missing) for a part of the water-quality sampling period in WYs 2008–18 (table 6). Streamflow data were not available for two of the water-quality sampling sites; the available streamflow record was incomplete for the remaining five sites. Streamflow was estimated by using either a drainage-area-ratio adjustment or regression methods. For sites lacking streamflow records that were located on the same stream reach (upstream or downstream) or near a streamgage, the drainage-area-ratio adjustment was used to estimate the streamflows at the nearby ungaged location. This method is commonly used when the drainage-area ratio between the two sites is between 0.5 and 1.5 (Risley and others, 2008).
Extension in time (augmentation) of an existing short-term streamgage record (a short-term station) was accomplished by developing a regression relation among concurrent daily mean streamflows at the short-term stations and at one or more nearby stations that are hydrologically similar and have streamflow records through the sampling period (long-term stations). The final regression streamflow estimates were made by using the Maintenance of Variance Extension Type 1 (MOVE.1), as described by Hirsch (1982), in which a correlation regression model (Helsel and others, 2020) was fit to the concurrent daily mean streamflows (SAS Institute, Inc., 2004). The MOVE.1 method provides the estimated streamflows with some of the variance characteristics of the observed streamflow record. The MOVE.1 method is unlike ordinary-least-squares regression, which tends to “smooth” the estimated streamflow and provides lower variance than in the original observed streamflows. The MOVE.1 regression estimate was computed by use of log-transformed values of the concurrent nonzero daily mean streamflows as
whereQs
is the estimated daily mean streamflow at the short-term stations;
Ql
is the observed daily mean streamflow at the long-term stations;
Ms and Ml
are the means of the daily mean streamflows for the concurrent period at the short- and long-term stations, respectively; and
Ss and Sl
are the standard deviations of the daily mean streamflows for the concurrent period at the short- and long-term stations, respectively.
Missing time-series streamflow values were estimated by linear interpolation between known values. The linear interpolation formula is defined as:
wherey
is the unknown value;
x
is the known value;
x1 and y1
are the coordinates that are less than the known x value; and
x2 and y2
are the coordinates that are greater than the known x value.
Table 6.
U.S. Geological Survey (USGS) streamgages used for estimating streamflow for selected streamflow and water-quality monitoring stations from the Mississippi Department of Environmental Quality (MDEQ) ambient water-quality monitoring network and the USGS National Water-Quality Assessment (NAWQA) Project with no available streamflow or incomplete streamflow records.[MOVE.1, Maintenance of Variance Extension, Type 1; MS, Mississippi; NA, no adjustment; LA, Louisiana; AL, Alabama]
Load Estimation Methods
A load, also referred to as “mass flux,” is the transport (mass discharge) of a constituent passing a given point in a stream over a specific time period. A load is determined by multiplying the concentration of the constituent by the streamflow. A yield is defined as the load per unit of drainage area and is expressed as kilograms per year per square kilometer.
A variety of quantification methods are available to estimate long-term, mean annual loads. Lee and others (2016) evaluated 11 methods for computing mean annual water-quality loads for various constituents, including TN and TP. Their findings concluded that ratio estimators and Weighted Regressions on Time, Discharge, and Season (WRTDS) allowed for flexibility in determining concentration and streamflow relations and produced the most accurate loads (Lee and others, 2019). Six of the load estimation methods considered and evaluated in this study were based on simple interpolation, ratio estimators, multiple regression, and weighted regression. However, only three of the six methods were chosen to estimate mean annual nutrient loads for this study. The three methods are the Beale’s ratio estimator (BRE), the USGS LOAD ESTimator (LOADEST) seven-parameter regression estimator, and WRTDS.
The BRE method is a simple, data-driven method that is applied by delineating different strata based on either time or streamflow conditions within the sampled record (Beale, 1962; Tin, 1965; Lee and others, 2016). This method has been widely used for estimating loads, particularly for P, at sites in the Great Lakes (Maccoux and others, 2016) and has been shown to produce statistically unbiased results (Richards and Holloway, 1987; Quilbé and others, 2006; Lee and others, 2019).
The USGS LOADEST method computes regression coefficients using the adjusted maximum likelihood estimation method to develop regression relations (Wolynetz, 1979) that relate infrequently available concentration data to various continuous explanatory variables (for example, daily mean streamflow, season, and time) to estimate their effects on water-quality constituent concentrations and loads (Runkel and others, 2004). LOADEST, a FORTRAN program originally developed by Runkel and others (2004), was updated and repackaged as rloadest by Lorenz and others (2015) in the R programming language (R Core Team, 2018).
For this study, the R package loadflex was used to fit and assess nutrient load models and to compare uncertainty in the mean annual load estimate predictions. The loadflex package (available at https://github.com/mcdowelllab/loadflex) facilitates the implementation and comparison of five load estimation models using the same interface (Appling and others, 2015). This package allows the user to efficiently compare multiple load estimation models using model selection criteria to determine the best fitting model. The loadflex package also estimates the uncertainty in load estimations which is important for interpretation (Yanai and others, 2015). For this effort, the loadflex package estimated mean annual loads using both the BRE and LOADEST regression methods from a single dataset. The BRE method was implemented in the stratified form as described in Cochran (1977).
The WRTDS method creates flexible statistical relations using a weighted regression for each day of the estimation period to produce four daily time series for the period of record (Hirsch and De Cicco, 2015). These daily time series include daily concentration, daily load, flow-normalized daily concentration, and flow-normalized daily load. The nonnormalized estimates for daily concentration and load as reported in this study are estimates of the observed daily occurrence as determined by the observed daily streamflow (Hirsch and De Cicco, 2015). Flow-normalized daily concentration and load estimates are calculated by using the mean streamflow for a given day. Flow-normalized calculation reduces the effects of streamflow variability on concentrations and loads and enhances the WRTDS method’s ability to identify trends and protects the analysis from being highly influenced by the random occurrence of a particularly wet or dry year near the end or the beginning of a study period (Sprague and others, 2011).
For this study, no single load estimation method provided the greatest accuracy for all water-quality constituents, sites, and sampling scenarios. Selection of a load estimation method used for each constituent and at each site was based primarily on the degree to which the model fit the data and the use of the flux (load) bias statistic; a dimensionless statistic defined as
whereLp,i
is the predicted load from WRTDS for day i;
Lo,i
is the observed flux for day i; and
n
is the number of sampled days in the monitoring record.
Values of the flux bias statistic between −0.1 and +0.1 indicated an acceptable model; values beyond that range indicated an unacceptable model (Hirsch, 2014). Additionally, a variety of graphics were used to identify and characterize issues with the fitted model for each given dataset. A function for producing eight diagnostic graphs is included in the WRTDS distribution (R package EGRET; Hirsch and De Cicco, 2015).
Of the methods considered in this study, the BRE and WRTDS methods were the most consistent in providing accurate and least biased mean annual load estimates of TP. According to Lee and others (2016), methods that create flexible statistical relations between streamflow and load, such as the BRE and WRTDS methods, generally provide more accurate load estimates, particularly for TP which is a constituent that exhibits a strong positive relation between concentration and streamflow. Results of the comparisons of multiple methods considered for estimating mean annual TN loads in this study indicated that the LOADEST regression and WRTDS methods provided more accurate and least biased estimates of TN. Both methods are regression based and work well for TN because this constituent exhibits little variation between concentration and streamflow (Lee and others, 2016).
Trend-Estimation Methods
Trends in streamflow were assessed in Exploration and Graphics for RivEr Trends (EGRET) by using the Mann-Kendall test with Theil-Sen slope estimates for the period of record (WYs 2008–18) (Helsel and others, 2020). The tau value determined in the Mann-Kendall analyses indicated whether the annual mean daily streamflow trend was upward or downward. Values of tau may range from +1 to −1. A value of +1 indicates continuous increase in streamflow with time, and a value of −1 indicates continuous decrease in streamflow with time. Values of tau reflect the relative strength of the monotonic association between streamflow and time. Monotonic streamflow trend slopes were computed by using the Theil-Sen slope estimator to identify the median slope associated with the trend (Helsel and others, 2020). Monotonic streamflow trend slopes are calculated on the logarithms of the streamflow data and then transformed to percentage changes per year (Hirsch and De Cicco, 2015).
The Exploration and Graphics for RivEr Trends confidence intervals (EGRETci) package (Hirsch and De Cicco, 2019) was used to calculate trends in nutrients and to estimate the uncertainty associated with these trends. A block bootstrap approach contained in the EGRETci package was used to generate confidence intervals to determine the magnitude, direction, and statistical likelihood of trends during WYs 2008–18. The trend results in this report have been summarized by using a likelihood-based approach that uses descriptive statements to describe the likelihood associated with the trend direction over time (Hirsch and others, 2015). This approach is often used when reporting water-quality trends (Oelsner and others, 2017) and is an alternative to the null-hypothesis significance testing approach. The likelihood-based approach provides more straightforward information on the certainty of an estimated trend and gives water-resource managers more useful information when making decisions on basin management (Oelsner and others, 2017). When the likelihood statistic was between greater than or equal to 0.95 and less than or equal to 1.0, the trend was described as “highly likely” for an upward trend (or “highly unlikely” for a downward trend if one wanted to describe the trend likelihood in this manner). Conversely, a trend with a likelihood statistic between greater than or equal to 0.0 and less than or equal to 0.05 was considered “highly unlikely” for an upward trend (or “highly likely” for a downward trend).
Data Analysis Methods for Comparing Streamflow, Water Quality, and Land Use
The Spearman’s rank correlation test (Helsel and others, 2020) was used to determine monotonic relations between streamflow, water-quality conditions, and land use. Spearman’s rank correlation test is a nonparametric test that determines correlations between the ranks of two variables and does not require the variables to be linearly related. Spearman’s correlation coefficient, rho or Spearman’s ρ, ranges between −1 and 1, with values close to these endpoints representing the strongest correlative relations (either negative or positive, respectively) and values near zero representing poor correlative relations.
Hydrology and Water Quality
Variabilities in streamflow and TN and TP concentrations, loads, and yields are influenced by factors such as basin size and spatial (major river basin and ecoregion), temporal (annual and monthly), and land use characteristics. In the following report sections, concentrations and annual loads and yields for TN and TP in Mississippi are given for the period of record, WYs 2008–18, in context with those influencing factors. To evaluate how well this study’s results agree with other models and to evaluate changes in yields over time in this study area, comparisons have been made among the study-derived TN and TP mean annual yields and those of other published studies.
Hydrology
Environmental factors such as precipitation and streamflow may influence concentrations and loads of nutrients in a basin. Previous studies have found that the transport of nutrients to streams is associated with high-flow events (Zhang and others, 2009; Carpenter and others, 2017; Gao and others, 2018), particularly extreme precipitation events (for example, precipitation exceeding 51 millimeters in 24 hours [Carpenter and others, 2017]). In addition, the influence of extreme precipitation events may result in skewed temporal distributions of nutrient loads. Thus, understanding hydrologic variations over time is important for assessing water-quality conditions and for providing a context to evaluate loads, yields, and trends.
Average annual and monthly precipitation data from three NOAA meteorological stations were used to characterize the relation between precipitation and streamflow across the State. The three selected stations represent the southern (USW00013833, Hattiesburg Chain Municipal Airport), central (USW00063831, Newton 5 ENE), and northern (USW00093862, Tupelo Regional Airport) regions in Mississippi (NOAA, 2021). Changes in the amount of precipitation appeared to generally influence the variability in annual median streamflow during the period of record, WYs 2008–18 (fig. 5A, B). Station-by-station analyses of precipitation data from nearby weather stations and streamflow were not performed; at some sites, streamflow could be responding to factors other than precipitation, such as water release from dams and irrigation return flow. Comparison of the mean annual precipitation (WYs 2008–18) from the combined data of the three meteorological stations to the combined long-term precipitation mean (1981–2010) at the same stations indicated about the same number of years with mean annual precipitation less than and greater than the long-term precipitation annual mean of 55.9 inches. Mean annual precipitation was greater than the long-term precipitation annual mean in 2009, 2012, 2013, 2016, and 2018.
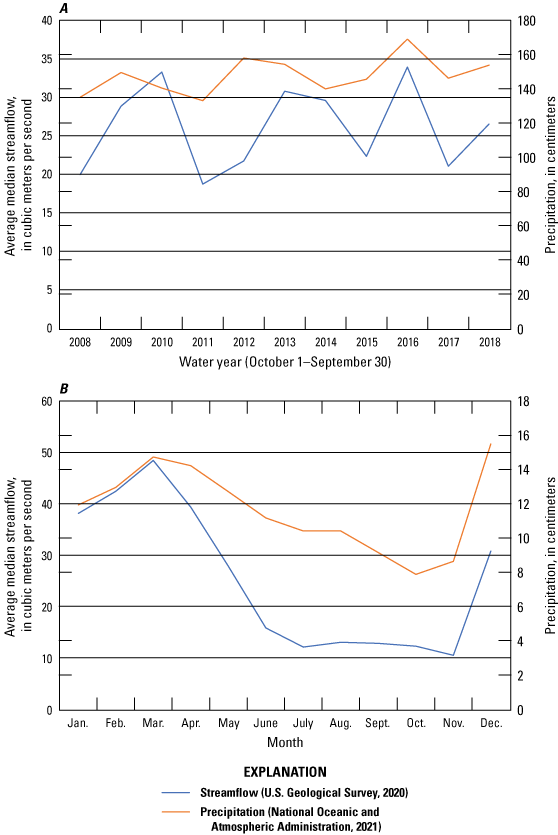
Average median streamflow measured at 22 U.S. Geological Survey streamgages and the combined average precipitation from three National Oceanic and Atmospheric Administration regional meteorological stations in Mississippi by A, year and B, month, water years 2008–18.
Mean streamflow ranged from 5.06 cubic meters per second at the Tuxachanie (site no. 22) site to 489 cubic meters per second at the Yazoo lower (site no. 18) site (table 7; fig. 6). Average annual mean streamflow was highly related to drainage area (fig. 7). The highest average annual median streamflows of all study sites combined occurred in WYs 2010, 2013, and 2016, and the lowest occurred in WYs 2008, 2011, and 2017 (fig. 5A). The highest average monthly median streamflows occurred in the winter and spring (December–May), and the lowest occurred in the summer and fall (June–November) (fig. 5B).
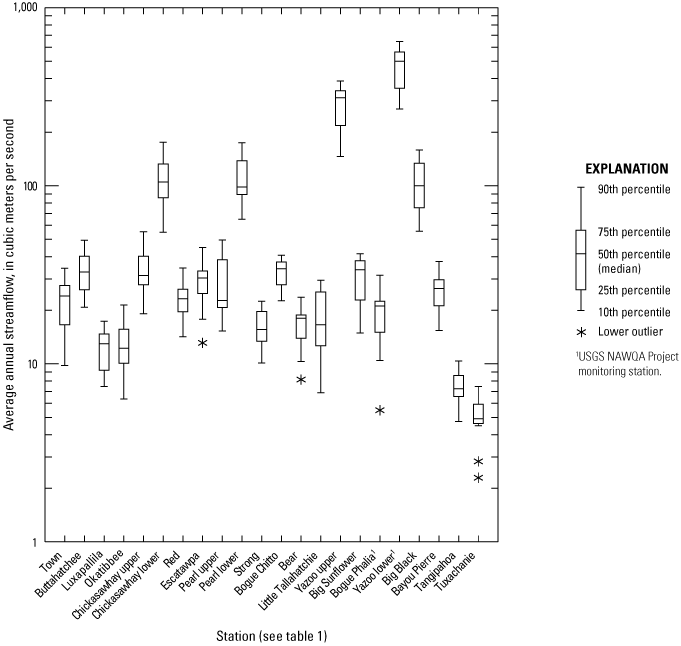
Distribution of annual mean streamflows at selected streamflow and water-quality monitoring stations from the Mississippi Department of Environmental Quality (MDEQ) ambient water-quality monitoring network and the U.S. Geological Survey (USGS) National Water-Quality Assessment (NAWQA) Project.
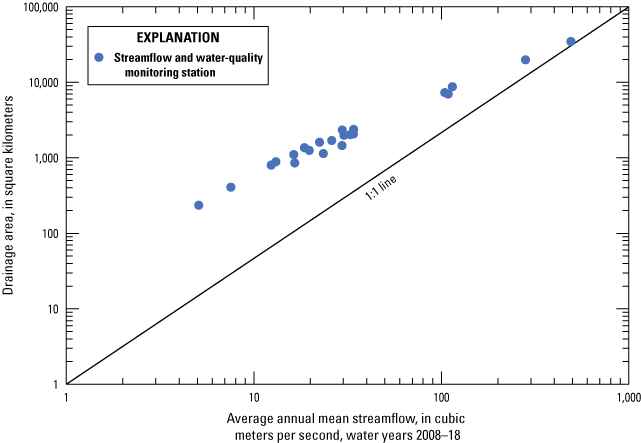
Relation of average annual mean streamflow to drainage area for selected streamflow and water-quality monitoring stations from the Mississippi Department of Environmental Quality (MDEQ) ambient water-quality monitoring network and the U.S. Geological Survey (USGS) National Water-Quality Assessment (NAWQA) Project.
Flow-duration curves (FDCs) are a useful tool in characterizing water-quality concerns and describing patterns associated with impairments. FDCs provide the ability to associate water-quality concerns to basin processes that may be important when developing watershed-based plans. Analysis between FDCs from different sites can provide some insight into the factors that may affect the movement of water in a drainage basin. The shape of the FDC reflects the ability of a basin to temporarily store water in the ground and to release it later as contributing flow (Leopold, 1994). Factors that affect the hydrologic characteristics of a basin include climate, geology, topography, land cover, and soil properties. These hydrologic characteristics can be inferred based on the slope of the curve. Drainage basins with a large amount of impervious or agricultural areas tend to have a steep slope at the lower end of the FDC, which is characteristic of a highly variable hydrologic system where streamflow is largely driven by direct runoff and there is little groundwater contribution to the stream (fig. 8A). In contrast, streams that have ample groundwater capacity tend to have flat slopes because of substantial groundwater contribution to base flow (fig. 8B). Annual FDCs were prepared from streamflow data for the 10-year period (2008–18) for each site (appendix 1).
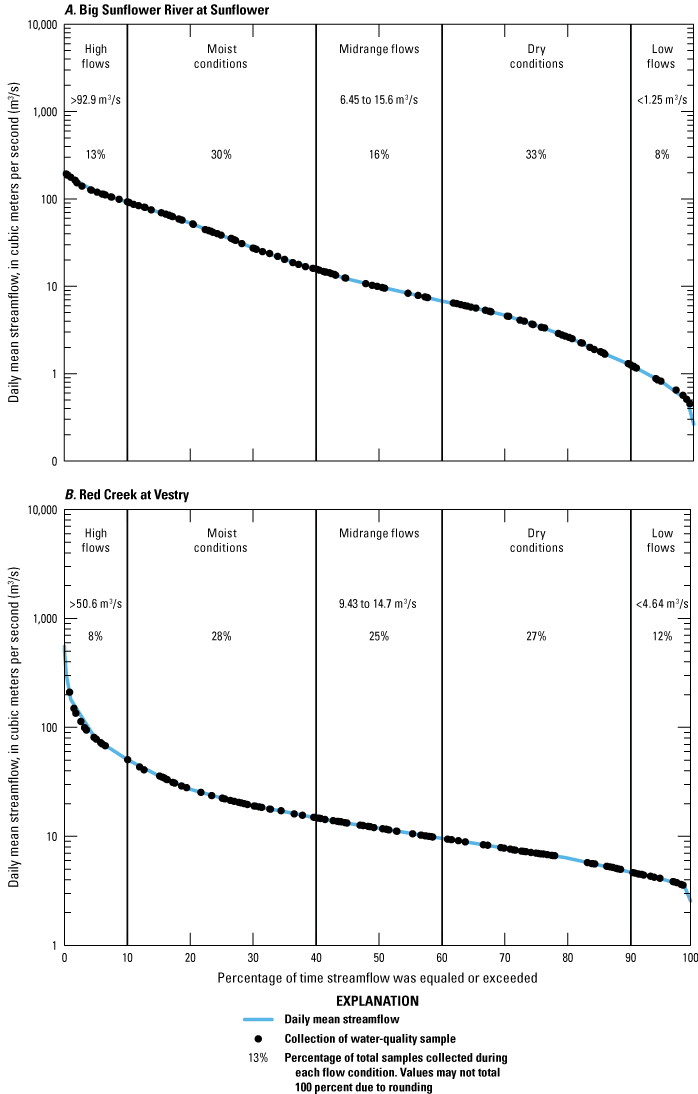
Flow-duration curves for the U.S. Geological Survey streamgages Big Sunflower River at Sunflower, Mississippi (07288500), and Red Creek at Vestry, Mississippi (02479300), illustrating A, steep slope at the lower end of the curve, characteristic of a highly variable hydrologic system largely driven by direct runoff, and B, flat slopes, characteristic of substantial groundwater contribution. [Percentage labels represent the percentage of water-quality samples collected during each flow condition; markers on the duration curves represent the daily mean streamflow when a water-quality sample was collected.]
In addition to FDCs, streamflow conditions for the sites in Mississippi were assessed by using measured and estimated daily streamflow data (table 7 and fig. 6). Quartiles were applied to describe streamflow. The first quartile, denoted as the 25th percentile, describes a value that exceeds no more than 25 percent of the streamflow data and hence is exceeded by no more than 75 percent of the data. Similarly, the third quartile, denoted as the 75th percentile, is a value that exceeds no more than 75 percent of the streamflow data and hence is exceeded by no more than 25 percent of the data. The 50th percentile (median) is the streamflow that is exceeded by 50 percent of the streamflow data over the analyzed period of record. The range of streamflows between the 25th and 75th percentiles, or interquartile range, represents 50 percent of the annual streamflow durations and indicates the statistical dispersion of the data. To better understand hydrologic context in which water-quality samples were collected, the daily mean streamflow at the time of water-quality sample collection was compared to five different flow-duration intervals for each site (table 8). The results indicated that water-quality samples were evenly collected over a wide range of flows at all sites, particularly at flow-duration intervals ranging from 11 to 90 percent. This finding suggests that load estimations are representative of a wide range of flows at all sites.
Table 7.
Summary statistics of streamflow for selected monitoring stations from the Mississippi Department of Environmental Quality (MDEQ) ambient water-quality monitoring network and the U.S. Geological Survey (USGS) National Water-Quality Assessment (NAWQA) Project.[IQR, interquartile range]
| Site number (fig. 1) |
USGS or MDEQ1 station number | Short name | Streamflow, in cubic meters per second | IQR (75th–25th quartile) |
|||||
|---|---|---|---|---|---|---|---|---|---|
| Mean | Minimum | Quartile values | Maximum | ||||||
| 25th | Median | 75th | |||||||
| 1 | 02436500 | Town | 22.4 | 0.27 | 1.82 | 6.21 | 18.5 | 761 | 16.6 |
| 2 | 02439400 | Buttahatchee | 33.9 | 2.64 | 7.97 | 17.6 | 39.9 | 1,157 | 32.0 |
| 3 | 02443000 | Luxapallila | 12.3 | 0.93 | 3.28 | 6.85 | 15.3 | 230 | 12.1 |
| 4 | 02476600 | Okatibbee | 13.0 | 0.48 | 2.36 | 4.82 | 16.1 | 265 | 13.8 |
| 5 | 02477000 | Chickasawhay upper | 33.8 | 1.44 | 5.65 | 12.3 | 39.5 | 844 | 33.8 |
| 6 | 02478500 | Chickasawhay lower | 108 | 7.17 | 22.8 | 49.7 | 120 | 1,126 | 98 |
| 7 | 02479300 | Red | 23.4 | 2.56 | 7.11 | 12.3 | 23.0 | 555 | 15.9 |
| 8 | 02479560 | Escatawpa | 29.4 | 1.97 | 6.84 | 13.8 | 31.9 | 967 | 25.0 |
| 9 | 02482000 | Pearl upper | 29.4 | 0.14 | 1.61 | 7.31 | 34.3 | 635 | 32.7 |
| 10 | 02486500 | Pearl lower | 114 | 4.47 | 7.97 | 31.7 | 144 | 1,300 | 136 |
| 11 | 02487500 | Strong | 16.2 | 0.51 | 1.50 | 3.85 | 11.3 | 852 | 9.8 |
| 12 | 02490900 | Bogue Chitto | 32.5 | 8.95 | 13.4 | 16.8 | 26.2 | 1,178 | 12.8 |
| 13 | 03592100 | Bear | 16.5 | 0.43 | 3.34 | 9.00 | 21.1 | 269 | 17.8 |
| 14 | 07268000 | Little Tallahatchie | 18.5 | 0.38 | 1.36 | 4.86 | 13.5 | 984 | 12.1 |
| 15 | 07287120 | Yazoo upper | 281 | 20.6 | 142 | 223 | 368 | 1,195 | 225 |
| 16 | 07288500 | Big Sunflower | 30.2 | 0.31 | 3.74 | 10.5 | 40.5 | 203 | 36.7 |
| 17 | 07288650 | Bogue Phalia2 | 19.7 | 0.03 | 1.08 | 3.9 | 14.2 | 362 | 13.1 |
| 18 | 07288955 | Yazoo lower2 | 489 | 0.03 | 227 | 340 | 634 | 2,701 | 407 |
| 19 | 07290000 | Big Black | 104 | 3.24 | 11.3 | 32.2 | 127 | 1,408 | 116 |
| 20 | 07290650 | Bayou Pierre | 25.8 | 0.90 | 2.50 | 5.13 | 13.6 | 2,282 | 11.1 |
| 21 | 07375280 | Tangipahoa | 7.52 | 1.86 | 2.85 | 3.80 | 5.94 | 358 | 3.10 |
| 22 | 111B59 | Tuxachanie | 5.06 | 0.06 | 0.63 | 1.66 | 4.62 | 218 | 3.98 |
Table 8.
Summary of streamflow conditions at the time of water-quality sampling across five flow-duration intervals based on flow-duration curves for selected stations from the Mississippi Department of Environmental Quality (MDEQ) ambient water-quality monitoring network and the U.S. Geological Survey (USGS) National Water-Quality Assessment (NAWQA) Project, water years 2008–18.| Site number (fig. 1) | USGS or MDEQ1 station number | Short name | Flow-duration interval greater than 10 percent (high flows) | Flow-duration interval 11–40 percent (moist conditions) |
Flow-duration interval 41–60 percent (midrange flows) |
Flow-duration interval 61–90 percent (dry conditions) |
Flow-duration interval less than 91 percent (low flows) |
|---|---|---|---|---|---|---|---|
| Percentage of water-quality samples collected | |||||||
| 1 | 02436500 | Town | 7 | 33 | 16 | 33 | 11 |
| 2 | 02439400 | Buttahatchee | 11 | 29 | 20 | 30 | 10 |
| 3 | 02443000 | Luxapallila | 13 | 29 | 20 | 29 | 9 |
| 4 | 02476600 | Okatibbee | 14 | 25 | 25 | 26 | 10 |
| 5 | 02477000 | Chickasawhay upper | 12 | 31 | 20 | 27 | 10 |
| 6 | 02478500 | Chickasawhay lower | 12 | 30 | 18 | 29 | 11 |
| 7 | 02479300 | Red | 8 | 28 | 25 | 27 | 12 |
| 8 | 02479560 | Escatawpa | 10 | 24 | 24 | 32 | 10 |
| 9 | 02482000 | Pearl upper | 14 | 27 | 17 | 35 | 7 |
| 10 | 02486500 | Pearl lower | 8 | 29 | 26 | 28 | 9 |
| 11 | 02487500 | Strong | 7 | 35 | 24 | 26 | 8 |
| 12 | 02490900 | Bogue Chitto | 10 | 28 | 19 | 34 | 9 |
| 13 | 03592100 | Bear | 10 | 34 | 20 | 26 | 10 |
| 14 | 07268000 | Little Tallahatchie | 11 | 31 | 18 | 32 | 8 |
| 15 | 07287120 | Yazoo upper | 11 | 33 | 18 | 29 | 9 |
| 16 | 07288500 | Big Sunflower | 13 | 30 | 16 | 33 | 8 |
| 17 | 07288650 | Bogue Phalia2 | 12 | 34 | 20 | 27 | 7 |
| 18 | 07288955 | Yazoo lower2 | 12 | 32 | 18 | 25 | 13 |
| 19 | 07290000 | Big Black | 11 | 30 | 19 | 30 | 10 |
| 20 | 07290650 | Bayou Pierre | 7 | 30 | 21 | 33 | 12 |
| 21 | 07375280 | Tangipahoa | 11 | 26 | 21 | 33 | 9 |
| 22 | 111B59 | Tuxachanie | 10 | 27 | 19 | 31 | 13 |
Water Quality
Data presented in this section characterize the TN and TP concentrations measured in samples from the 22 selected water-quality network stations in Mississippi from WYs 2008 to 2018 (tables 9 and 10). These data provide the basis for analysis of concentrations and estimation of mean annual loads and yields at the selected stations.
Table 9.
Summary statistics for concentrations of total nitrogen in surface-water samples collected from selected streamflow and water-quality monitoring stations from the Mississippi Department of Environmental Quality (MDEQ) ambient water-quality monitoring network and the U.S. Geological Survey (USGS) National Water-Quality Assessment (NAWQA) Project.[mg/L, milligram per liter; <, less than; Streamflow and water-quality data are available in Crain and others (2023) and USGS (2020)]
| Site number (fig. 1) | USGS or MDEQ1 station number | Short name | Number of water-quality observations (censored values2) | Total nitrogen, in mg/L | |||||
|---|---|---|---|---|---|---|---|---|---|
| Mean | Minimum | Quartile values | Maximum | ||||||
| 25th | 50th (median) | 75th | |||||||
| 1 | 02436500 | Town | 131 (0) | 1.30 | 0.21 | 0.90 | 1.19 | 1.54 | 4.07 |
| 2 | 02439400 | Buttahatchee | 130 (0) | 0.54 | 0.12 | 0.37 | 0.49 | 0.70 | 1.38 |
| 3 | 02443000 | Luxapallila | 131 (9) | 0.45 | <0.05 | 0.30 | 0.42 | 0.60 | 1.03 |
| 4 | 02476600 | Okatibbee | 130 (1) | 1.33 | <0.05 | 0.71 | 1.12 | 1.90 | 3.96 |
| 5 | 02477000 | Chickasawhay upper | 131 (1) | 0.94 | <0.05 | 0.59 | 0.84 | 1.17 | 3.12 |
| 6 | 02478500 | Chickasawhay lower | 131 (1) | 0.54 | <0.05 | 0.36 | 0.51 | 0.68 | 1.88 |
| 7 | 02479300 | Red | 126 (7) | 0.43 | <0.05 | 0.33 | 0.41 | 0.53 | 1.12 |
| 8 | 02479560 | Escatawpa | 130 (3) | 0.47 | <0.05 | 0.38 | 0.45 | 0.54 | 1.38 |
| 9 | 02482000 | Pearl upper | 131 (0) | 0.89 | 0.13 | 0.64 | 0.84 | 1.09 | 2.12 |
| 10 | 02486500 | Pearl lower | 131 (0) | 1.56 | 0.11 | 0.91 | 1.34 | 2.12 | 3.41 |
| 11 | 02487500 | Strong | 132 (0) | 0.96 | 0.11 | 0.74 | 0.88 | 1.05 | 2.54 |
| 12 | 02490900 | Bogue Chitto | 132 (0) | 0.79 | 0.30 | 0.61 | 0.75 | 0.92 | 1.61 |
| 13 | 03592100 | Bear | 130 (1) | 0.93 | <0.05 | 0.67 | 0.88 | 1.12 | 3.16 |
| 14 | 07268000 | Little Tallahatchie | 131 (0) | 0.96 | 0.30 | 0.66 | 0.88 | 1.16 | 2.98 |
| 15 | 07287120 | Yazoo upper | 131 (1) | 1.00 | <0.05 | 0.66 | 0.93 | 1.28 | 2.33 |
| 16 | 07288500 | Big Sunflower | 131 (0) | 1.95 | 0.36 | 1.19 | 1.83 | 2.53 | 5.57 |
| 17 | 07288650 | Bogue Phalia3 | 102 (0) | 1.84 | 0.25 | 0.94 | 1.61 | 2.33 | 5.95 |
| 18 | 07288955 | Yazoo lower3 | 132 (0) | 1.29 | 0.37 | 0.89 | 1.15 | 1.53 | 4.00 |
| 19 | 07290000 | Big Black | 132 (2) | 0.92 | <0.05 | 0.63 | 0.85 | 1.14 | 2.06 |
| 20 | 07290650 | Bayou Pierre | 130 (4) | 0.53 | <0.05 | 0.30 | 0.43 | 0.65 | 1.86 |
| 21 | 07375280 | Tangipahoa | 132 (0) | 0.73 | 0.24 | 0.55 | 0.67 | 0.85 | 2.37 |
| 22 | 111B59 | Tuxachanie | 132 (7) | 0.35 | <0.05 | 0.24 | 0.32 | 0.43 | 1.49 |
Table 10.
Summary statistics for concentrations of total phosphorus in surface-water samples collected from selected streamflow and water-quality monitoring stations from the Mississippi Department of Environmental Quality (MDEQ) ambient water-quality monitoring network and the U.S. Geological Survey (USGS) National Water-Quality Assessment (NAWQA) Project.[mg/L, milligram per liter; <, less than; Streamflow and water-quality data are available in Crain and others (2023) and USGS (2020)]
| Site number (fig. 1) | USGS or MDEQ1 station number | Short name | Number of water-quality observations (censored values2) | Total phosphorus, in mg/L | |||||
|---|---|---|---|---|---|---|---|---|---|
| Mean | Minimum | Quartile values | Maximum | ||||||
| 25th | 50th (median) |
75th | |||||||
| 1 | 02436500 | Town | 131 (1) | 0.18 | <0.01 | 0.11 | 0.15 | 0.22 | 0.70 |
| 2 | 02439400 | Buttahatchee | 130 (19) | 0.06 | <0.01 | 0.03 | 0.04 | 0.06 | 1.05 |
| 3 | 02443000 | Luxapallila | 131 (21) | 0.04 | <0.01 | 0.02 | 0.04 | 0.05 | 0.23 |
| 4 | 02476600 | Okatibbee | 130 (3) | 0.10 | <0.01 | 0.06 | 0.09 | 0.12 | 0.90 |
| 5 | 02477000 | Chickasawhay upper | 131 (4) | 0.07 | <0.01 | 0.05 | 0.07 | 0.08 | 0.58 |
| 6 | 02478500 | Chickasawhay lower | 131 (12) | 0.06 | <0.01 | 0.04 | 0.06 | 0.08 | 0.23 |
| 7 | 02479300 | Red | 126 (40) | 0.04 | <0.01 | <0.01 | 0.03 | 0.05 | 0.23 |
| 8 | 02479560 | Escatawpa | 130 (45) | 0.03 | <0.01 | <0.01 | 0.03 | 0.04 | 0.16 |
| 9 | 02482000 | Pearl upper | 131 (3) | 0.09 | <0.01 | 0.07 | 0.08 | 0.10 | 0.29 |
| 10 | 02486500 | Pearl lower | 131 (0) | 0.21 | 0.02 | 0.12 | 0.16 | 0.24 | 1.12 |
| 11 | 02487500 | Strong | 132 (1) | 0.16 | <0.01 | 0.10 | 0.13 | 0.19 | 0.62 |
| 12 | 02490900 | Bogue Chitto | 132 (1) | 0.11 | <0.01 | 0.07 | 0.09 | 0.12 | 0.34 |
| 13 | 03592100 | Bear | 130 (9) | 0.07 | <0.01 | 0.04 | 0.06 | 0.08 | 0.30 |
| 14 | 07268000 | Little Tallahatchie | 131 (4) | 0.09 | <0.01 | 0.06 | 0.07 | 0.10 | 0.39 |
| 15 | 07287120 | Yazoo upper | 131 (0) | 0.21 | 0.04 | 0.14 | 0.18 | 0.27 | 0.62 |
| 16 | 07288500 | Big Sunflower | 131 (1) | 0.35 | <0.01 | 0.25 | 0.31 | 0.41 | 0.91 |
| 17 | 07288650 | Bogue Phalia3 | 102 (0) | 0.29 | 0.05 | 0.15 | 0.26 | 0.36 | 1.46 |
| 18 | 07288955 | Yazoo lower3 | 132 (0) | 0.30 | 0.09 | 0.18 | 0.24 | 0.34 | 1.72 |
| 19 | 07290000 | Big Black | 132 (1) | 0.26 | <0.01 | 0.17 | 0.21 | 0.29 | 1.11 |
| 20 | 07290650 | Bayou Pierre | 130 (4) | 0.10 | <0.01 | 0.06 | 0.08 | 0.11 | 0.74 |
| 21 | 07375280 | Tangipahoa | 132 (3) | 0.09 | <0.01 | 0.06 | 0.08 | 0.10 | 0.35 |
| 22 | 111B59 | Tuxachanie | 132 (59) | 0.04 | <0.01 | <0.01 | 0.02 | 0.04 | 0.74 |
TN and TP Concentrations
Overall, streamflow at the time of sampling showed a significant (p-value of less than 0.01; linear model) positive correlation with TN and TP concentrations (R2 = 0.4949, TN; R2 = 0.6216, TP). The relation between TN and TP concentrations and streamflow is site-specific, however, with a positive relation at some sites, a negative relation at other sites, and no relation at some sites (figs. 9 and 10). The relation between concentration and streamflow may be more pronounced in streams that are influenced by developed land uses or wastewater treatment facilities. Streams in drainage basins with point-source discharges often have higher nutrient concentrations at low flows, when point-source effluent constitutes a large percentage of streamflow, and often have lower nutrient concentrations at high streamflow, when point-source effluent is diluted by storm runoff. These relations are more pronounced the closer the sampling site is to the point-source discharge site. Five of the 22 sites are near a major point source (wastewater treatment facility). A negative relation between TN concentrations and streamflow was observed at four of the five sampling sites (Town [site no. 1], Okatibbee [site no. 4], Chickasawhay upper [map ref no. 5], and Pearl lower [site no. 10]), and a negative relation between TP concentrations and streamflow was observed at two of the five sampling sites (Town [site no. 1], Pearl lower [site no. 10]). At high streamflows, there is a negative relation with nutrient concentrations at these sites because effluent contributes a smaller portion to the total streamflow which leads to a diluting effect. The exception was the Big Sunflower (site no. 16) site, where a slight positive relation was observed between concentrations and streamflow (figs. 9 and 10). This result may be caused by higher proportions of nonpoint-source contributions in this agriculturally intensive basin.
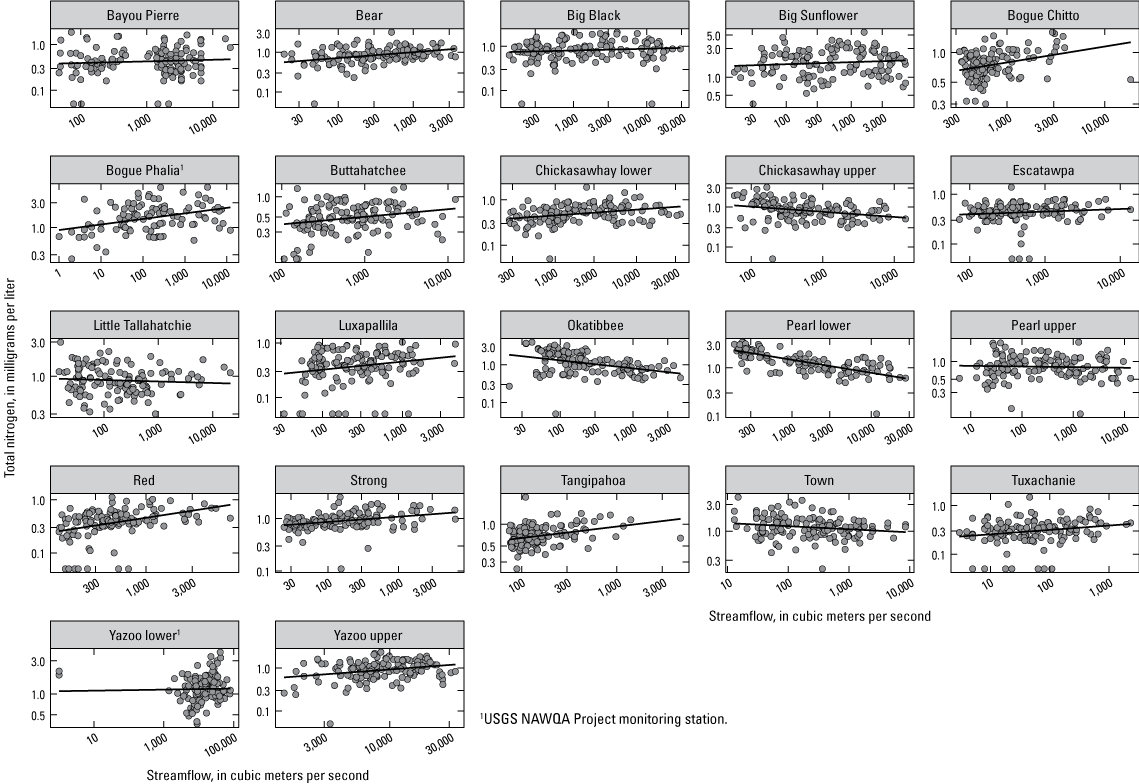
Total nitrogen concentrations in relation to streamflow for selected streamflow and water-quality monitoring stations from the Mississippi Department of Environmental Quality (MDEQ) ambient water-quality monitoring network and the U.S. Geological Survey (USGS) National Water-Quality Assessment (NAWQA) Project.
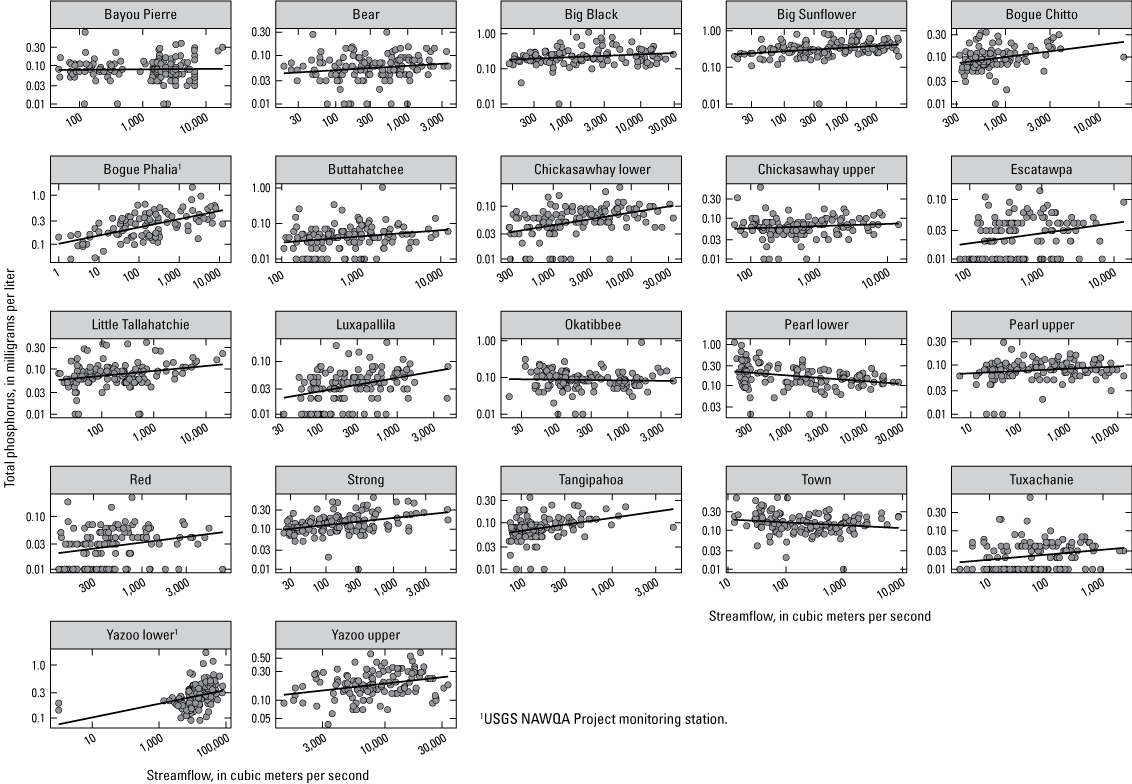
Total phosphorus concentrations in relation to streamflow for selected streamflow and water-quality monitoring stations from the Mississippi Department of Environmental Quality (MDEQ) ambient water-quality monitoring network and the U.S. Geological Survey (USGS) National Water-Quality Assessment (NAWQA) Project.
TN Concentrations
Concentrations of TN varied greatly among sites, ranging from less than 0.05 mg/L to 5.95 mg/L (table 9). The highest median concentration of TN (1.83 mg/L) was measured at Big Sunflower (site no. 16); the lowest median concentration of TN (0.32 mg/L) was measured at Tuxachanie (site no. 22) (table 9; fig. 11A). Six sites had median concentrations of TN greater than 1.0 mg/L (table 9; fig. 12). The spatial distribution of median concentrations of TN observed at the six sites corresponded closely with land use. Three sites are in the Mississippi Delta—Yazoo lower (site no. 18), Big Sunflower (site no. 16), and Bogue Phalia (site no. 17)—where land use is predominantly agriculture (greater than 50 percent). The other three sites are located near urban (developed) areas, downstream of wastewater treatment facilities—Pearl lower (site no. 10, near Jackson), Okatibbee (site no. 4, near Meridian), and Town (site no. 1, near Tupelo).
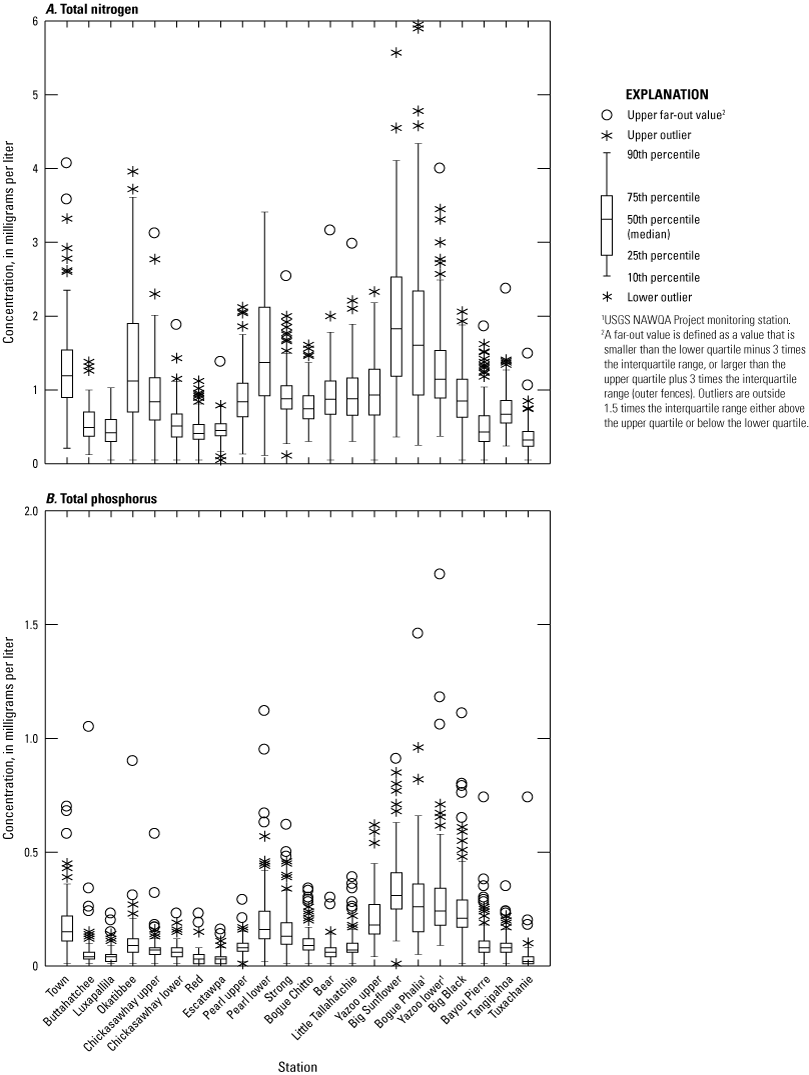
Distribution of A, total nitrogen and B, total phosphorus concentrations at selected streamflow and water-quality monitoring stations from the Mississippi Department of Environmental Quality (MDEQ) ambient water-quality monitoring network and the U.S. Geological Survey (USGS) National Water-Quality Assessment (NAWQA) Project.

Spatial patterns of median concentrations of total nitrogen at selected streamflow and water-quality monitoring stations from the Mississippi Department of Environmental Quality (MDEQ) ambient water-quality monitoring network and the U.S. Geological Survey (USGS) National Water-Quality Assessment (NAWQA) Project.
The seasonal distributions of TN concentrations at the sites were evaluated to identify patterns by examining boxplots showing concentrations as a function of month. Four sites were selected to represent agricultural, mixed, urban, and forested land use in river basins in Mississippi (fig. 13A–D). TN concentrations were typically highest during winter (December–February) and spring (March–May) and lowest during the fall (September–November) at the site representing predominantly agricultural land use basins (fig. 13A). During late fall, plants become dormant, limiting the uptake of available nutrients, and allowing for nutrients to build up in the soil. An increase in precipitation in the spring allows for nutrient runoff into the streams. In addition, nitrogen-based fertilizers are applied in the spring, thus contributing more available nutrients to the soil that potentially can runoff into streams. Conversely, concentrations of TN at the site representing urban land use basins are highest in the summer (June–August) and fall (September–November) because of the constant input of wastewater effluents during lower flows (fig. 13C). Concentrations of TN at the site representing mixed land use basins were lower than at the sites representing agricultural and urban land use basins and slightly increased in late spring and summer (fig. 13B). Concentrations of TN at the site representing forested land use basins generally were very low (less than 1.0 mg/L) (fig. 13D). The low concentrations of TN in forested land use result from nutrient uptake by vegetation and presumably less fertilizer application.
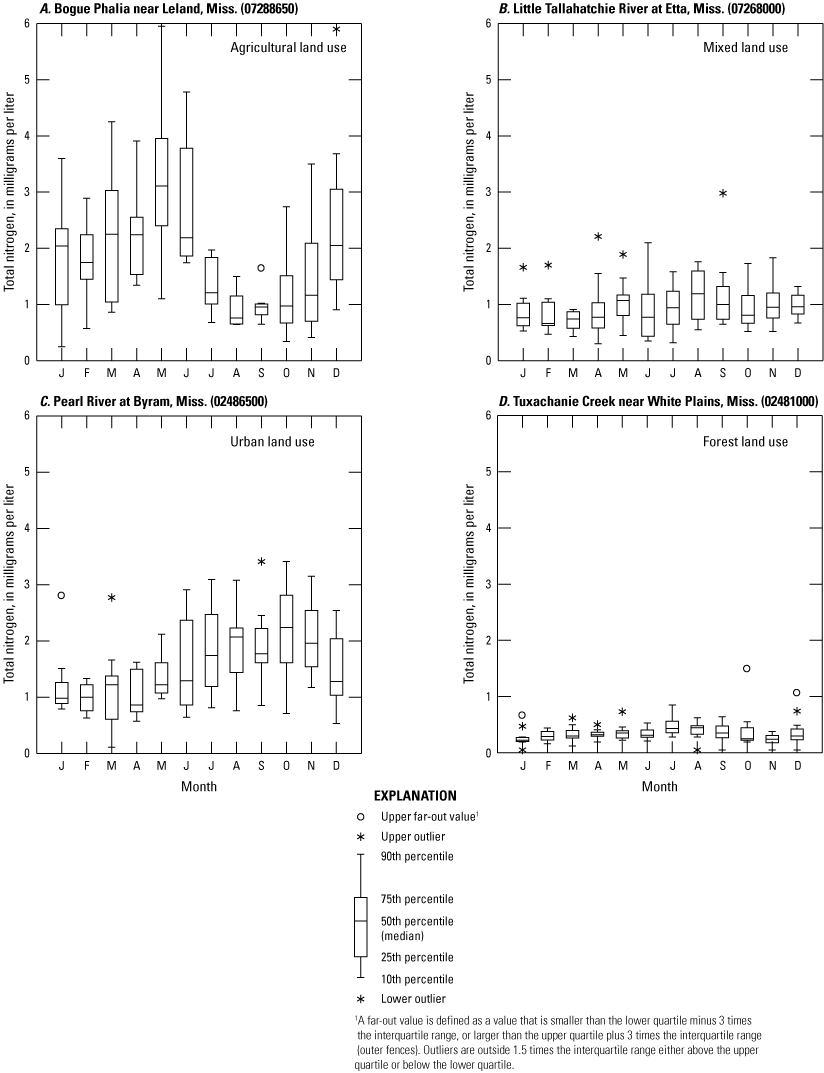
Distribution of monthly concentrations of total nitrogen at select sites representing different land uses for A, agriculture, B, mixed, C, urban, and D, forest in Mississippi, water years 2008–18.
Nutrient concentrations in basin streams are directly related to land use and runoff from associated fertilizer applications and human and animal wastes (Dodds and Smith, 2016). Comparisons of median concentrations of TN among major river basins in Mississippi show that the Yazoo River Basin had the highest median concentration of TN (1.15 mg/L; fig. 14A) when compared to the other basins. The Yazoo River Basin drains large portions of the Mississippi Delta, where agriculture has been and remains a predominant land use. The relation of median TN concentrations to percentage of agricultural land use across sites showed a strong positive correlation as indicated by the Spearman’s rank correlation coefficient (rho = 0.790; p-value = 0.000) (fig. 15A). The Coastal Streams Basin had the lowest median TN concentration (0.32 mg/L; fig. 14A); the Coastal Streams Basin had the highest percentage (51.8 percent) of forested land use and the lowest percentage (2.26 percent) of agricultural land use compared with the other basins. The relation of median TN concentrations to percent forested land use across sites showed a strong negative correlation as indicated by the Spearman’s rank correlation coefficient (rho = −0.624; p-value = 0.000) (fig. 15B). This suggests that forests have considerable capacity to retain and efficiently cycle N and substantially reduce N from entering streams; also, forested areas have minimal N fertilizer application. Median TN concentrations were lower in more developed basins (Tombigbee, Pascagoula, and Pearl) than in predominantly agricultural land use basins, with a median concentration of 0.51 mg/L. Some of the highest TN concentrations in developed sites were downstream of wastewater treatment facilities. However, a weak positive Spearman’s rank correlation coefficient (rho = 0.379; p-value = 1.000) was calculated for the relation between median TN concentrations and percentage of urban land use for the sites in this study (fig. 15C).
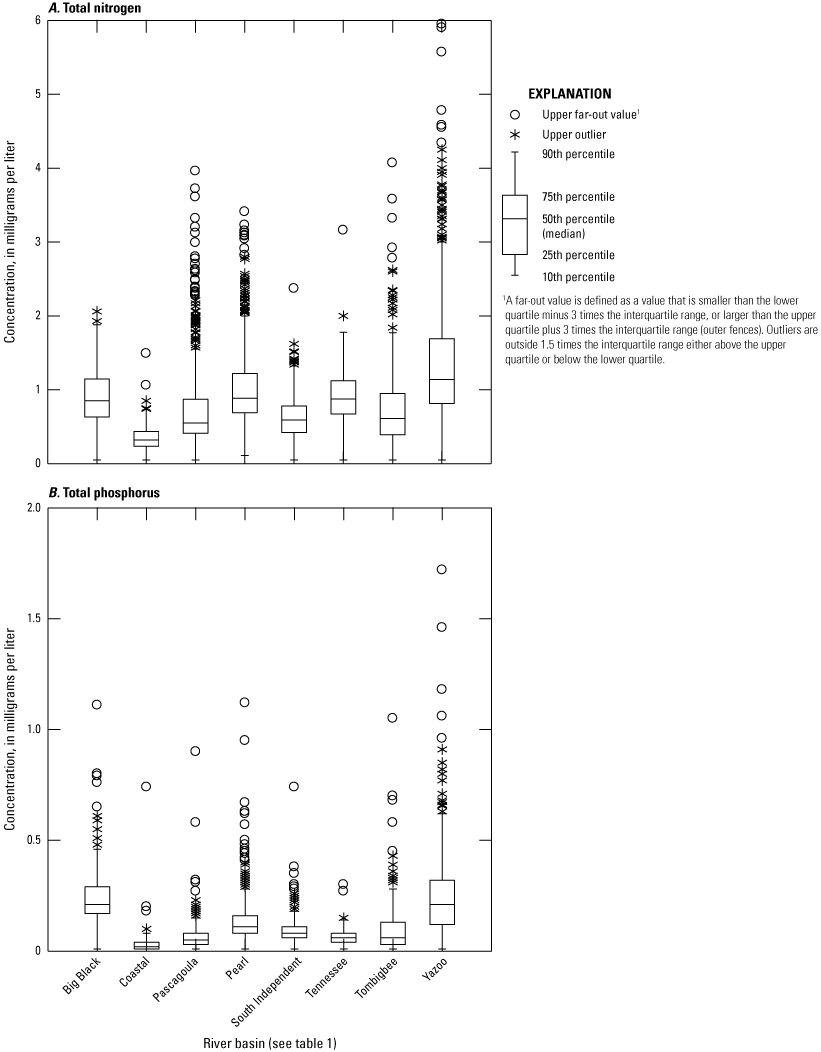
Distribution of A, total nitrogen and B, total phosphorus concentrations by major river basin in Mississippi, water years 2008–18.
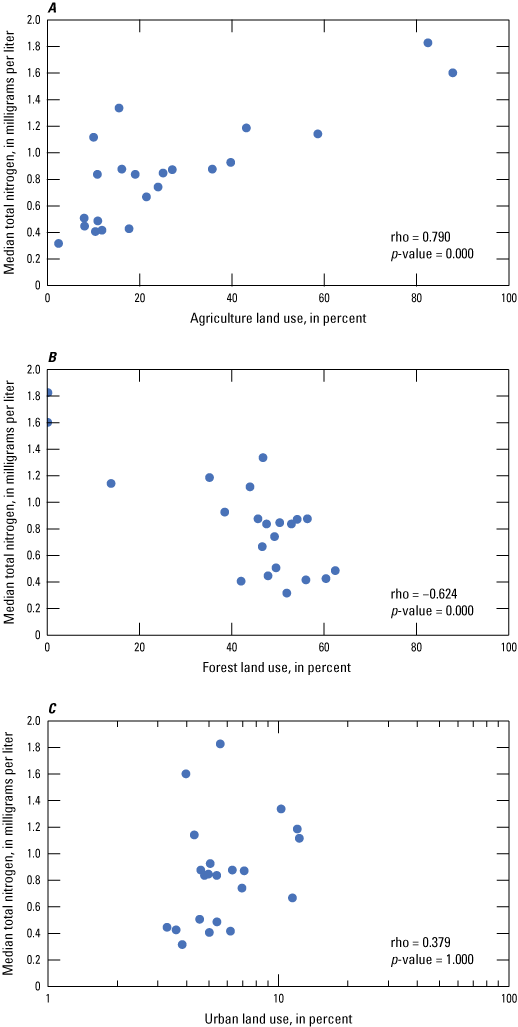
Relation of median total nitrogen concentrations to percentage of A, agriculture, B, forest, and C, urban land use for selected streamflow and water-quality monitoring stations from the Mississippi Department of Environmental Quality (MDEQ) ambient water-quality monitoring network and the U.S. Geological Survey (USGS) National Water-Quality Assessment (NAWQA) Project, water years 2008–18. [rho, Spearman’s rank correlation coefficient; p-value, probability value]
Concentrations of TN varied among the three level III ecoregions in Mississippi, with median TN concentrations ranging from 0.75 mg/L to 1.38 mg/L (Crain and others, 2023). The Mississippi Alluvial Plain ecoregion had the highest median TN concentration, followed by the Mississippi Valley Loess Plains and Southeastern Plains ecoregions (fig. 16A). Again, the intense agricultural land use in basins that drain sites in the Mississippi Delta is a notable reason for the elevated concentrations of TN in the Mississippi Alluvial Plain ecoregion.
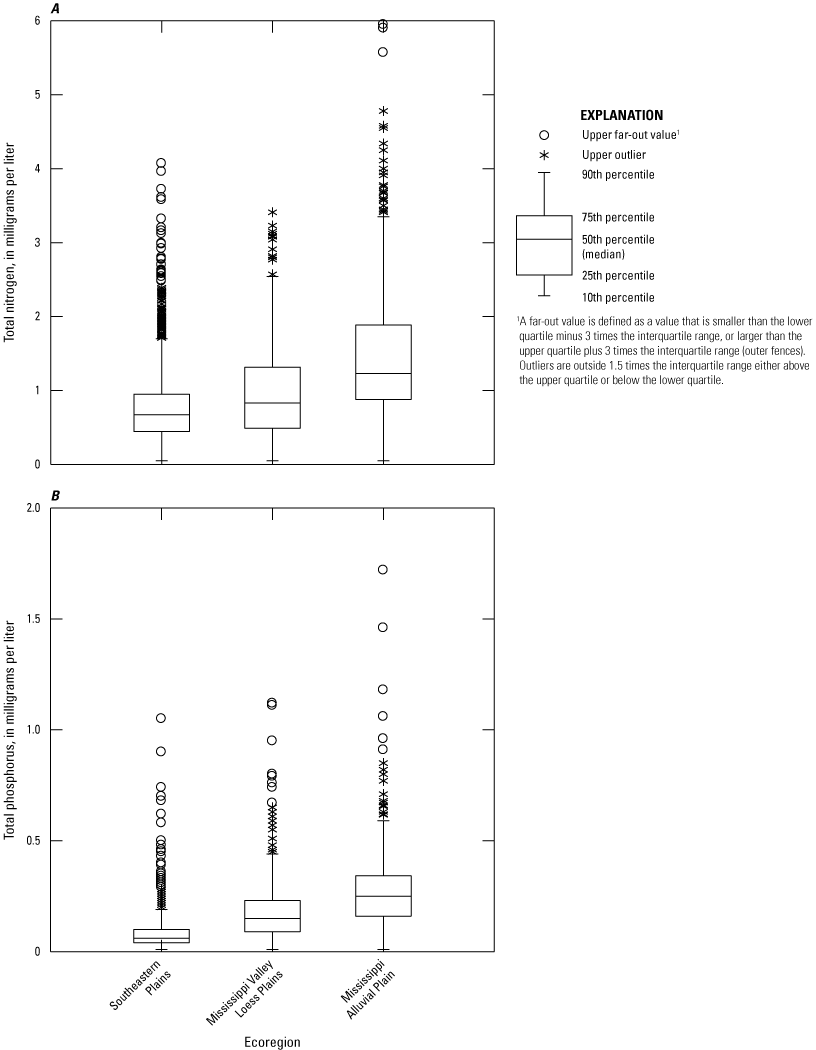
Distribution of A, total nitrogen and B, total phosphorus concentrations by level III ecoregion in Mississippi, water years 2008–18.
Water-quality conditions at a monitoring station may also be affected by the size of the drainage area draining to the location. The TN concentration dataset for the 22 sites represents a wide range of drainage areas (Crain and others, 2023). Drainage areas range in size from 235 to 34,589 km2, with a median value of 1,650 km2. Streams with drainage areas greater than 2,500 km2 have a higher median TN concentration (0.80 mg/L) than streams with drainage areas smaller than 1,000 km2 (median of 0.53 mg/L). However, the overall median concentrations of TN were highly variable across the different-sized drainage areas (fig. 17A). Concentrations of TN had a weak positive correlation with drainage area as indicated by the Spearman’s rank correlation coefficient (rho = 0.206; p-value = 0.357), indicating that concentrations of TN are not highly influenced by the size of the drainage area.
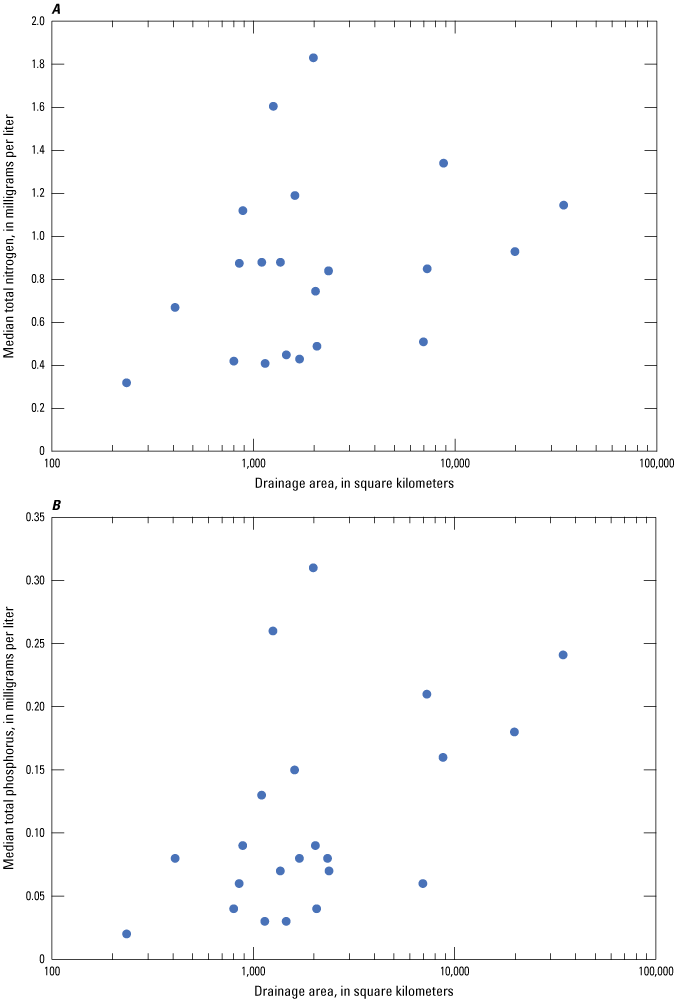
Relation of A, total nitrogen and B, total phosphorus concentrations to drainage area for selected streamflow and water-quality monitoring stations from the Mississippi Department of Environmental Quality (MDEQ) ambient water-quality monitoring network and the U.S. Geological Survey (USGS) National Water-Quality Assessment (NAWQA) Project, water years 2008–18. [rho, Spearman’s rank correlation coefficient; p, probability]
TP Concentrations
Concentrations of TP varied greatly among sites, ranging from less than 0.01 mg/L to 1.72 mg/L (table 10). The highest median concentration of TP (0.31 mg/L) was measured at Big Sunflower (site no. 16); the lowest median concentration of TP (0.02 mg/L) was measured at Tuxachanie (site no. 22) (table 10; figs. 11B and 18). The spatial distribution of median concentrations of TP corresponds closely with land use. Eight sites had median TP concentrations greater than 0.1 mg/L. Four sites with median TP concentrations greater than 0.1 mg/L are in the Mississippi Delta—Yazoo upper (site no. 15), Yazoo lower (site no. 18), Big Sunflower (site no. 16), and Bogue Phalia (site no. 17). The Mississippi Delta has been shown to contain naturally occurring high concentrations of phosphorus in the soils (Coupe, 2002) and groundwater (Welch and others, 2009), as compared to other areas of the state, which may be a source of phosphorus in streams from sediment during precipitation runoff and from return water from agriculture fields during irrigation that uses groundwater as a source. Four additional sites with median TP concentrations greater than 0.1 mg/L are located near urban (developed) areas, downstream of wastewater treatment facilities (Pearl lower [site no. 10, near Jackson] and Town [site no. 1, near Tupelo]), and within mixed land use areas (Big Black [site no. 19] and Strong [site no. 11]).
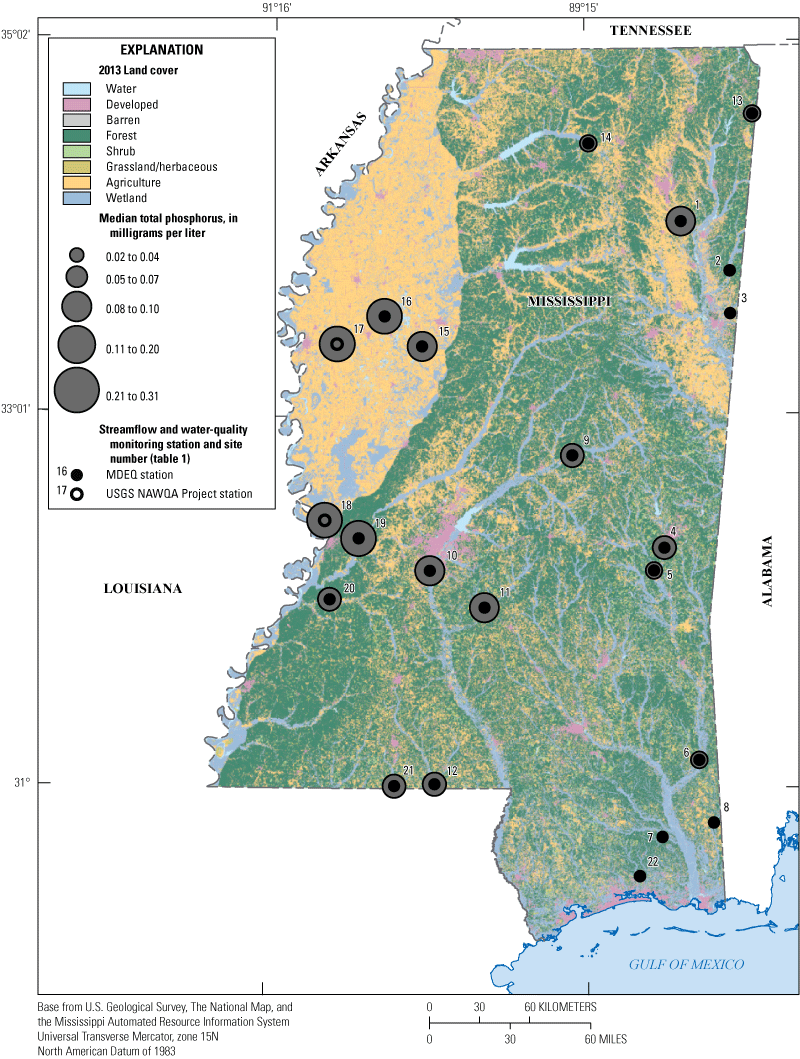
Median concentrations of total phosphorus and land cover at selected streamflow and water-quality monitoring stations from the Mississippi Department of Environmental Quality (MDEQ) ambient water-quality monitoring network and the U.S. Geological Survey (USGS) National Water-Quality Assessment (NAWQA) Project, water years 2008–18.
The seasonal distributions of TP concentrations at the sites were evaluated to identify patterns by examining boxplots showing concentrations as a function of month. Four sites were selected to represent agricultural, mixed, urban, and forested land use in river basins in Mississippi (fig. 19A–D). The relation of TP concentrations to season was like that of median TN concentrations. Median TP concentrations were highest during winter (December–February) and spring (March–May) and lowest during the fall (September–November) at the site representing predominantly agricultural land use basins (fig. 19A). Median concentrations of TP at the site representing mixed land use basins indicate minimal variability among the months (fig. 19B). Median concentrations of TP at the site representing urban land use basins were highest in late summer (July–August) and fall (September–November) (fig. 19C). Median concentrations of TP at the site representing forested land use basins generally were very low (less than 0.02 mg/L) (fig. 19D). Low concentrations of TP in forested land use can result from nutrient uptake and storage by vegetation and minimal phosphorus-based fertilizer application.
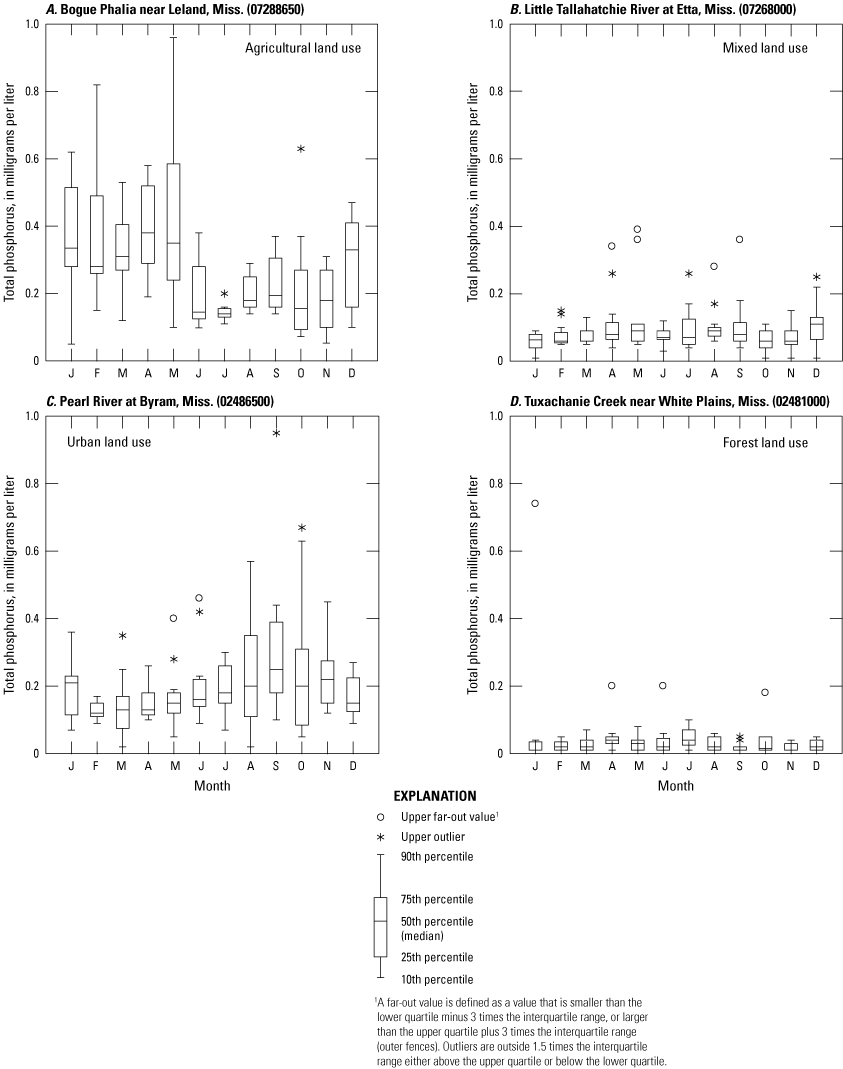
Distribution of monthly concentrations of total phosphorus at select sites representing different land uses for A, agriculture, B, mixed, C, urban, and D, forest in Mississippi, water years 2008–18.
Patterns in variability of median TP concentrations among basins were similar to patterns observed for median TN concentrations, except for the Big Black River Basin. The Big Black River Basin and the Yazoo River Basin had the highest median concentrations of TP (0.21 mg/L) (fig. 14B). The Big Black River and most of its tributaries transport large amounts of suspended sediment (MDEQ, 2003), possibly because of minimal riparian vegetation in the headwaters and because of riverbank erosion. Results from the 2012 USGS SPAtially Referenced Regressions on Watershed attributes (SPARROW) suspended-sediment model indicate that the Big Black River ranks third highest for suspended-sediment yields among 16 of the 21 ambient water-quality network sites used as SPARROW calibration sites in Mississippi (Robertson and Saad, 2019). River systems having large amounts of suspended sediment, such as the Big Black River Basin, generally have higher concentrations of P. The higher concentrations of P are due to the sorption of P to soil particles and streambed sediments, runoff of soils, and resuspension of streambed sediments during high-flow periods.
As stated earlier in the discussion of TN concentrations, the Yazoo River Basin drains large portions of the Mississippi Delta, where agriculture has been and remains a predominant land use. The relation of median TP concentrations to percentage of agricultural land use across sites showed a strong positive correlation as indicated by the Spearman’s rank correlation coefficient (rho = 0.834; p-value = 0.000) (fig. 20A). The Coastal Streams Basin had the lowest median TP concentrations (0.02 mg/L; fig. 14B), presumably because the Coastal Streams Basin has the highest percentage (51.8 percent) of forested land use and the lowest percentage (2.26 percent) of agricultural land use compared with the other basins. A negative Spearman’s rank correlation coefficient (rho = −0.555; p-value = 0.000) was calculated for the relation between median TP concentrations and percentage of forested land use across the sites (fig. 20B). A weak positive Spearman’s rank correlation coefficient (rho = 0.047; p-value = 1.000) was calculated for the relation between median TP concentrations and percentage of urban land use across the sites (fig. 20C).
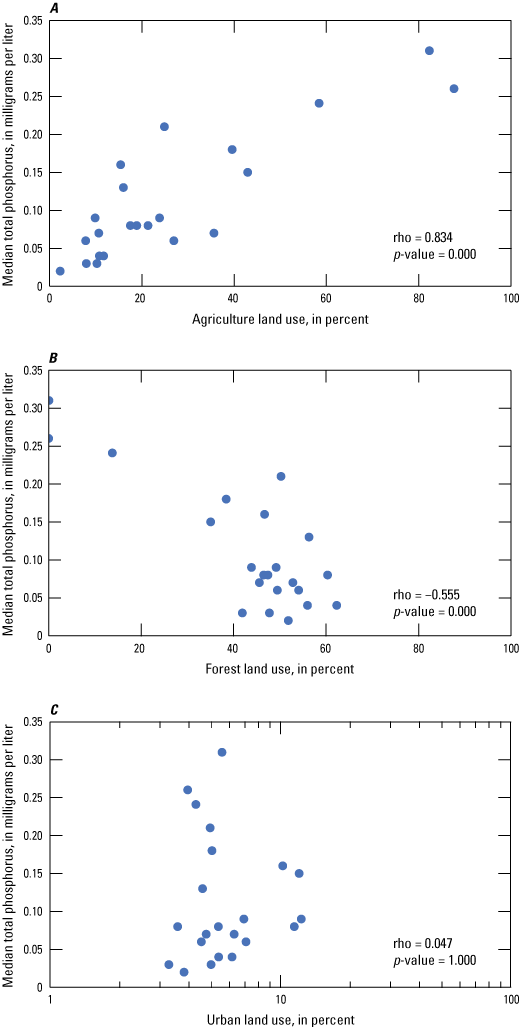
Relation of median total phosphorus concentrations to percentage of A, agriculture, B, forest, and C, urban land use for selected streamflow and water-quality monitoring stations from the Mississippi Department of Environmental Quality (MDEQ) ambient water-quality monitoring network and the U.S. Geological Survey (USGS) National Water-Quality Assessment (NAWQA) Project, water years 2008–18. [rho, Spearman’s rank correlation coefficient; p-value, probability value]
The concentrations of TP varied among the three level III ecoregions in Mississippi as was observed with concentrations of TN. The Mississippi Alluvial Plain ecoregion had the highest median TP concentration, followed by the Mississippi Valley Loess Plains and Southeastern Plains ecoregions (fig. 16B). Again, the source of TP at sites in the Mississippi Alluvial Plain may be from naturally high concentrations in the soils and from irrigation water using groundwater that contains naturally high concentrations of TP.
Streams with drainage-basin areas greater than 2,500 km2 have a higher median TP concentration (0.16 mg/L) than basins smaller than 1,000 km2 (0.05 mg/L; Crain and others, 2023). However, the overall median concentrations of TP were variable across the different-sized drainage areas (fig. 17B). Concentrations of TP had a strong positive correlation with drainage-basin area, as indicated by a Spearman’s rank correlation coefficient (rho = 0.458; p-value = 0.032). This result suggests that concentrations of TP are somewhat influenced by the size of the drainage-basin area.
Estimated Mean Annual Nutrient Loads and Yields, 2008–18
Load represents the mass (expressed in kilograms) of a given water-borne constituent moving past a given point per unit of time. Mean annual loads (in kilograms per year) for TN and TP were estimated by using MDEQ water-quality data and USGS streamflow and water-quality data from WYs 2008 to 2018 at 22 stream-water-quality stations in Mississippi (tables 11 and 12) (Crain and others, 2023).
Table 11.
Mean annual total nitrogen loads and yields estimated from concentrations in water-quality samples collected at selected streamflow and water-quality monitoring stations from the Mississippi Department of Environmental Quality (MDEQ) ambient water-quality monitoring network and the U.S. Geological Survey (USGS) National Water-Quality Assessment (NAWQA) Project, water years 2008–18.[km2, square kilometer; WRTDS, Weighted Regressions on Time, Discharge, and Season; <, less than; ±, plus or minus; kg/yr, kilograms per year; (kg/yr)/km2, kilograms per year per square kilometer; RL7, rloadest 7-parameter regression; --, data not available]
| Site number (fig. 1) | USGS or MDEQ1 station number | Short name | Drainage area (km2) | Model selected | WRTDS flux statistic | rloadest model 7 flux statistic | Flux bias ratio (<+0.10 is acceptable) | Estimated mean annual total nitrogen load (kg/yr) | Standard error of prediction (±) | Estimated mean annual total nitrogen yield ([kg/yr]/km2) |
|---|---|---|---|---|---|---|---|---|---|---|
| 1 | 02436500 | Town | 1,606 | WRTDS | −0.011 | 0.039 | −0.050 | 816,500 | -- | 508 |
| 2 | 02439400 | Buttahatchee | 2,067 | RL7 | 0.016 | 0.001 | 0.014 | 620,500 | 37,030 | 300 |
| 3 | 02443000 | Luxapallila | 800 | WRTDS | 0.024 | 0.011 | 0.013 | 204,200 | -- | 255 |
| 4 | 02476600 | Okatibbee | 886 | WRTDS | 0.018 | 0.059 | −0.040 | 385,800 | -- | 435 |
| 5 | 02477000 | Chickasawhay upper | 2,378 | WRTDS | 0.011 | 0.058 | −0.047 | 840,400 | -- | 353 |
| 6 | 02478500 | Chickasawhay lower | 6,967 | WRTDS | 0.010 | 0.084 | −0.073 | 2,004,000 | -- | 288 |
| 7 | 02479300 | Red | 1,142 | WRTDS | 0.069 | 0.047 | 0.021 | 425,500 | -- | 373 |
| 8 | 02479560 | Escatawpa | 1,456 | RL7 | 0.107 | 0.047 | 0.060 | 486,100 | 39,600 | 334 |
| 9 | 02482000 | Pearl upper | 2,341 | RL7 | 0.004 | 0.023 | −0.019 | 768,200 | 41,600 | 328 |
| 10 | 02486500 | Pearl lower | 8,767 | RL7 | −0.006 | −0.010 | 0.004 | 3,421,000 | 203,800 | 390 |
| 11 | 02487500 | Strong | 1,101 | WRTDS | 0.032 | 0.002 | 0.030 | 657,800 | -- | 597 |
| 12 | 02490900 | Bogue Chitto | 2,033 | RL7 | 0.153 | 0.008 | 0.145 | 881,300 | 60,160 | 433 |
| 13 | 03592100 | Bear | 852 | WRTDS | 0.007 | 0.073 | −0.067 | 549,600 | -- | 645 |
| 14 | 07268000 | Little Tallahatchie | 1,362 | WRTDS | −0.029 | 0.013 | −0.042 | 564,500 | -- | 414 |
| 15 | 07287120 | Yazoo upper | 19,813 | WRTDS | 0.051 | 0.042 | 0.009 | 9,627,000 | -- | 486 |
| 16 | 07288500 | Big Sunflower | 1,987 | WRTDS | 0.065 | 0.043 | 0.022 | 1,968,000 | -- | 990 |
| 17 | 07288650 | Bogue Phalia2 | 1,254 | WRTDS | -- | -- | -- | 1,272,0003 | -- | 1,014 |
| 18 | 07288955 | Yazoo lower2 | 34,589 | WRTDS | -- | -- | -- | 20,874,000 | -- | 603 |
| 19 | 07290000 | Big Black | 7,283 | RL7 | 0.034 | 0.023 | 0.011 | 3,115,000 | 244,200 | 428 |
| 20 | 07290650 | Bayou Pierre | 1,694 | WRTDS | 0.143 | 0.128 | 0.015 | 1,031,000 | -- | 609 |
| 21 | 07375280 | Tangipahoa | 409 | RL7 | 0.093 | 0.008 | 0.085 | 189,600 | 13,440 | 464 |
| 22 | 111B59 | Tuxachanie | 235 | WRTDS | 0.045 | 0.035 | 0.009 | 74,700 | -- | 318 |
Table 12.
Mean annual total phosphorus loads and yields estimated from concentrations in water-quality samples collected at selected streamflow and water-quality monitoring stations from the Mississippi Department of Environmental Quality (MDEQ) ambient water-quality monitoring network and the U.S. Geological Survey (USGS) National Water-Quality Assessment (NAWQA) Project, water years 2008–18.[km2, square kilometer; WRTDS, Weighted Regressions on Time, Discharge, and Season; kg/yr, kilograms per year; (kg/yr)/km2 , kilograms per year per square kilometer; BRE, Beale’s-ratio estimator; REG, regression; --, data not available]
| Site number (fig. 1) |
USGS or MDEQ1 station number | Short name | Drainage area (km2) | Model selected | WRTDS flux statistic | BRE strata | Estimated mean annual total phosphorus load (kg/yr) | Standard error of prediction (±) | Estimated mean annual total phosphorus yield ([kg/yr]/km2) |
|---|---|---|---|---|---|---|---|---|---|
| 1 | 02436500 | Town | 1,606 | WRTDS | −0.0157 | -- | 128,400 | -- | 80 |
| 2 | 02439400 | Buttahatchee | 2,067 | WRTDS | −0.0008 | -- | 69,800 | -- | 34 |
| 3 | 02443000 | Luxapallila | 800 | WRTDS | 0.1120 | -- | 21,000 | -- | 26 |
| 4 | 02476600 | Okatibbee | 886 | WRTDS | −0.0687 | -- | 44,200 | -- | 50 |
| 5 | 02477000 | Chickasawhay upper | 2,378 | WRTDS | 0.0326 | -- | 89,600 | -- | 38 |
| 6 | 02478500 | Chickasawhay lower | 6,967 | BRE | -- | 4 | 253,400 | 59,200 | 36 |
| 7 | 02479300 | Red | 1,142 | WRTDS | 0.1430 | -- | 33,100 | -- | 29 |
| 8 | 02479560 | Escatawpa | 1,456 | WRTDS | 0.0873 | -- | 39,800 | -- | 27 |
| 9 | 02482000 | Pearl upper | 2,341 | WRTDS | 0.0391 | -- | 83,000 | -- | 35 |
| 10 | 02486500 | Pearl lower | 8,767 | WRTDS | 0.0485 | -- | 552,800 | -- | 63 |
| 11 | 02487500 | Strong | 1,101 | BRE | -- | 6 | 118,200 | 11,830 | 107 |
| 12 | 02490900 | Bogue Chitto | 2,033 | BRE | -- | 6 | 127,100 | 11,280 | 63 |
| 13 | 03592100 | Bear | 852 | WRTDS | 0.0164 | 39,900 | -- | 47 | |
| 14 | 07268000 | Little Tallahatchie | 1,362 | WRTDS | 0.0560 | -- | 73,200 | -- | 54 |
| 15 | 07287120 | Yazoo upper | 19,813 | WRTDS | −0.0021 | -- | 1,975,000 | -- | 100 |
| 16 | 07288500 | Big Sunflower | 1,987 | WRTDS | 0.0849 | -- | 421,200 | -- | 212 |
| 17 | 07288650 | Bogue Phalia2 | 1,254 | REG | -- | -- | 3293,000 | -- | 234 |
| 18 | 07288955 | Yazoo lower2 | 34,589 | WRTDS | -- | -- | 5,717,000 | -- | 165 |
| 19 | 07290000 | Big Black | 7,283 | WRTDS | 0.0700 | -- | 943,100 | -- | 129 |
| 20 | 07290650 | Bayou Pierre | 1,694 | BRE | -- | 6 | 104,900 | 11,710 | 62 |
| 21 | 07375280 | Tangipahoa | 409 | BRE | -- | 7 | 24,700 | 1,560 | 60 |
| 22 | 111B59 | Tuxachanie | 235 | WRTDS | 0.2100 | -- | 6,700 | -- | 29 |
Because the drainage areas for the 22 monitoring sites range from 235 km2 for the Tuxachanie site to 34,589 km2 for the Yazoo lower site, yield (load per unit of drainage area and expressed as kilograms per year per square kilometer) is used instead of load so that comparisons in the change of yield can be made among the 22 monitoring sites.
TN Loads and Yields
Estimated mean annual TN loads ranged from 74,700 kilograms per year (kg/yr) at the Tuxachanie site, which is in the smallest basin in the study, to 20,874,000 kg/yr at the Yazoo lower site, which is in the largest basin in the study (table 11). Load variability is predominantly controlled by basin size and overall streamflow; larger basins generate larger nutrient loads.
Investigating loads transported from upstream to downstream can be helpful for identifying mechanisms of transport and evaluating the relative load contributions from different source areas. A transported load, as defined in this report, represents the load added to a river in an upstream-to-downstream reach that ends with a monitoring site. The transported load is computed by subtracting the upstream site load from the downstream site load. In this study, only the Chickasawhay, Pearl, and Yazoo Rivers had an upstream and a downstream site on the main stem. Almost half of the transported load of TN in the Yazoo (46 percent) and Chickasawhay (42 percent) Rivers occurs at their respective upstream sites, but only 22 percent of the transported load for the Pearl River occurs at the Pearl upper site. Most of the transported load in the Pearl River occurs between the upper and lower monitoring sites.
Yields of TN for river basins and ecoregions are often estimated to evaluate the effectiveness of water-quality management programs. A comparison of nutrient yields among river basins and ecoregions can be useful to water-resource managers when prioritizing basins for water-quality improvements. In general, the highest annual yields of TN were estimated at sites in the Yazoo River Basin, with the highest annual TN yield being 1,014 kilograms per year per square kilometer ([kg/yr]/km2) at the Bogue Phalia site (table 11). The lowest annual yields of TN (less than 300 [kg/yr]/km2) were estimated at the Luxapallila site in the Tombigbee River Basin and the Chickasawhay lower site in the Pascagoula River Basin. TN yields for the basins are shown in figure 21.
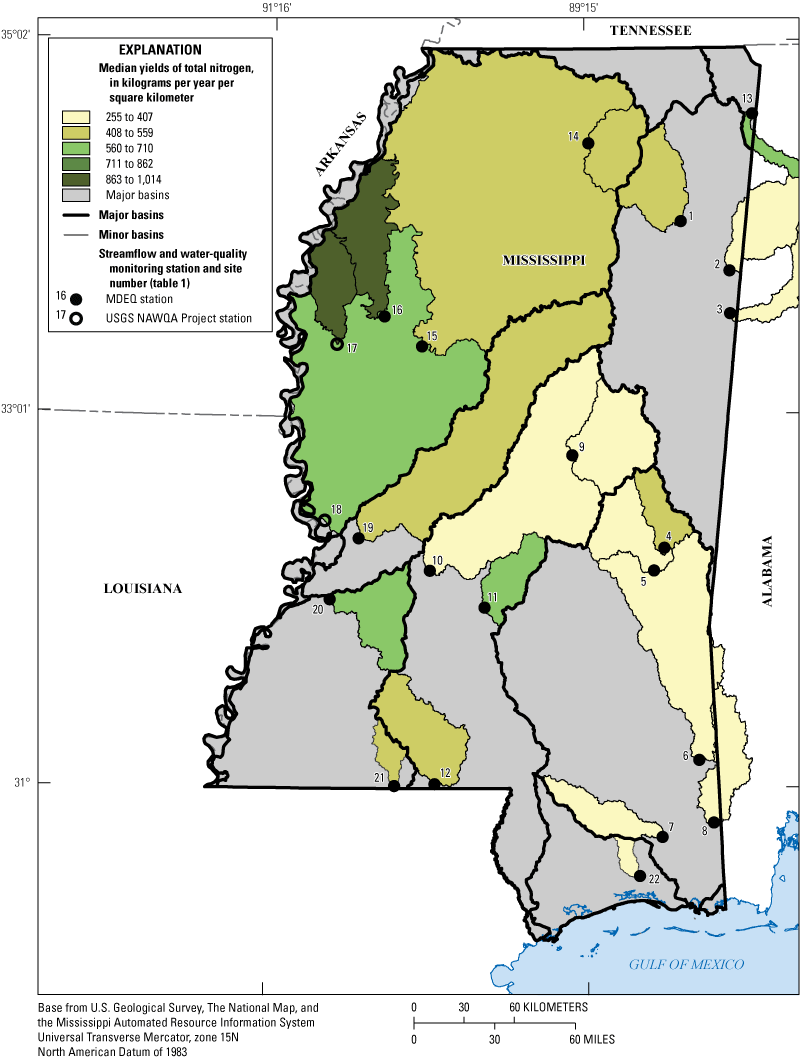
Median yields of total nitrogen at selected streamflow and water-quality monitoring stations from the Mississippi Department of Environmental Quality (MDEQ) ambient water-quality monitoring network and the U.S. Geological Survey (USGS) National Water-Quality Assessment (NAWQA) Project, water years 2008–18.
The relation between land use and TN yields was evaluated to determine whether differences in TN yields are discernible among different percentages of three land use types (agricultural, developed [urban], and forest) at the monitoring sites. A strong positive Spearman’s rank correlation coefficient (rho = 0.781; p-value = 0.000) was calculated for the relation of mean TN yield to percentage of agricultural land use across the sites (fig. 22A). A negative Spearman’s rank correlation coefficient (rho = −0.718; p-value = 0.001) was calculated for the relation of mean TN yield to percentage of forested land use across the sites (fig. 22B). A weak positive Spearman’s rank correlation coefficient (rho = 0.123; p-value = 1.000) was calculated for the relation of mean TN yield to percentage of urban land use across the sites (fig. 22C).
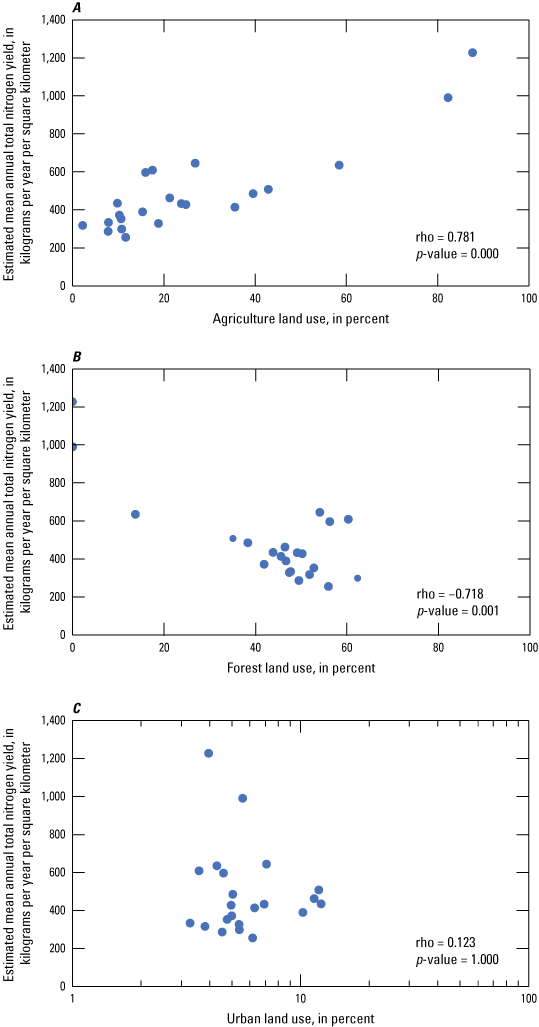
Relation of estimated mean annual total nitrogen yields to percentages of A, agriculture, B, forest, and C, urban land use for selected streamflow and water-quality monitoring stations from the Mississippi Department of Environmental Quality (MDEQ) ambient water-quality monitoring network and the U.S. Geological Survey (USGS) National Water-Quality Assessment (NAWQA) Project, water years 2008–18. [rho, Spearman’s rank correlation coefficient; p-value, probability value]
TP Loads and Yields
Estimated mean annual TP loads ranged from 6,700 kg/yr at the Tuxachanie site in the Coastal Streams Basin to 5,717,000 kg/yr at the Yazoo lower site in the Yazoo River Basin (table 12). In this study, only the Chickasawhay, Pearl, and Yazoo Rivers had an upstream and a downstream site on the main stem. Transported TP loads were investigated for all streams with both an upstream and downstream monitoring site. Mean annual loads of TP were 2.7-fold (Yazoo River), 2.8-fold (Chickasawhay River), and 6.7-fold (Pearl River) larger at the downstream monitoring site than at the upstream monitoring site on each river. Based on drainage-area size differences, the Yazoo River receives relatively equal loads above and below the upper site, the Chickasawhay River receives a greater load above the upper site than above the lower site, and the Pearl River receives a greater TP load above the lower site as compared to the upper site. The large loads above the upper site of the Chickasawhay River and between the upper and lower sites of the Pearl River are likely due to effluent from the Meridian and Jackson publicly owned treatment works, respectively, during the period of record.
In general, the highest annual yields of TP were estimated at sites in the Yazoo River Basin; the highest estimated annual TP yield was 234 (kg/yr)/km2 at Bogue Phalia (fig. 23; table 12). Sites with the lowest annual yields of TP (less than 30 [kg/yr]/km2) were in the Tombigbee River (one site), Pascagoula River (two sites), and Coastal Streams (one site) Basins.
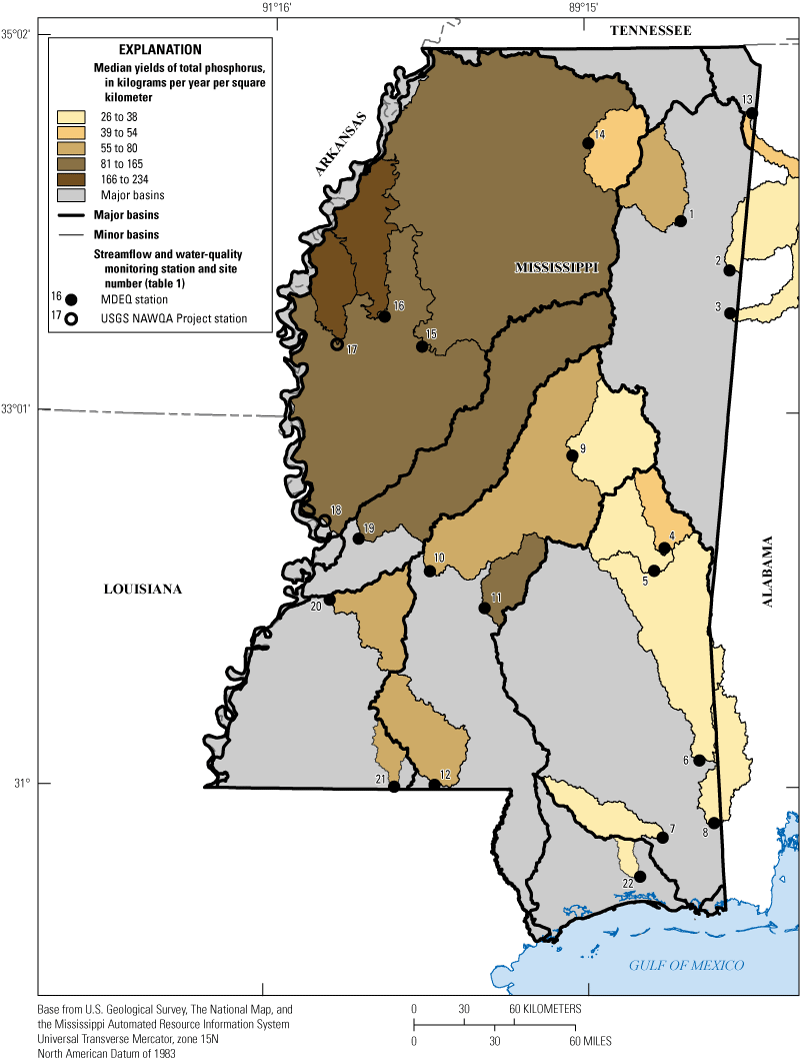
Spatial patterns of median yields of total phosphorus at selected streamflow and water-quality monitoring stations from the Mississippi Department of Environmental Quality (MDEQ) ambient water-quality monitoring network and the U.S. Geological Survey (USGS) National Water-Quality Assessment (NAWQA) Project, water years 2008–18.
The relation between land use and TP yields was evaluated to determine whether differences in TP yields are discernible among different percentages of three land use types (agricultural, urban [developed], and forest) at the monitoring sites. A strong positive Spearman’s rank correlation coefficient (rho = 0.691; p-value = 0.001) was calculated for the relation of mean TP yield to percentage of agricultural land use across the sites (fig. 24A). A weak negative Spearman’s rank correlation coefficient (rho = −0.154; p-value = 1.000) was calculated for the relation of mean TP yield to percentage of forested land use across the sites (fig. 24B). A weak positive Spearman’s rank correlation coefficient (rho = 0.182; p-value = 1.000) was calculated for the relation of mean TP yield to percentage of urban land use across the sites (fig. 24C).
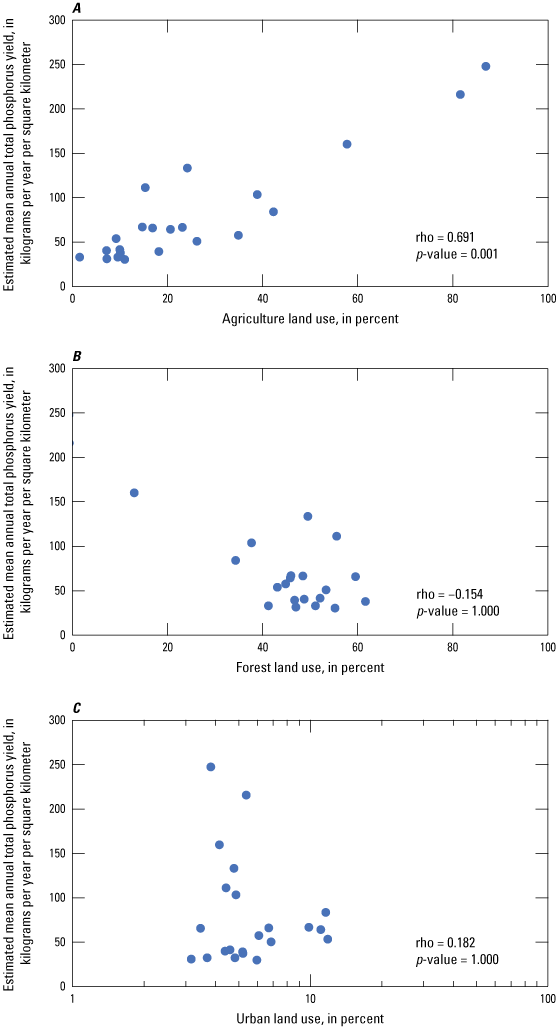
Relation of estimated mean annual total phosphorus yields to percentages of A, agriculture, B, forest, and C, urban land use at selected streamflow and water-quality monitoring stations from the Mississippi Department of Environmental Quality (MDEQ) ambient water-quality monitoring network and the U.S. Geological Survey (USGS) National Water-Quality Assessment (NAWQA) Project, water years 2008–18. [rho, Spearman’s rank correlation coefficient; p-value, probability value]
Trends in Streamflow and Nutrient Loads
Trends in streamflow and nutrient concentrations and loads from WYs 2008 to 2018 are presented in the following sections. The trends in streamflow are presented first because the interpretation of nutrient trends can be improved by understanding how streamflow has changed during the same periods. Nutrient trends have been evaluated spatially to determine whether a pattern of trends occurred in and across basins and ecoregions.
Trends in Streamflow
Changes in streamflow are an important influence on nutrient concentrations and loads in streams. Sources and transport of nutrients in a basin can be influenced by increases or decreases in streamflow. Understanding how streamflow changes through time is critical in assessing how and why nutrient concentrations and loads change through time. Trends in streamflow often result from variability in climatological conditions such as precipitation; however, trends in streamflow also can result from variability in water regulation operations such as diversions and reservoir storage and release in some streams and rivers.
Overall, the streamgages associated with the ambient water-quality network sites had more upward trends in streamflow than downward trends. Of the 20 sites, the greatest increase in streamflow was at the Tuxachanie site, with a 60-percent increase during WYs 2008–18 (table 13). Streamflow at all sites in the Pascagoula River Basin increased during the study period; increases ranged from 32 to 46 percent for 2008–18. Significant (p-value less than or equal to 0.05) trends in streamflow occurred at 16 of the 20 sites during WYs 2008–18 (table 13). The significant streamflow trends at the 16 sites were upward at all but 6 sites. These upward trends occurred at various sites throughout the different major river basins and ecoregions of Mississippi. Trends in streamflow could not be assessed at the two NAWQA sites, because trends were not provided on the National Water Quality Network website (USGS, 2022).
Table 13.
Results of Mann-Kendall analyses for trends and percentage changes in annual mean daily streamflow statistics for streamgages at selected streamflow and water-quality monitoring stations from the Mississippi Department of Environmental Quality (MDEQ) ambient water-quality monitoring network and the U.S. Geological Survey (USGS) National Water-Quality Assessment (NAWQA) Project, water years 2008–18.[Cells shaded in orange indicate upward direction change; cells shaded in green indicate downward direction. Bold numbers are statistically significant. km2, square kilometer; p-value, probability value; <, less than; --, data not available]
| Site number (fig. 1) |
USGS or MDEQ1 station number | Short name | Drainage area (km2) | tau | Annual mean daily streamflow statistics, 2008–18 | |||
|---|---|---|---|---|---|---|---|---|
| p-value | Thiel-Sen slope | Change, in percent | Trend direction, 2008–18 | |||||
| 1 | 02436500 | Town | 1,606 | −0.031 | 0.004 | −0.061 | −2.3 | Downward |
| 2 | 02439400 | Buttahatchee | 2,067 | −0.020 | 0.061 | −0.115 | −2.7 | Downward |
| 3 | 02443000 | Luxapallila | 800 | −0.056 | 0.012 | −0.131 | −20 | Downward |
| 4 | 02476600 | Okatibbee | 886 | 0.005 | 0.613 | 0.009 | 44 | Upward |
| 5 | 02477000 | Chickasawhay upper | 2,378 | 0.030 | 0.004 | 0.139 | 46 | Upward |
| 6 | 02478500 | Chickasawhay lower | 6,967 | 0.073 | <0.001 | 1.320 | 42 | Upward |
| 7 | 02479300 | Red | 1,142 | 0.137 | <0.001 | 0.561 | 37 | Upward |
| 8 | 02479560 | Escatawpa | 1,456 | 0.099 | <0.001 | 0.513 | 32 | Upward |
| 9 | 02482000 | Pearl upper | 2,341 | −0.054 | <0.001 | −0.123 | −8.1 | Downward |
| 10 | 02486500 | Pearl lower | 8,767 | −0.030 | 0.004 | −0.126 | −11 | Downward |
| 11 | 02487500 | Strong | 1,101 | 0.042 | <0.001 | 0.050 | 34 | Upward |
| 12 | 02490900 | Bogue Chitto | 2,033 | 0.124 | <0.001 | 0.362 | 9.3 | Upward |
| 13 | 03592100 | Bear | 852 | 0.023 | 0.028 | 0.075 | 13 | Upward |
| 14 | 07268000 | Little Tallahatchie | 1,362 | −0.048 | <0.001 | −0.067 | −19 | Downward |
| 15 | 07287120 | Yazoo upper | 19,813 | −0.001 | 0.926 | −0.054 | −0.83 | Downward |
| 16 | 07288500 | Big Sunflower | 1,987 | 0.016 | 0.127 | 0.075 | 11 | Upward |
| 17 | 07288650 | Bogue Phalia2 | 1,254 | -- | -- | -- | -- | -- |
| 18 | 07288955 | Yazoo lower2 | 34,589 | -- | -- | -- | -- | -- |
| 19 | 07290000 | Big Black | 7,283 | −0.040 | <0.001 | −0.419 | −5.6 | Downward |
| 20 | 07290650 | Bayou Pierre | 1,694 | 0.073 | <0.001 | 0.138 | 8.3 | Upward |
| 21 | 07375280 | Tangipahoa | 409 | 0.175 | <0.001 | 0.127 | 17 | Upward |
| 22 | 111B59 | Tuxachanie | 235 | 0.126 | <0.001 | 0.009 | 60 | Upward |
Trends in Nutrient Loads
Changes in water quality are often obscured by the year-to-year variations in streamflow; therefore, flow-normalized trends in load are better suited to illustrate how water quality has changed through time. Descriptions for the likelihood of an upward or downward trend depend on the likelihood of the trend direction; for example, if an upward trend is highly likely, then this also means that a downward trend is highly unlikely (table 14). Temporal trends are presented as changes in flow-normalized loads for WYs 2008–18. Trend probability is provided based on the percentage changes for the period of analysis.
Table 14.
Ranges and descriptors for the likelihood of trends.[>, greater than or equal to; <, less than or equal to; <, less than; >, greater than]
Trends in TN Loads
Examination of the mean annual flow-normalized loads of TN for the period of analysis (2008–18) indicate that seven of the sites had a likely to highly likely degree of upward trends ranging from 0.5 percent at the Big Black site to 9.5 percent at the Buttahatchee site (table 15). Four sites, Buttahatchee, Luxapallila, Bear, and Little Tallahatchie, have a highly likely statistical likelihood. Town has a very likely statistical likelihood. Big Black and Yazoo upper have a likely statistical likelihood.
Mean annual flow-normalized loads of TN had downward trends at seven sites; all had a likely to highly likely degree of downward trends. The percentage of change per year ranged from −1.0 percent at the Tangipahoa site to −5.2 percent at the Okatibbee site during WYs 2008–18 (table 15). Flow-normalized TN loads at two sites (Okatibbee and Chickasawhay upper) were statistically described as highly likely, and loads at five sites (Red, Chickasawhay lower, Pearl upper, Tangipahoa, and Tuxachanie) were described as likely having downward trends (table 15). Trends in flow-normalized TN loads were about as likely as not during WYs 2008–18 at six sites. The TN trends at the Bogue Phalia and Yazoo lower site were not determined because of insufficient data.
Table 15.
Trend estimates for flow-normalized loads of total nitrogen and total phosphorus and trend probabilities between 2008 and 2018 for selected streamflow and water-quality monitoring stations from the Mississippi Department of Environmental Quality (MDEQ) ambient water-quality monitoring network and the U.S. Geological Survey (USGS) National Water-Quality Assessment (NAWQA) Project.[Cells shaded in yellow indicate upward direction change; cells shaded in green indicate downward direction; cells shaded in blue indicate no trend. Bold numbers are statistically significant. Statistical likelihoods are defined in table 14. km2, square kilometer; kg, kilogram; NT, no trend; --, data not available]
| Site number (fig. 1) | USGS or MDEQ1 station number | Short name | Drainage area (km2) | Total nitrogen | Total phosphorus | ||||||
|---|---|---|---|---|---|---|---|---|---|---|---|
| Load change (103 kg per year), 2008–18 |
Percent change per year, 2008–18 |
Trend direction, 2008–18 | Statistical likelihood descriptor | Load change (103 kg per year), 2008–18 |
Percent change per year, 2008–18 |
Trend direction, 2008–18 | Statistical likelihood descriptor | ||||
| 1 | 02436500 | Town | 1,606 | 299 | 4.2 | Upward | Very likely | 34.5 | 2.9 | Upward | Highly likely |
| 2 | 02439400 | Buttahatchee | 2,067 | 435 | 9.5 | Upward | Highly likely | 44.5 | 7.8 | Upward | Highly likely |
| 3 | 02443000 | Luxapallila | 800 | 136 | 8.7 | Upward | Highly likely | 11.8 | 7.6 | Upward | Highly likely |
| 4 | 02476600 | Okatibbee | 886 | −345 | −5.2 | Downward | Highly likely | −35.4 | −1.7 | NT | About as likely as not |
| 5 | 02477000 | Chickasawhay upper | 2,378 | −653 | −4.8 | Downward | Highly likely | 13.6 | 1.6 | Upward | Likely |
| 6 | 02478500 | Chickasawhay lower | 6,967 | 308 | −2.3 | Downward | Likely | 47.2 | 0.9 | Upward | Likely |
| 7 | 02479300 | Red | 1,142 | −118 | −2.2 | Downward | Likely | 8.1 | 2.5 | Upward | Likely |
| 8 | 02479560 | Escatawpa | 1,456 | 39.9 | 0.8 | NT | About as likely as not | 27.2 | 10.0 | Upward | Highly likely |
| 9 | 02482000 | Pearl upper | 2,341 | −100 | −1.1 | Downward | Likely | 21.8 | 2.9 | Upward | Highly likely |
| 10 | 02486500 | Pearl lower | 8,767 | 236 | 0.7 | NT | About as likely as not | −127 | −1.9 | Downward | Likely |
| 11 | 02487500 | Strong | 1,101 | 28.1 | 0.4 | NT | About as likely as not | 13.6 | 1.0 | Upward | Likely |
| 12 | 02490900 | Bogue Chitto | 2,033 | 308 | 0.9 | NT | About as likely as not | 54.4 | 3.7 | Upward | Highly likely |
| 13 | 03592100 | Bear | 852 | 227 | 4.8 | Upward | Highly likely | 22.7 | 7.5 | Upward | Highly likely |
| 14 | 07268000 | Little Tallahatchie | 1,362 | 299 | 6.9 | Upward | Highly likely | 2.9 | 5.4 | Upward | Very likely |
| 15 | 07287120 | Yazoo upper | 19,813 | 2,359 | 2.7 | Upward | Likely | 99.8 | 0.5 | Upward | Likely |
| 16 | 07288500 | Big Sunflower | 1,987 | 290 | 1.5 | NT | About as likely as not | −58.1 | −1.2 | Downward | Likely |
| 17 | 07288650 | Bogue Phalia2 | 1,254 | -- | -- | -- | -- | -- | -- | -- | -- |
| 18 | 07288955 | Yazoo lower2 | 34,589 | -- | -- | Upward | -- | -- | -- | Downward | -- |
| 19 | 07290000 | Big Black | 7,283 | 154 | 0.5 | Upward | Likely | 200 | 2.2 | Upward | Likely |
| 20 | 07290650 | Bayou Pierre | 1,694 | 127 | 1.3 | NT | About as likely as not | 39.9 | 3.7 | Upward | Likely |
| 21 | 07375280 | Tangipahoa | 409 | −24.5 | −1.0 | Downward | Likely | 5.9 | 1.9 | NT | About as likely as not |
| 22 | 111B59 | Tuxachanie | 235 | −23.6 | −2.5 | Downward | Likely | 3.0 | 6.3 | Upward | Very likely |
Trends in TP Loads
From WYs 2008 to 2018, flow-normalized TP loads increased with a high degree of likelihood (highly likely and very likely) at 9 of the 22 sites (table 15). For these nine sites, the percentage of change per year ranged from 2.9 percent for the Town and Pearl upper sites to 10.0 percent for the Escatawpa site. Seven sites had likely upward trends with the increases in change ranging from 0.5 percent for the Yazoo upper site to 3.7 percent for the Bayou Pierre site. Trends in flow-normalized TP loads at the Okatibbee and Tangipahoa sites were about as likely as not. Downward trends for TP loads at 2 of the 22 sites were likely. The TP trend in flow-normalized loads at the Bogue Phalia site was not determined because of insufficient data.
Comparing Study Results to Other Published Nutrient Annual Yields and 2012 SPARROW Model Estimates
Loads and yields were compared from models with similar timeframes to assess how well the results agreed and loads and yields were compared from models with different timeframes to assess changes in loads over time. To see how well results agreed with results from models with similar timeframes, study-derived TN and TP average annual yield results were compared to annual nutrient yields of calibration sites for use in regional-scale SPARROW models of the conterminous United States, 2012 base year (hereinafter referred to as “2012 SPARROW-calibration”) (Saad and others, 2019). To understand changes in loads over time, study-derived TN and TP average annual yield results were compared to results from (1) LOADEST regression models for the south-central United States (Rebich and Demcheck, 2007) and (2) the Mississippi Embayment National Water-Quality Assessment Project ESTIMATOR multivariate regression model (Coupe, 1998) (tables 16 and 17). Comparison of results from these independent models may provide an idea of how well the models agree with each other and changes in yields over time.
TN and TP yield estimates at selected Mississippi ambient water-quality network sites in this study were also compared to regional-scale 2012 SPARROW prediction models (hereinafter referred to as “2012 SPARROW-prediction”) for the Southeast and Midwest regions (Hoos and Roland, 2019; Robertson and Saad, 2019). This comparison gives an idea of the accuracy of 2012 SPARROW-prediction-derived loads and yields as compared to load and yield estimates from this study (table 18; fig. 25A, B).
To compare the difference of estimates of mean annual TN and TP yields, an average percent difference in annual yields was quantified between study-derived mean annual yields and the three other models used to estimate mean annual yields. The average difference in estimated mean annual yields (expressed in percent) is defined as
whereAF W, i
is the study-derived estimated annual yield for year i, in kilograms per year per square kilometer; and
AF E, i
is the estimated annual yield for year i, in kilograms per year per square kilometer, derived from either SPARROW-calibration, SPARROW-prediction, LOADEST, or ESTIMATOR.
Positive values for the average percent difference in annual yields indicate that mean annual yields were higher, on average, coming from the study-derived yields, and negative values indicate that, on average, mean annual yields derived from the study were lower than those derived from either SPARROW, LOADEST, or ESTIMATOR. For this study, average percent differences were established as plus or minus 10 percent for mean annual TN yield estimates and plus or minus 20 percent for mean annual TP yield estimates. These accuracy levels of TN and TP estimates were established based on work by Lee and others (2016) who evaluated the accuracy of several load estimation methods.
Table 16.
Study-derived versus the 2012 SPAtially Referenced Regression on Watershed characteristics (SPARROW)-calibration-derived, LOAD ESTimator (LOADEST)-derived, and ESTIMATOR-derived mean annual total nitrogen yields and associated average percent differences at selected streamflow and water-quality monitoring stations from the Mississippi Department of Environmental Quality (MDEQ) ambient water-quality monitoring network and the U.S. Geological Survey (USGS) National Water-Quality Assessment (NAWQA) Project.[TN, total nitrogen; (kg/yr)/km2, kilograms per year per square kilometer; --, no data]
| Site number (fig. 1) |
USGS or MDEQ1 station number | Site short name | Current study-derived estimated mean annual TN yield ([kg/yr]/km2) | 2012 regional-scale SPARROW-calibration estimated mean annual TN yield3 ([kg/yr]/km2) | LOADEST-derived estimated mean annual TN yield4 ([kg/yr]/km2) | ESTIMATOR-derived estimated mean annual TN yield5 ([kg/yr]/km2) | Average percent difference between study-derived and 2012 regional-scale SPARROW-calibration results | Average percent difference between study-derived and LOADEST-derived results | Average percent difference between study-derived and ESTIMATOR-derived results |
|---|---|---|---|---|---|---|---|---|---|
| 1 | 02436500 | Town | 508 | 455 | -- | -- | 11.1 | -- | -- |
| 2 | 02439400 | Buttahatchee | 300 | 280 | -- | -- | 7.0 | -- | -- |
| 3 | 02443000 | Luxapallila | 255 | -- | -- | -- | -- | -- | -- |
| 4 | 02476600 | Okatibbee | 435 | 449 | -- | -- | −3.2 | -- | -- |
| 5 | 02477000 | Chickasawhay upper | 353 | 315 | -- | -- | 11.6 | -- | -- |
| 6 | 02478500 | Chickasawhay lower | 288 | 311 | -- | -- | −7.8 | -- | -- |
| 7 | 02479300 | Red | 373 | 315 | -- | -- | 16.8 | -- | -- |
| 8 | 02479560 | Escatawpa | 334 | 320 | -- | -- | 4.1 | -- | -- |
| 9 | 02482000 | Pearl upper | 328 | 374 | -- | -- | −13.1 | -- | -- |
| 10 | 02486500 | Pearl lower | 390 | 428 | -- | -- | −9.3 | -- | -- |
| 11 | 02487500 | Strong | 597 | 524 | -- | -- | 13.1 | -- | -- |
| 12 | 02490900 | Bogue Chitto | 433 | -- | -- | -- | -- | -- | -- |
| 13 | 03592100 | Bear | 645 | -- | -- | -- | -- | -- | |
| 14 | 07268000 | Little Tallahatchie | 414 | 471 | 799 | -- | −13.0 | −63.5 | -- |
| 15 | 07287120 | Yazoo upper | 486 | -- | -- | -- | -- | -- | -- |
| 16 | 07288500 | Big Sunflower | 990 | 857 | -- | -- | 14.4 | -- | -- |
| 17 | 07288650 | Bogue Phalia5 | 1,014 | 1,207 | 1,490 | -- | −17.4 | −38.0 | -- |
| 18 | 07288955 | Yazoo lower5 | 603 | 621 | 659 | 730 | −2.9 | −8.9 | −19.1 |
| 19 | 07290000 | Big Black | 428 | 482 | -- | -- | −11.9 | -- | -- |
| 20 | 07290650 | Bayou Pierre | 609 | -- | 730 | -- | -- | −18.1 | -- |
| 21 | 07375280 | Tangipahoa | 464 | 522 | -- | -- | −11.9 | -- | -- |
| 22 | 111B59 | Tuxachanie | 318 | -- | -- | -- | -- | -- | -- |
Table 17.
Study-derived versus 2012 SPAtially Referenced Regression on Watershed characteristics (SPARROW)-calibration-derived, LOAD ESTimator (LOADEST)-derived, and ESTIMATOR-derived mean annual total phosphorus yields and associated average percent differences at selected streamflow and water-quality monitoring stations from the Mississippi Department of Environmental Quality (MDEQ) ambient water-quality monitoring network and the U.S. Geological Survey (USGS) National Water-Quality Assessment (NAWQA) Project.[TP, total phosphorus; (kg/yr)/km2, kilograms per year per square kilometer; --, no data]
| Site number (fig. 1) |
USGS or MDEQ1 station number | Site short name | Current study-derived estimated mean annual TP yield ([kg/yr]/km2) | 2012 regional-scale SPARROW-calibration estimated mean annual TP yield2 ([kg/yr]/km2) | LOADEST-derived estimated mean annual TP yield3 ([kg/yr]/km2) | ESTIMATOR-derived estimated mean annual TP yield4 ([kg/yr]/km2) | Average percent difference between study-derived and 2012 regional-scale SPARROW-calibration results | Average percent difference between study-derived and LOADEST-derived results | Average percent difference between study-derived and ESTIMATOR-derived results |
|---|---|---|---|---|---|---|---|---|---|
| 1 | 02436500 | Town | 80 | 126 | -- | -- | −44.8 | -- | -- |
| 2 | 02439400 | Buttahatchee | 34 | 38 | -- | -- | −11.4 | -- | -- |
| 3 | 02443000 | Luxapallila | 26 | -- | -- | -- | -- | -- | -- |
| 4 | 02476600 | Okatibbee | 50 | 57 | -- | -- | −13.0 | -- | -- |
| 5 | 02477000 | Chickasawhay upper | 38 | 31 | -- | -- | 19.6 | -- | -- |
| 6 | 02478500 | Chickasawhay lower | 36 | 36 | -- | -- | 1.6 | -- | -- |
| 7 | 02479300 | Red | 29 | 22 | -- | -- | 27.9 | -- | -- |
| 8 | 02479560 | Escatawpa | 27 | 20 | -- | -- | 29.9 | -- | -- |
| 9 | 02482000 | Pearl upper | 35 | 37 | -- | -- | −3.8 | -- | -- |
| 10 | 02486500 | Pearl lower | 63 | 67 | -- | -- | −6.0 | -- | -- |
| 11 | 02487500 | Strong | 107 | 131 | -- | -- | −20.1 | -- | -- |
| 12 | 02490900 | Bogue Chitto | 63 | -- | -- | -- | -- | -- | -- |
| 13 | 03592100 | Bear | 47 | -- | -- | -- | -- | -- | -- |
| 14 | 07268000 | Little Tallahatchie | 54 | 91 | -- | -- | −51.5 | -- | -- |
| 15 | 07287120 | Yazoo upper | 100 | -- | -- | -- | -- | -- | -- |
| 16 | 07288500 | Big Sunflower | 212 | 207 | -- | -- | 2.4 | -- | -- |
| 17 | 07288650 | Bogue Phalia5 | 234 | 229 | 275 | -- | 2.0 | −16.1 | -- |
| 18 | 07288955 | Yazoo lower5 | 165 | 171 | 135 | 155 | −3.5 | 20.0 | 6.3 |
| 19 | 07290000 | Big Black | 129 | 139 | -- | -- | −6.8 | -- | -- |
| 20 | 07290650 | Bayou Pierre | 62 | -- | 224 | -- | -- | −113.4 | -- |
| 21 | 07375280 | Tangipahoa | 60 | 50 | -- | -- | 19.7 | -- | -- |
| 22 | 111B59 | Tuxachanie | 29 | -- | -- | -- | -- | -- | -- |
Table 18.
Study-derived mean annual total nitrogen and total phosphorus yields and associated average percent differences and the 2012 regional-scale SPAtially Referenced Regression on Watershed characteristics (SPARROW)-predicted mean annual total nitrogen and total phosphorus yields and associated average percent differences at selected streamflow and water-quality monitoring stations from the Mississippi Department of Environmental Quality (MDEQ) ambient water-quality monitoring network and the U.S. Geological Survey (USGS) National Water-Quality Assessment (NAWQA) Project.[(kg/yr)/km2, kilograms per year per square kilometer; --, no data]
| Site number (fig. 1) | USGS or MDEQ1 station number | Site short name | Current study-derived estimated mean annual total nitrogen yield ([kg/yr]/km2) | 2012 regional-scale SPARROW-prediction estimated mean annual total nitrogen yield2 ([kg/yr]/km2) | Average percent difference between study-derived and 2012 regional-scale SPARROW-prediction results | Current study-derived estimated mean annual total phosphorus yield ([kg/yr]/km2) | 2012 regional-scale SPARROW-prediction estimated mean annual total phosphorus yield2 ([kg/yr]/km2) | Average percent difference between study-derived and 2012 regional-scale SPARROW-prediction results |
|---|---|---|---|---|---|---|---|---|
| 1 | 02436500 | Town | 508 | 625 | −20.6 | 80 | 146 | −58.5 |
| 2 | 02439400 | Buttahatchee | 300 | 327 | −8.55 | 34 | 31 | 8.6 |
| 3 | 02443000 | Luxapallila | 255 | 338 | −27.9 | 26 | 30 | −13.3 |
| 4 | 02476600 | Okatibbee | 435 | 436 | −0.13 | 50 | 41 | 19.6 |
| 5 | 02477000 | Chickasawhay upper | 353 | 353 | 0.12 | 38 | 44 | −15.5 |
| 6 | 02478500 | Chickasawhay lower | 288 | 285 | 0.92 | 36 | 38 | −4.4 |
| 7 | 02479300 | Red | 373 | 311 | 18.0 | 29 | 23 | 23.0 |
| 8 | 02479560 | Escatawpa | 334 | 330 | 1.16 | 27 | 23 | 17.2 |
| 9 | 02482000 | Pearl upper | 328 | 510 | −43.4 | 35 | 110 | −100.5 |
| 10 | 02486500 | Pearl lower | 390 | 534 | −31.1 | 63 | 147 | −79.9 |
| 11 | 02487500 | Strong | 597 | 464 | 25.2 | 107 | 68 | 44.9 |
| 12 | 02490900 | Bogue Chitto | 433 | 399 | 8.29 | 63 | 82 | −27.0 |
| 13 | 03592100 | Bear | 645 | 641 | 0.63 | 47 | 79 | −51.1 |
| 14 | 07268000 | Little Tallahatchie | 414 | 460 | −10.5 | 54 | 85 | −45.1 |
| 15 | 07287120 | Yazoo upper | 486 | 419 | 14.8 | 100 | 79 | 23.1 |
| 16 | 07288500 | Big Sunflower | 990 | 795 | 21.9 | 212 | 144 | 38.2 |
| 17 | 07288650 | Bogue Phalia3 | 1,014 | 632 | 46.4 | 234 | 136 | 53.0 |
| 18 | 07288955 | Yazoo lower3 | 603 | 500 | 18.7 | 165 | 87 | 61.9 |
| 19 | 07290000 | Big Black | 428 | 297 | 36.1 | 129 | 78 | 49.6 |
| 20 | 07290650 | Bayou Pierre | 609 | 269 | 77 | 62 | 47 | 27.4 |
| 21 | 07375280 | Tangipahoa | 464 | 378 | 20.3 | 60 | 99 | −48.4 |
| 22 | 111B59 | Tuxachanie | 318 | 346 | −8.47 | 29 | 19 | 40.0 |
Comparing Study Results to Other Published Nutrient Annual Yields
Sixteen of the 22 ambient water-quality network sites were used as SPARROW calibration sites to estimate loads and yields of TN and TP (Saad and others, 2019). The period of water-quality record used for these sites for SPARROW was 2000–14. This period overlaps with the period of record for load and yield estimates in this study (2008–18) and thus may provide an independent validation of results of this study.
Although this study and the 2012 SPARROW-calibration used different load estimation methods and had slightly different periods of record for water-quality samples, the study-derived TN and TP yields compared favorably with the 2012 SPARROW-calibration TN and TP yields (tables 16 and 17). Overall, the total average percent differences between the results from this study and the 2012 SPARROW-calibration results were 10.5 percent for TN yields and 16.5 percent for TP yields. Six of the 16 sites had differences in TN yields less than 10 percent, and 7 of the 16 sites had differences in TP yields less than 10 percent. All other sites had less than a 20 percent difference in TN yields. For TP yields, 11 sites had differences less than 20 percent, 3 had differences between 20 and 30 percent, and 2 had differences greater than 40 percent. Differences for mean annual TN yields varied, with 7 of the 16 sites having higher yields from this study (average of 11.2 percent difference) and 9 having lower yields from this study (average of 10.0 percent difference). Differences in TP yields varied as well, with 7 of 16 sites having higher yields from this study (average of 14.7 percent difference) and 9 having lower yields from this study (average of 17.9 percent difference). In general, the TP mean annual yields have a higher percent difference than the TN mean annual yields, possibly because of the transport processes involving sediment-adsorbed P.
Four of the 22 ambient water-quality network sites are part of the south-central United States regional-scale LOADEST model (Rebich and Demcheck, 2007); the model was based on nutrient data collected from WYs 1993 to 2004. The study-derived mean annual TN yields at the four sites (Little Tallahatchie, Bogue Phalia, Yazoo lower, and Bayou Pierre) were lower than the south-central United States regional-scale LOADEST model results, with an average percent difference of 32.1 percent. Only three sites (Bogue Phalia, Yazoo lower, and Bayou Pierre) could be used to compare the study-derived TP yields with the LOADEST-derived TP yields. Two sites (Bogue Phalia and Bayou Pierre) had lower TP yields from this study, with an average percent difference of 64.7 percent. The Yazoo lower site had a higher TP yield from this study, with a difference of 20.0 percent. The results indicate that yields of TN and TP may be decreasing as compared to 1993–2004 conditions, except for TP at the Yazoo lower site.
The study-derived TN and TP yields for the Yazoo lower site were compared to the results from the Mississippi Embayment National Water-Quality Assessment ESTIMATOR regression model which was based on data from 1996 to 1997 (Coupe, 1998). The TN yield estimated by Coupe (1998) was higher than the TN yield estimated by Rebich and Demcheck (2007) and by this study, providing further evidence that the TN yield has possibly decreased during 1997–2018. The TP yield estimated by Coupe (1998) was more similar to the TP yield estimated during this study (6.3 percent difference) and was higher than the TP yield estimated by Rebich and Demcheck (2007), indicating that TP yield at the Yazoo lower site is slightly higher now (2018) than in previous decades.
Comparing Study Results to 2012 SPARROW-Derived Yields
The SPARROW model is a hybrid statistical and mechanistic model that was developed from monitoring results at numerous long-term monitoring sites. The annual nutrient yields from this study were compared to the 2012 SPARROW-prediction model results at 22 ambient water-quality network sites in Mississippi. Study-derived mean annual TN and TP yields for the 22 ambient water-quality network sites varied in consistency with the 2012 SPARROW-predicted yields (fig. 25), with a difference in TN yields of 20.0 percent and a difference in TP yields of 38.6 percent.
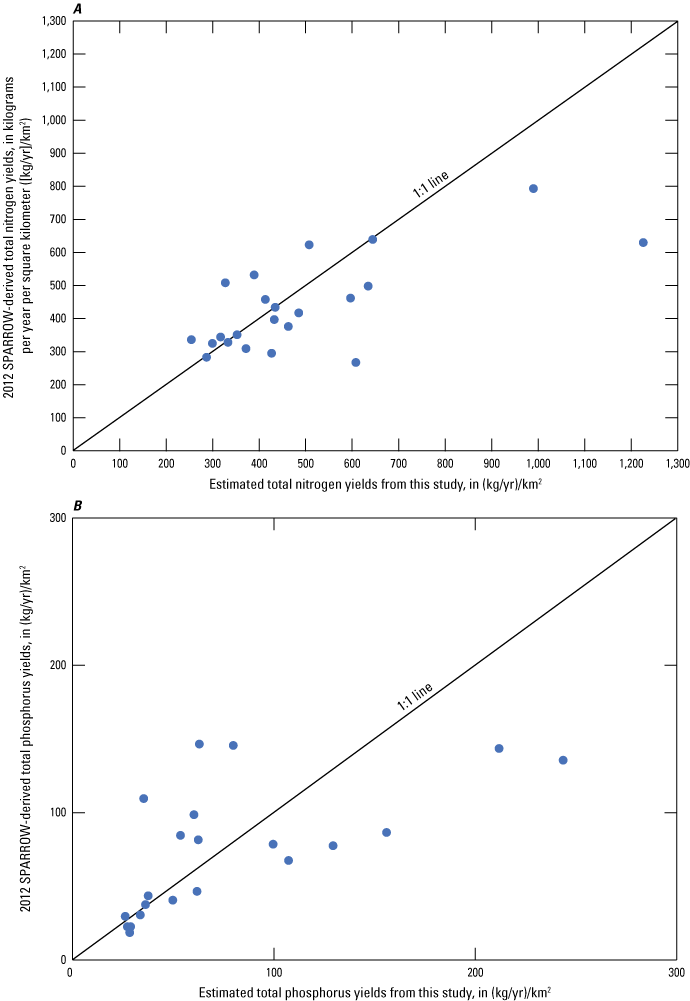
Mean annual yield estimates from this study compared to 2012 regional-scale SPAtially Referenced Regressions on Watershed attributes (SPARROW) model-derived estimates (Hoos and Roland, 2019; Robertson and Saad, 2019) for A, total nitrogen and B, total phosphorus.
The 2012 SPARROW-prediction model overestimated mean annual TN yields for 8 sites (18.8 average percent difference) and underestimated mean annual TN yields for 14 sites (20.7 average percent difference) as compared to TN yield estimates from this study (fig. 25A). TN yields at five of the six sites with the highest TN yields were underestimated by the 2012 SPARROW-prediction model. The TN yields at the five sites in the Pascagoula River Basin were similar, with four of the five sites having less than an average 2 percent difference (table 18). The TN yields at the three sites in the Tombigbee River Basin were overestimated, with an average difference of 19.0 percent. Four of the five monitoring sites in the Yazoo River Basin are in the Mississippi Delta, and TN yields at these four sites were underestimated (average 25.4 percent difference) by the 2012 SPARROW-prediction model. The sites within the remaining basins had over- and underestimations of TN yields.
Study-derived mean annual TP yields for the 22 ambient water-quality network sites are less consistent with the 2012 SPARROW-predicted TP yields as compared to TN yields (fig. 25B), with an overall average percent difference of 38.6 percent. The 2012 SPARROW-prediction model overestimated mean annual TP yields for 10 sites (average of 44.4 percent difference) and underestimated mean annual TP yields for 12 sites (average of 33.9 percent difference) as compared to TP yield estimates from this study. Yield comparisons at sites with lower yields tended to be consistent. Yield comparisons at sites with midrange yields tended to be overestimated by the 2012 SPARROW-prediction models, and those at sites with high yields tended to be underestimated by the 2012 SPARROW-prediction models.
Study-derived mean annual TP yields for sites in the Pascagoula River Basin were similar to the 2012 SPARROW-prediction estimated yields. The study-derived TP yields and the 2012 SPARROW-prediction yields were similar at two sites in the Tombigbee River Basin and were overestimated by the SPARROW model at one site. The 2012 SPARROW-prediction model overestimated the mean annual TP yields at three sites in the Pearl River Basin and underestimated them at one site, all by an average difference of 63.1 percent. Four of the five monitoring sites in the Yazoo River Basin are in the Mississippi Delta and are associated with very high yields; TP yields were underestimated by the 2012 SPARROW-prediction model by an average difference of 44.1 percent. The sites within the remaining basins had over- and underestimations of TP yields
Summary and Conclusions
Since the 1970s, a major pursuit under the Clean Water Act has been managing and reducing nutrient loads to rivers. To assist water-resources managers with those efforts, the U.S. Geological Survey, in cooperation with the Mississippi Department of Environmental Quality, completed a study to estimate and assess trends in mean annual concentrations, loads, and yields of total nitrogen (TN) and total phosphorus (TP) at 20 stream sites in MDEQ’s ambient water-quality monitoring network and 2 stream sites in the U.S. Geological Survey’s National Water-Quality Assessment Project’s monitoring network in Mississippi during water years (WYs) 2008–18.
Streamflow variation across the 22 sites followed precipitation patterns with variability among sites being primarily due to differences in drainage-basin area. Streamflow relations with TN and TP concentrations were site-specific, and strength and direction of the relation were primarily driven by land use in the basin. Water samples were collected over a wide range of flows; therefore, load estimates are representative of a wide range of flows. The annual daily mean streamflow at the streamgages associated with the ambient water-quality network sites had more upward trends than downward trends. Statistically significant upward trends in streamflow occurred at 10 sites, and statistically significant downward trends occurred at 6 sites during WYs 2008–18.
Spatial and temporal variability in TN and TP concentrations across sites corresponded closely with land use. Sites with high percentages of agricultural land use had higher nutrient concentrations. Size of the drainage area did not highly influence concentrations of TN or TP. Median TN concentrations from the 22 sites ranged from 0.32 to 1.83 milligrams per liter. Median TP concentrations ranged from 0.02 to 0.31 milligram per liter.
Multiple load estimation methods were evaluated, but only three were selected to estimate mean annual nutrient loads for this study. Mean annual TN loads were estimated by using the U.S. Geological Survey LOAD ESTimator (LOADEST) seven-parameter regression model or the Weighted Regressions on Time, Discharge, and Season (WRTDS) weighted-regression model. Mean annual TN loads ranged from 74,700 to 20,874,000 kilograms per year; mean annual TN yields ranged from 255 to 1,014 kilograms per year per square kilometer. Mean annual TP loads were estimated by using WRTDS or the Beale’s ratio estimator. Mean annual TP loads ranged from 6,700 to 5,717,000 kilograms per year; mean annual TP yields ranged from 26 to 234 kilograms per year per square kilometer.
The WRTDS method was used to identify trends in flow-normalized annual total loads during WYs 2008–18 for TN and TP. For these WYs, bootstrapped confidence intervals were generated to determine the magnitude, direction, and statistical likelihood (descriptive statement) of trends. Eight sites had statistical likelihoods with high degrees of upward trends of mean annual flow-normalized TN loads; seven sites had high degrees of downward trends; and six sites had statistical likelihoods considered “about as likely as not,” meaning that a site has an equal chance of having an upward or downward trend. Trend results of mean annual flow-normalized loads of TP for the period of analysis (2008–18) showed that 16 sites had upward trends, 3 sites had downward trends, and 2 sites were considered “about as likely as not.”
Several load estimation models have been used to estimate TN and TP loads and yields at sites in river basins in Mississippi. Comparison for similar periods of time among the study-derived mean annual yields from select sites with 2012 SPAtially Referenced Regressions on Watershed attributes (SPARROW)-, LOADEST-, and the Mississippi Embayment National Water-Quality Assessment (ESTIMATOR)-derived yields provided an idea of agreement between models, and comparisons over different time periods provide an estimate of change over time. The average percent difference was generally higher for mean annual TP yields than TN yields, possibly because of the transport processes involving sediment-adsorbed phosphorus. Comparison of study-derived yields to LOADEST-derived and ESTIMATOR-derived yields based on older data (1993–2004 and 1996–7) at select sites indicated decreases in TN yields and no change in TP yields.
Comparison of the study-derived estimates of mean annual TN and TP yields and 2012 SPARROW-prediction yields revealed a mixture of overestimation and underestimation at the ambient water-quality sites by the SPARROW-prediction model. Overall, the 2012 SPARROW-prediction yields had a lower average difference for TN yields (20.0 percent) than for TP yields (38.6 percent). Sites with higher yield values tended to be underestimated by the 2012 SPARROW-prediction model for TN and TP, and all sites located in the Mississippi Delta were underestimated for TN and TP.
The integration of monitoring and modeling is crucial in assessing, understanding, and managing Mississippi’s water quality. Data from this study can be used to provide a basis for future study and refinements to the Mississippi SPARROW model, leading to improvements in the 2012 SPARROW model nutrient loads and yields prediction accuracy and the identification of nutrient sources.
References Cited
Appling, A.P., Leon, M.C., and McDowell, W.H., 2015, Reducing bias and quantifying uncertainty in watershed flux estimates—The R package loadflex: Ecosphere, v. 6, no. 12, article 269, p. 1–25, accessed June 2020 at https://doi.org/10.1890/ES14-00517.1.
Carpenter, S.R., Booth, E.G., and Kucharik, C.J., 2017, Extreme precipitation and phosphorus loads from two agricultural watersheds: Limnology and Oceanography, v. 63, no. 3, p. 1221–1233, accessed February 2021 at https://doi.org/10.1002/lno.10767.
Coupe, R.C., 1998, Concentrations and loads of nitrogen and phosphorus in the Yazoo River, northwestern Mississippi, 1996–1997: U.S. Geological Survey Water-Resources Investigations Report 98–4219, 17 p., accessed April 2020 at https://doi.org/10.3133/wri984219.
Crain, A.S., Hicks, M.B., and Segrest, N.G., 2023, Datasets of streamflow, nutrient concentrations, loads and trends for the Mississippi Ambient Water-Quality Network stations, water years 2008 through 2018: U.S. Geological Survey data release, https://doi.org/10.5066/P9VV2U70.
Gao, X., Chen, N., Yu, D., Wu, Y., and Huang, B., 2018, Hydrological controls on nitrogen (ammonium versus nitrate) fluxes from river to coast in a subtropical region—Observation and modeling: Journal of Environmental Management, v. 213, p. 382–391, accessed March 2021 at https://doi.org/10.1016/j.jenvman.2018.02.051.
Helsel, D.R., Hirsch, R.M., Ryberg, K.R., Archfield, S.A., and Gilroy, E.J., 2020, Statistical methods in water resources: U.S. Geological Survey Techniques and Methods, book 4, chap. A3, 458 p., accessed December 2020 at https://doi.org/10.3133/tm4A3.
Hirsch, R.M., 2014, Large biases in regression-based constituent flux estimates—Causes and diagnostic tools: Journal of the American Water Resources Association, v. 50, no. 6, p. 1401–1424, accessed June 2020 at https://onlinelibrary.wiley.com/doi/10.1111/jawr.12195/full.
Hirsch, R.M., and De Cicco, L.A., 2019, Introduction to the EGRET package: U.S. Geological Survey software release, accessed August 2021 at http://usgs-r.github.io/EGRET/articles/EGRET.html.
Homer, C., Dewitz, J., Jin, S., Xian, G., Costello, C., Danielson, P., Gass, L., Funk, M., Wickham, J., Stehman, S., Auch, R., and Riitters, K., 2020, Conterminous United States land cover change patterns 2001–2016 from the 2016 National Land Cover Database: ISPRS Journal of Photogrammetry and Remote Sensing, v. 162, p. 184–199, accessed November 2020 at https://doi.org/10.1016/j.isprsjprs.2020.02.019.
Hoos, A.B., and Roland, V.L., II, 2019, Spatially referenced models of streamflow and nitrogen, phosphorus, and suspended-sediment loads in the southeastern United States: U.S. Geological Survey Scientific Investigations Report 2019–5135, 87 p., accessed March 2021 at https://doi.org/10.3133/sir20195135.
Mississippi Department of Environmental Quality [MDEQ], 2003, State of Mississippi water quality assessment, 2002 Section 305(b) report—Big Black River Basin supplement: Mississippi Department of Environmental Quality, Office of Pollution Control, Surface Water Division, Water Quality Assessment Branch, 38 p., accessed May 20, 2021, at https://www.mdeq.ms.gov/wp-content/uploads/2017/05/305b_2002_BB.pdf.
Mississippi Department of Environmental Quality [MDEQ], 2020a, Mississippi, 2020, List of impaired water bodies: Mississippi Department of Environmental Quality, 80 p. [Also available at https://www.mdeq.ms.gov/wp-content/uploads/2020/08/DRAFT-FINAL-2020-303d-List-Report-081120.pdf.]
Mississippi Department of Environmental Quality [MDEQ], 2020b, State of Mississippi, water quality assessment, 2020 Section 305(b) report: Mississippi Department of Environmental Quality, Office of Pollution Control, 229 p. [Also available at https://www.mdeq.ms.gov/wp-content/uploads/2021/01/2020_305b_Final.pdf.]
Mississippi Department of Environmental Quality [MDEQ], 2021, Nutrient reduction in Mississippi: Mississippi Department of Environmental Quality, Nonpoint Source Pollution Program web page, accessed April 12, 2021, at https://www.mdeq.ms.gov/water/surface-water/nonpoint-source-pollution-program/nutrient-reduction-in-Mississippi/.
Mississippi River/Gulf of Mexico Watershed Nutrient Task Force, 2008, Gulf hypoxia action plan 2008 for reducing, mitigating, and controlling hypoxia in the northern Gulf of Mexico and improving water quality in the Mississippi River Basin: Washington, D.C., U.S. Environmental Protection Agency, 64 p.
Multi-Resolution Land Characteristics Consortium, 2021, Data: Multi-Resolution Land Characteristics Consortium online database, accessed April 14, 2021, at https://www.mrlc.gov/data.
National Oceanic and Atmospheric Administration [NOAA], 2021, Climate at a glance—Statewide time series: National Oceanic and Atmospheric Administration, National Centers for Environmental Information web page, accessed June 16, 2021, at https://www.ncdc.noaa.gov/cag/.
O’Dell, J.W., ed., 1993, Method 365.1, Determination of phosphorus by semi-automated colorimetry, revision 2.0, in U.S. Environmental Protection Agency, 1993, Methods for the determination of inorganic substances in environmental samples: U.S. Environmental Protection Agency, EPA/600/R–93/100, p. 365.1–1—365.1–17.
Oelsner, G.P., Sprague, L.A., Murphy, J.C., Zuellig, R.E., Johnson, H.M., Ryberg, K.R., Falcone, J.A., Stets, E.G., Vecchia, A.V., Riskin, M.L., De Cicco, L.A., Mills, T.J., and Farmer, W.H., 2017, Water-quality trends in the Nation’s rivers and streams, 1972–2012—Data preparation, statistical methods, and trend results (ver. 2.0, October 2017): U.S. Geological Survey Scientific Investigations Report 2017–5006, 136 p., accessed January 2021 at https://doi.org/10.3133/sir20175006.
Omernik, J.M., and Griffith, G.E., 2008, Ecoregions of Mississippi, in Cleveland, C.J., ed., Encyclopedia of Earth: Washington, D.C., Environmental Information Coalition, National Council for Science and the Environment website, accessed December 4, 2020, at https://editors.eol.org/eoearth/wiki/Ecoregions_of_Mississippi_(EPA).
Patton, C.J., and Kryskalla, J.R., 2003, Methods of analysis by the U.S. Geological Survey National Water Quality Laboratory—Evaluation of alkaline persulfate digestion as an alternative to Kjeldahl digestion for determination of total and dissolved nitrogen and phosphorus in water: U.S. Geological Survey Water-Resources Investigations Report 03–4174, 33 p.
Patton, C.J., and Truitt, E.P., 1992, Methods of analysis by the U.S. Geological Survey National Water Quality Laboratory—Determination of total phosphorus by a Kjeldahl digestion method and an automated colorimetric finish that includes dialysis: U.S. Geological Survey Open-File Report 92–146, 39 p.
Quilbé, R., Rousseau, A.N., Duchemin, M., Poulin, A., Gangbazo, G., and Villeneuve, J.P., 2006, Selecting a calculation method to estimate sediment and nutrient loads in streams—Application to the Beaurivage River (Québec, Canada): Journal of Hydrology (Amsterdam), v. 326, no. 1–4, p. 295–310. [Also available at https://doi.org/10.1016/j.jhydrol.2005.11.008.]
R Core Team, 2018, R—A language and environment for statistical computing: Vienna, Austria, R Foundation for Statistical Computing software release. [Also available at http://www.R-project.org.]
Richards, R.P., and Holloway, J., 1987, Monte Carlo studies of sampling strategies for estimating tributary loads: Water Resources Research, v. 23, no. 10, p. 1939–1948. [Also available at https://doi.org/10.1029/WR023i010p01939.]
Robertson, D.M., and Saad, D.A., 2019, Spatially referenced models of streamflow and nitrogen, phosphorus, and suspended-sediment loads in streams of the Midwestern United States: U.S. Geological Survey Scientific Investigations Report 2019–5114, 74 p., 5 app., accessed January 2021 at https://doi.org/10.3133/sir20195114.
Runkel, R.L., Crawford, C.G., and Cohn, T.A., 2004, Load Estimator (LOADEST)—A FORTRAN program for estimating constituent loads in streams and rivers: U.S. Geological Survey Techniques and Methods, book 4, chap. A5, 69 p. [Also available at https://pubs.usgs.gov/tm/2005/tm4A5/.]
Saad, D.A., Schwarz, G.E., Argue, D.M., Anning, D.W., Ator, S.W., Hoos, A.B., Preston, S.D., Robertson, D.M., and Wise, D.R., 2019, Estimates of long-term mean daily streamflow and annual nutrient and suspended-sediment loads considered for use in regional SPARROW models of the conterminous United States, 2012 base year: U.S. Geological Survey Scientific Investigations Report 2019–5069, 51 p. [Also available at https://doi.org/10.3133/sir20195069.]
SAS Institute, Inc., 2004, SAS 9.1.2 documentation: Cary, N.C., SAS Institute, Inc., accessed January 2021 at https://support.sas.com/documentation/onlinedoc/91pdf/index_912.html.
Sprague, L.A., Hirsch, R.M., and Aulenbach, B.T., 2011, Nitrate in the Mississippi River and its tributaries, 1980 to 2008—Are we making progress?: Environmental Science & Technology, v. 45, no. 17, p. 7209–7216. [Also available at https://doi.org/10.1021/es201221s.]
Stoddard, J.L., Van Sickle, J., Herlihy, A.T., Brahney, J., Paulsen, S., Peck, D.V., Mitchell, R., and Pollard, A.I., 2016, Continental-scale increase in lake and stream phosphorus—Are oligotrophic systems disappearing in the United States?: Environmental Science & Technology, v. 50, no. 7, p. 3409–3415.
U.S. Environmental Protection Agency [EPA], 2021, Level III and IV ecoregions by State: U.S. Environmental Protection Agency website, accessed April 14, 2021, at https://www.epa.gov/eco-research/level-iii-and-iv-ecoregions-state.
U.S. Geological Survey [USGS], 2019, National Water-Quality Assessment (NAWQA), U.S. Geological Survey web page, accessed February 10, 2022, at https://www.usgs.gov/mission-areas/water-resources/science/national-water-quality-assessment-nawqa?field_data_type_target_id=All&field_release_date_va lue=&items_per_page=6.
U.S. Geological Survey [USGS], 2020, USGS water data for the Nation: U.S. Geological Survey National Water Information System database, accessed January 20, 2020, at https://doi.org/10.5066/F7P55KJN.
U.S. Geological Survey [USGS], 2022, Tracking water quality in U.S. streams and rivers—USGS National Water Quality Network data, water-quality loads, and trends, accessed January 12, 2022, at https://nrtwq.usgs.gov/nwqn/#/.
Welch, H.L., Kingsbury, J.A., Tollett, R.W., and Seanor, R.C., 2009, Quality of shallow groundwater and drinking water in the Mississippi Embayment-Texas Coastal uplands aquifer system and Mississippi River Valley alluvial aquifer, south-central United States, 1994–2004: U.S. Geological Survey Scientific Investigations Report 2009–5091, 51 p.
Wolynetz, M.S., 1979, Maximum likelihood estimation in a linear model from confined and censored normal data: Journal of the Royal Statistical Society Series C, Royal Statistical Society, v. 28, no. 2, p. 195–206. [Also available at https://ideas.repec.org/a/bla/jorssc/v28y1979i2p195-206.html.]
Yanai, R.D., Tokuchi, N., Campbell, J.L., Green, M.B., Matsuzaki, E., Laseter, S.N., Brown, C.L., Bailey, A.S., Lyons, P., Levine, C.R., Buso, D.C., Likens, G.E., Knoepp, J.D., and Fukushima, K., 2015, Sources of uncertainty in estimating stream solute export from headwater catchments at three sites: Hydrological Processes, v. 29, no. 7, p. 1793–1805. [Also available at https://doi.org/10.1002/hyp.10265.]
Yang, L., Jin, S., Danielson, P., Homer, C., Gass, L., Bender, S.M., Case, A., Costello, C., Dewitz, J., Fry, J., Funk, M., Granneman, B., Liknes, G.C., Rigge, M., and Xian, G., 2018, A new generation of the United States National Land Cover Database—Requirements, research priorities, design, and implementation strategies: ISPRS Journal of Photogrammetry and Remote Sensing, v. 146, p. 108–123.
Zhang, J., Kelble, C.R., Fischer, C.J., and Moore, L., 2009, Hurricane Katrina induced nutrient runoff from an agricultural area to coastal waters in Biscayne Bay, Florida: Estuarine, Coastal and Shelf Science, v. 84, no. 2, p. 209–218. [Also available at https://doi.org/10.1016/j.ecss.2009.06.026.]
Appendix 1
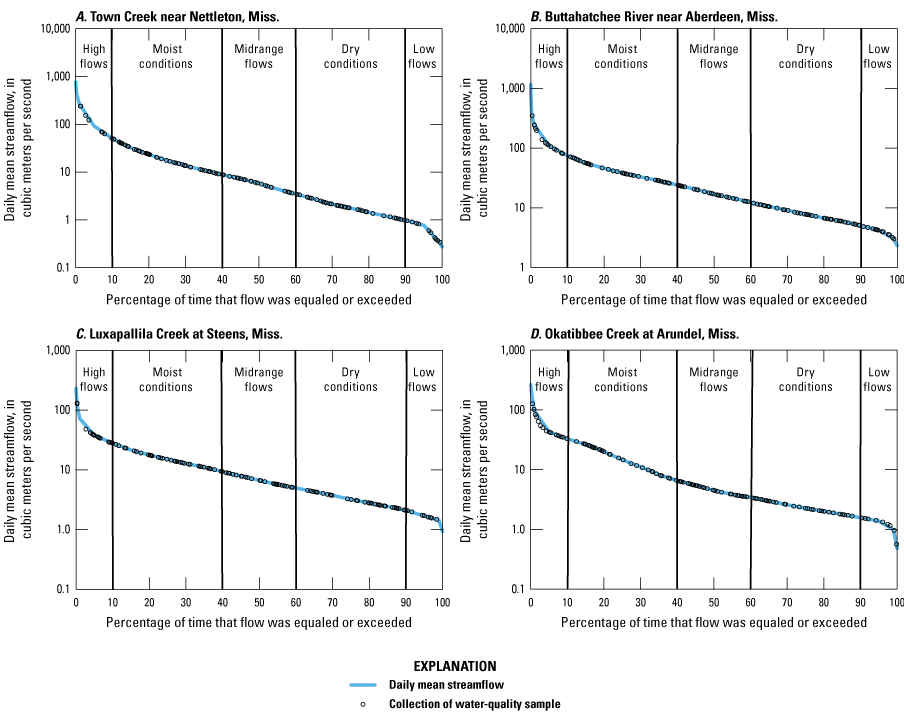
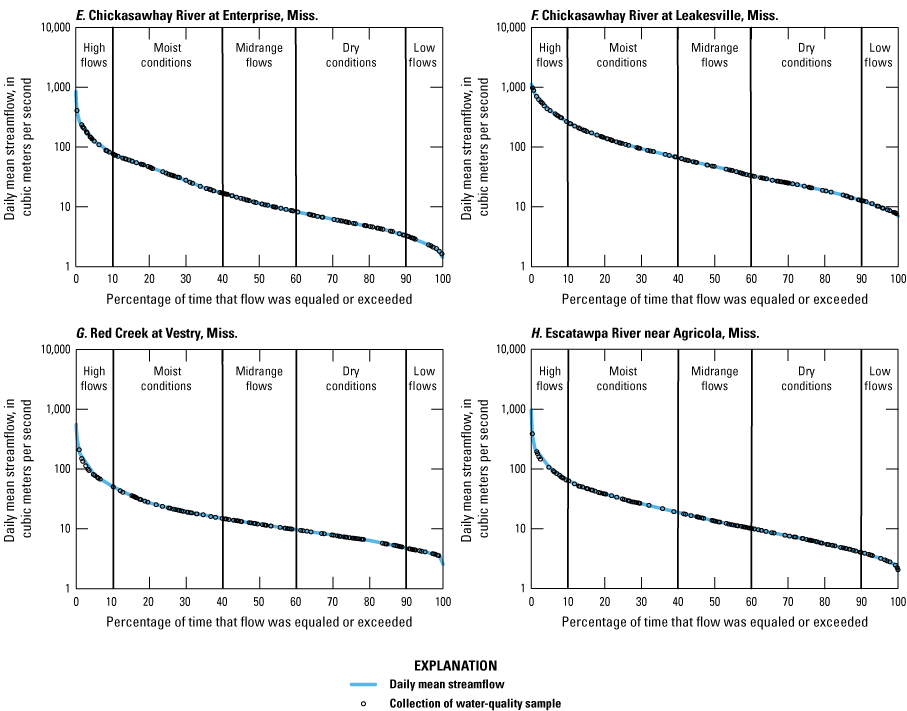
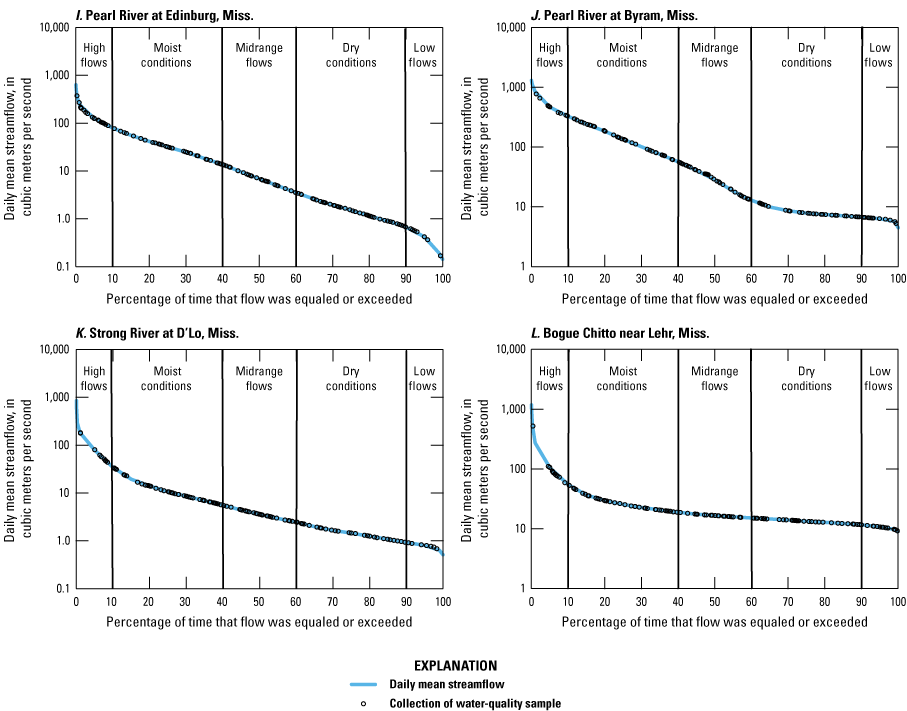

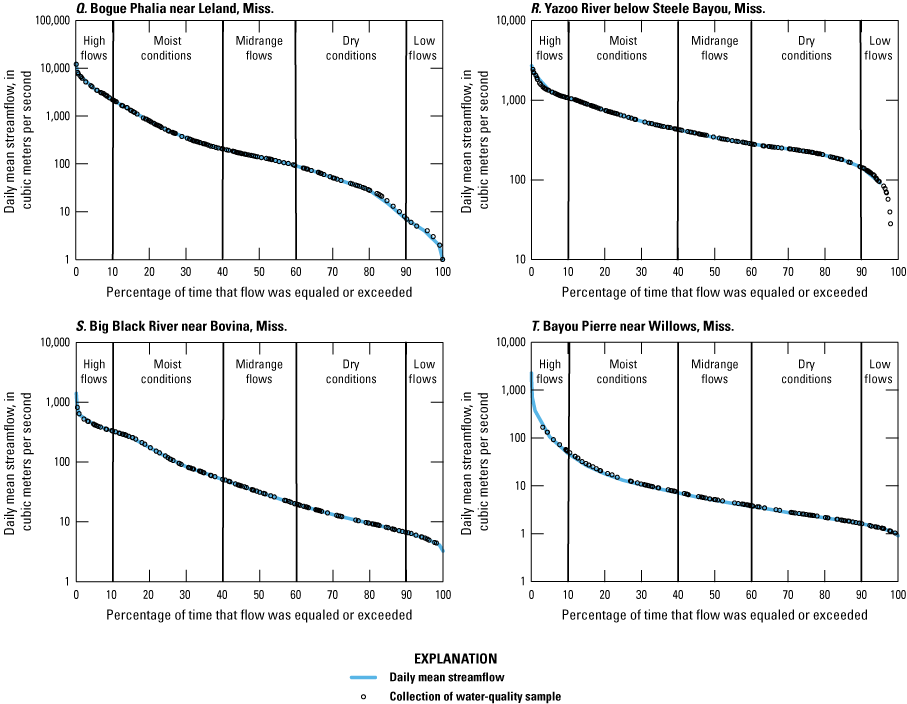
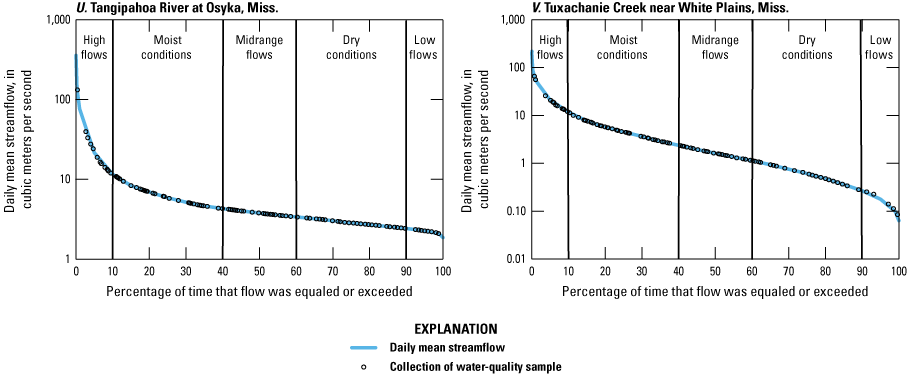
Flow-duration curves showing flow conditions during water-quality sample collection at 20 stream sites from the Mississippi Department of Environmental Quality ambient water-quality monitoring network and 2 stream sites from the U.S. Geological Survey National Water-Quality Assessment Project, Mississippi, water years 2008–18.
Conversion Factors
International System of Units to U.S. customary units
Temperature in degrees Celsius (°C) may be converted to degrees Fahrenheit (°F) as follows: °F = (1.8 × °C) + 32.
Supplemental Information
Concentrations of chemical constituents in water are given in milligrams per liter (mg/L).
Abbreviations
BRE
Beale’s ratio estimator
EPA
U.S. Environmental Protection Agency
FDC
flow-duration curve
HTF
Hypoxia Task Force
MDEQ
Mississippi Department of Environmental Quality
MOVE.1
Maintenance of Variance Extension Type 1
N
nitrogen
NAWQA
National Water-Quality Assessment Project
NLCD
National Land Cover Database
NO3+NO2
nitrate plus nitrite
NOAA
National Oceanic and Atmospheric Administration
P
phosphorus
SPARROW
SPAtially Referenced Regressions on Watershed attributes
SWMP
Surface Water Monitoring Program
TKN
total Kjeldahl nitrogen
TN
total nitrogen
TP
total phosphorus
USGS
U.S. Geological Survey
WRTDS
Weighted Regressions on Time, Discharge, and Season
WY
water year
For more information about this publication, contact
Director, Lower Mississippi-Gulf Water Science Center
U.S. Geological Survey
640 Grassmere Park, Suite 100
Nashville, TN 37211
For additional information, visit
https://www.usgs.gov/centers/lmg-water/
Publishing support provided by
Lafayette Publishing Service Center
Disclaimers
Any use of trade, firm, or product names is for descriptive purposes only and does not imply endorsement by the U.S. Government.
Although this information product, for the most part, is in the public domain, it also may contain copyrighted materials as noted in the text. Permission to reproduce copyrighted items must be secured from the copyright owner.
Suggested Citation
Hicks, M.B., Crain, A.S., and Segrest, N.G., 2023, Status and trends of total nitrogen and total phosphorus concentrations, loads, and yields in streams of Mississippi, water years 2008–18: U.S. Geological Survey Scientific Investigations Report 2023–5003, 77 p., https://doi.org/10.3133/sir20235003.
ISSN: 2328-0328 (online)
Study Area
| Publication type | Report |
|---|---|
| Publication Subtype | USGS Numbered Series |
| Title | Status and trends of total nitrogen and total phosphorus concentrations, loads, and yields in streams of Mississippi, water years 2008–18 |
| Series title | Scientific Investigations Report |
| Series number | 2023-5003 |
| DOI | 10.3133/sir20235003 |
| Publication Date | February 24, 2023 |
| Year Published | 2023 |
| Language | English |
| Publisher | U.S. Geological Survey |
| Publisher location | Reston, VA |
| Contributing office(s) | Lower Mississippi-Gulf Water Science Center |
| Description | Report: x, 77 p.; Data Release; Dataset |
| Country | United States |
| State | Mississippi |
| Online Only (Y/N) | Y |