

Methods to Determine Streamflow Statistics Based on Data Through Water Year 2021 for Selected Streamgages in or near Wyoming
Links
- Document: Report (5.31 MB pdf) , HTML , XML
- Dataset: USGS National Water Information System database - USGS water data for the Nation
- NGMDB Index Page: National Geologic Map Database Index Page (html)
- Download citation as: RIS | Dublin Core
Abstract
The U.S. Geological Survey (USGS), in cooperation with the Wyoming Water Development Office, developed streamflow statistics for streamgages in and near Wyoming. Statistics were computed for active (through September 30, 2021) and discontinued USGS streamgages with 10 or more years of daily mean streamflow record. Streamflow at each streamgage was assessed for degree of human alteration owing to dams and diversions before streamflow statistics were computed. Streamflow records from 615 streamgages were used to compute basic, seasonal, and flow-duration statistics; streamflow records from 387 streamgages were used to compute n-day statistics, which are streamflow statistics describing streamflow over a number of days (n), and statistics that can be used for regional regression. The streamflow statistics are provided in a USGS data publication that accompanies this report and through the USGS StreamStats web-based application (https://www.usgs.gov/streamstats).
Introduction
Streamflow statistics are used across the Nation for engineering; water quality; wildlife management; and other everyday planning, research, and management problems (Risley and others, 2008; Feaster and Guimaraes, 2014). The magnitude and duration of annual low flows, for example, are used to assess the total maximum daily streamflows for water-quality regulation and fish passage in streams. These statistics are computed from daily records at streamgages and are dependent on the dominant climate patterns at each streamgage during its period of record. With increasing length of record, or as the locations of streamgages in stream networks change with time, streamgage records capture additional climatic and landscape variability that can be used to update streamflow statistics.
Previous statistical analyses include mean annual streamflow statistics for selected Wyoming streamgages published in Lowham (1976, 1988). Monthly, annual, and seasonal streamflow statistics provide water users with expected streamflow during specific timeframes, aiding in water management and wildlife conservation. Flow-duration streamflow characteristics provide streamflow-exceedance probabilities used to design stream-related infrastructure, including bridges and dams, and inform hydrologic modeling. High- and low-flow statistics identified by the number of days of streamflow (n-day) provide the duration and frequency of maximum and minimum streamflows and are used to inform wastewater treatment methods, determine total maximum daily loads of streams, and assess health of aquatic habitat. Regression statistics are used to develop regression equations, which can be used to estimate streamflow statistics at ungaged locations.
The U.S. Geological Survey (USGS), in cooperation with the Wyoming Water Development Office, developed streamflow statistics for streamgages in and near the State of Wyoming. Daily mean streamflow data were analyzed to determine statistics for 615 streamgages using data through water year 2021. Daily mean streamflow is the arithmetic mean of all streamflow for a single specified day. A water year is the 12-month period from October 1 to September 30 and is designated by the year in which it ends. The primary objectives of this study were to generate updated streamflow statistics and compute statistics that can be used to develop regional regression equations. Regional regression equations allow users to determine streamflow statistics at other river and stream locations in Wyoming without streamgages.
Purpose and Scope
The purpose of this report is to document methods used to compute streamflow statistics at 615 streamgages in and near Wyoming for 631 streamgage periods of record from water year 1868 to 2021 (fig. 1). The statistics are provided in a USGS data publication accompanying this report (Armstrong and others, 2025). Crest-stage gages and periods of streamgage record with no daily streamflow were not included in the statistical analyses. Zero-flow daily mean streamflows were considered accurate measurements and were included in the statistical analyses. The computation of streamflow statistics for USGS streamgages is part of a larger project to develop a StreamStats application for the State of Wyoming (https://www.usgs.gov/centers/wyoming-montana-water-science-center/science/wyoming-streamstats). StreamStats is a web-based computer program that can be used to delineate drainage areas, determine basin characteristics, and compute statistics at locations with and without streamgages (https://streamstats.usgs.gov/ss/; Ries and others, 2017, 2024; USGS, 2019, 2022a).
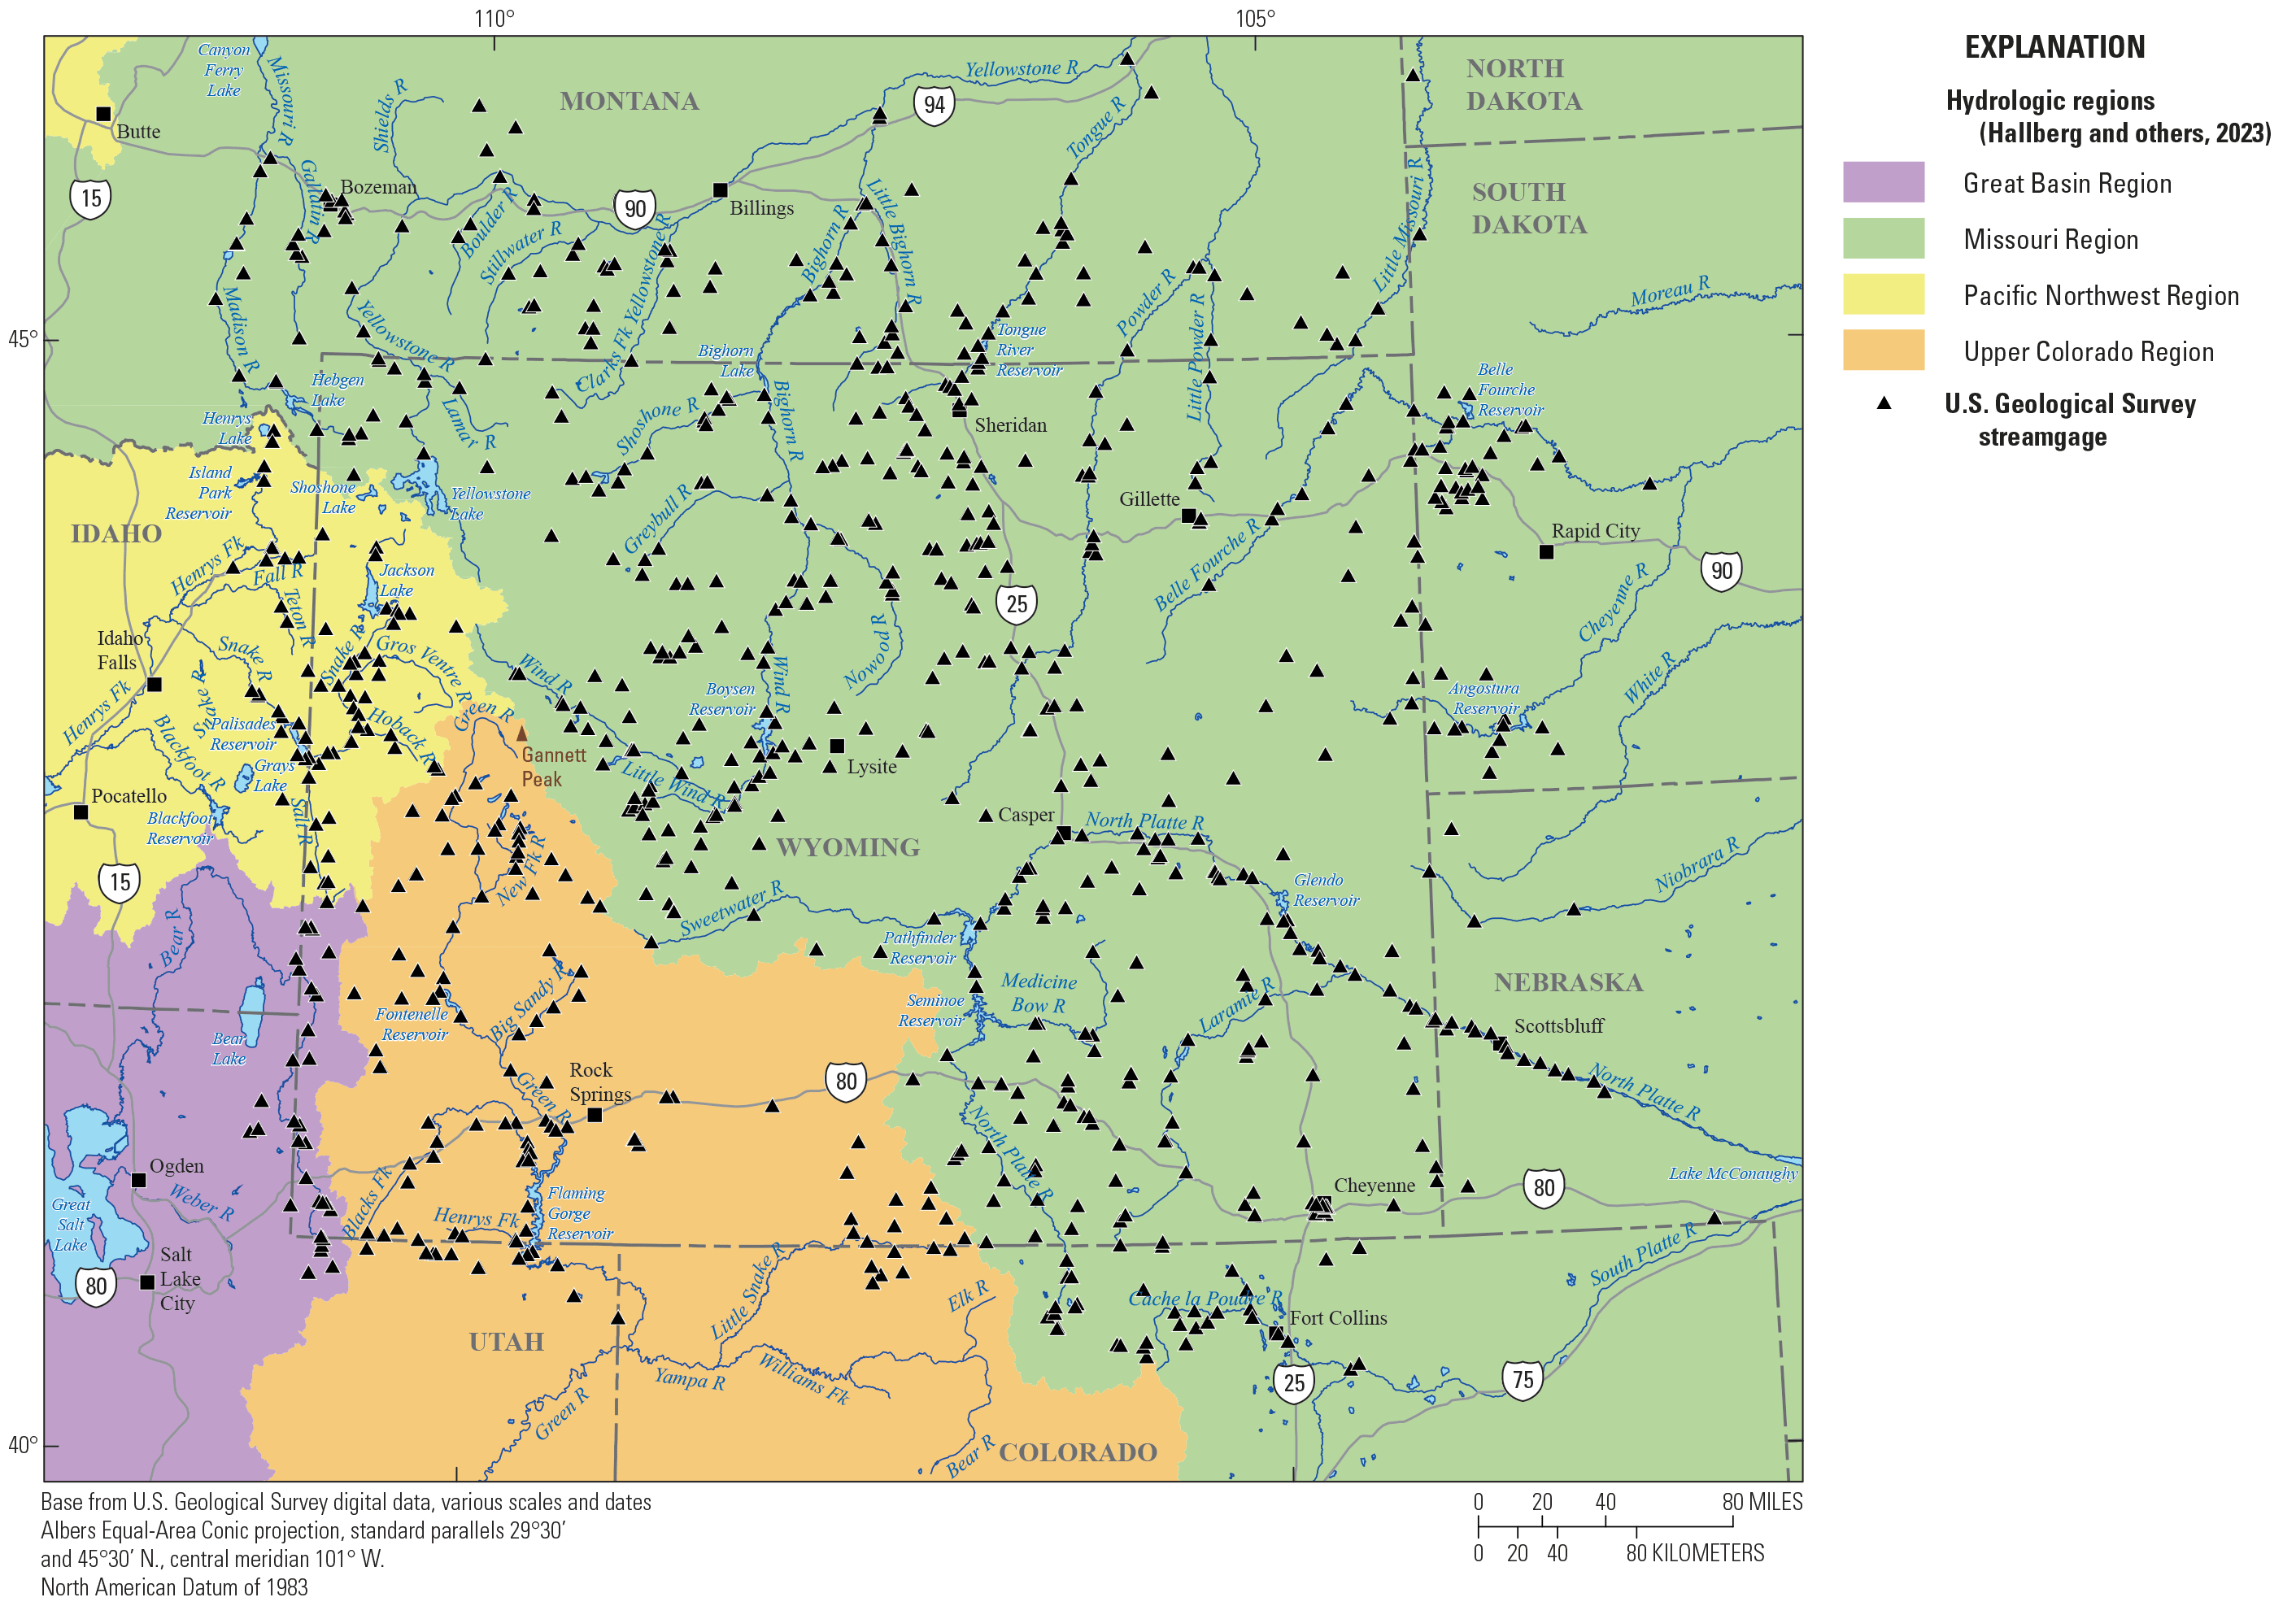
Locations of selected streamgages in or near Wyoming for which streamflow statistics were computed through water year 2021.
Study Area
The study area includes Wyoming, an area of about 98,000 square miles with some watersheds extending into Colorado, Idaho, Utah, Montana, Nebraska, North Dakota, and South Dakota (fig. 1). The study area contains parts of four large hydrologic regions, including the Great Basin, Missouri, Pacific Northwest, and Upper Colorado Regions (fig. 1; Hallberg and others, 2023). The study grouped the streamgages within these regions by four-digit hydrologic unit codes (HUCs; Seaber and others, 1987). The Great Basin Region contains HUCs 1601 and 1602 (not shown). The Missouri Region contains HUCs 1002, 1007, 1008, 1009, 1010, 1011, 1012, 1015, 1018, and 1019 (not shown). The Pacific Northwest Region contains HUC 1704 (not shown). The Upper Colorado Region contains HUCs 1404 and 1405 (not shown).
Wyoming has diverse ecosystems and landscapes that range in elevation from 3,125 to 13,785 feet at the State’s highest point, Gannett Peak (fig. 1; University of Wyoming, 2019). Average annual precipitation in Wyoming for 1991–2020 ranged from less than 10 inches per year in parts of the Green River, Great Divide, Wind River, and Big Horn Basins to greater than 70 inches per year in mountainous areas in the northwestern part of the State (not shown; PRISM Climate Group, 2022). The large range of elevations and precipitation amounts results in diverse hydrologic characteristics and mechanisms for high and low streamflows. Primary land uses in Wyoming include grassland pasture and range (72 percent), forest cover (12 percent), urban and special use areas (12 percent), and cropland (4 percent) (University of Wyoming, 2019). Because of the small percentage of urbanized area, streams in Wyoming are generally less affected by urbanization than many other States. Physiographic regions and river drainage orientation are mainly driven by the location of mountain ranges and the Continental Divide, which divert rivers in different directions. Much of the land cover consists of high-elevation sagebrush and grassland that receives less precipitation than the mountain ranges, leading to varying mechanisms for peak and minimum streamflows. Winter months consist of high-elevation snow accumulation and intermittent snow cover at lower elevations. Spring and early summer rainstorms and snowmelt create peak streamflow conditions on many streams and rivers during this period. Mid-summer through fall is often hotter and drier than the spring and early summer, and isolated, large thunderstorms during this period can cause high-flow events on smaller stream systems (University of Wyoming, 2019).
Scope of Streamflow Statistics
Basic and seasonal statistics include the mean streamflow, in cubic feet per second; associated years of record; and standard deviation for monthly, annual, and seasonal durations. Maximum daily mean streamflow and Kendall’s tau (Helsel and others, 2020) are included for annual streamflow statistics. Nonparametric tests such as Kendall’s tau describe upward and downward trends in streamflow that can be caused by changes in water use, land practices, or multi-year climatic trends.
Flow-duration statistics include annual and monthly streamflow statistics and are expressed as an exceedance probability (in percent), indicating how frequently streamflow at the streamgage would be expected to meet or exceed the measured streamflow for the year or month. For example, an exceedance probability of 0.01 indicates that a daily mean streamflow at a location, measured in cubic feet per second, has a 1-percent chance of being equaled or exceeded in a year. Annual flow-duration statistics are represented as exceedance probabilities of 0.1, 0.2, 0.5, 1, 2, 4, 5, 10, 20, 25, 30, 40, 50, 60, 70, 75, 80, 90, 95, 98, 99, 99.5, 99.8, and 99.9 percent. Annual flow-duration statistics also include the number of years of record and the probability of zero flow as an exceedance probability. Monthly flow-duration statistics are represented as monthly exceedance probabilities of 1, 5, 10, 15, 20, 25, 30, 40, 50, 60, 70, 80, 90, 95, and 99 percent, respectively. Monthly flow-duration statistics include the number of years of record and percentage of zero flows during each month for the streamgage record.
N-day statistics include the mean-minimum or mean-maximum streamflow during a consecutive period of days, (n), during an annual period for a given recurrence interval. The upper 95 percent and lower 5 percent confidence intervals for the streamflow and associated standard deviation describe the variability and uncertainty of the n-day statistic. For example, the 7-day, 2-year low-flow statistic (M7D2Y) describes a non-exceedance probability where the mean streamflow over a 7-day period will not be greater than the M7D2Y streamflow value every 2 years on average. The 1-day, 5-year high-flow statistic (V1D5Y) describes an exceedance probability where the mean 1-day streamflow will be greater than the V1D5Y streamflow value every 5 years on average. High-flow n-day statistics use the water year and are presented as exceedance probabilities, and low-flow n-day statistics use the climatic year instead of the water year as the annual period of record and are presented as non-exceedance probabilities. Although there is no standard start and end date to a climatic year (Langbein and Iseri, 1983), other studies have commonly used April 1 to March 31 of the following year as the season boundaries for low-flow statistics (Risley and others, 2008; Feaster and Guimaraes, 2014).
Regression statistics are primarily used to inform regional regression equations that are developed in a separate component of the StreamStats development for Wyoming. The statistics computed for individual streamgages include Kendall’s tau, probability (p-value) and Sen slope for Kendall’s tau, years of record, log-Pearson Type III skew and standard deviation, upper and lower confidence intervals for given years (2-, 5-, and 10-year periods), and k-values (the coverage factor, k, determines the confidence in the data points within a standard deviation value) for the log-Pearson Type III skew for given years (2-, 5-, and 10-year periods). These statistics are computed for each applicable n-day period, or constituent, for each streamgage. The constituents for each high and low flow were L007, L014, L030, H001, and H060, where L represents minimum low flow for the time in days and H represents maximum high flow for the time in days.
Methods to Compute Streamflow Statistics
Established methods are used to determine the instantaneous streamflow in cubic feet per second at streamgages at regular intervals, normally every 15 minutes to an hour at the site (Rantz and others, 1982). Daily mean streamflows are the averages of instantaneous streamflow readings from a 24-hour period at a streamgage and are used to compute streamflow statistics. Daily mean streamflow data used in this study to compute streamflow statistics were obtained from the USGS National Water Information System (NWIS; USGS, 2022a) database. The open-source environment for statistical analysis and graphics R (R Core Team, 2022) was used for data screening and analyses. The “dataRetrieval” package for R (De Cicco and others, 2022) was used to retrieve the data from the NWIS database. Streamgages are operated annually or seasonally, depending on the site conditions and project goals. Annual sites collect data year-round with no missing periods, and seasonal sites collect data continuously during a specified operating period. Seasonal streamgages often operate spring through fall.
Streamflow statistics were divided into four groups: basic and seasonal, flow-duration, n-day, and regression statistics. The statistics were computed for individual streamgages with a minimum of 10 years of applicable record, including those that only operated for part of the year. For example, some streamgages are not operated during winter months (January, February, March), and those streamgages would not have enough complete years of record to determine the winter monthly or winter seasonal statistics but may have the necessary record to determine spring, summer, and fall seasonal and monthly statistics. Streamgages were grouped into 15 regions determined by the four-digit HUC (1002, 1007, 1008, 1009, 1010, 1011, 1012, 1015, 1018, 1019, 1404, 1405, 1601, 1602, and 1704).
Daily mean streamflows were used to compute the statistics, and judgements were made to establish if daily streamflows were mostly natural (unaltered) or were altered by dams, diversions, or both. Disturbance indices were used to help inform these judgements. Disturbance index thresholds were used to determine where streamflow no longer represented a natural condition. These thresholds were determined using a body of evidence including discussions with USGS field staff, quantifying drainage areas upstream from dams, and the maximum capacity of diversions at select sites. Streamgages unaltered by dams or diversions had repeated daily streamflow values considered erroneous removed through a data screening process. Basic, seasonal, and flow-duration statistics were computed using R (version 4.1.3; R Core Team, 2022) using flow-duration functions contained in the EGRET package (Hirsch and De Cicco, 2015). The Kendall’s tau was computed using the VGAM package (Yee, 2022). N-day and regression statistics were computed using SWToolbox version 1.0.5 (Kiang and others, 2018).
Streamflow Alteration at Streamgages
Streamflow can be affected by dams, diversions, irrigation returns, and other human-made structures on the landscape. Quantifying the magnitude of effects or alterations by these structures is crucial for interpreting streamflow statistics at each streamgage, as well as for the development of regression equations to predict streamflow statistics at ungaged locations. Streamflow alteration status (altered or unaltered) for 231 streamgages outside of Wyoming was determined before this study, and that information was obtained through the StreamStats application for each State (USGS, 2019; Colorado, Idaho, Montana, South Dakota, North Dakota, Utah, and Nebraska).
In Wyoming, a previously defined alteration status was not available for streamgages, and a method was developed to determine the degree of alteration for 400 streamgage periods of record from 384 streamgages. If the streamgage period of record spanned construction, modification, or removal of flow-modifying structures (including dams and diversions), the streamflow record was split into “altered” and “unaltered” time periods. Before streamflow statistics were computed, each streamgage was classified as “unaltered,” “altered–major alteration,” or “altered–minor alteration” based on a quantification of dams and diversions in the basin upstream from the location of the streamgage.
Alteration Owing to Dams
Streamflow alteration owing to dams in Wyoming was assessed using methods developed by Wieczorek and others (2021). Dam point events from the National Hydrography Dataset (NHD) Point Events layer (USGS, 2022b) were snapped to the Wyoming flow accumulation grid (Hallberg and others, 2023). First, a raster was created for each year from 1873 to 2007, where each cell in the stream network had a value of drainage area times dam storage for dams constructed in or before that year. Average annual precipitation for the upstream drainage area was also computed for each cell using the data from Hallberg and others (2023). Finally, points representing each streamgage were snapped to the raster, and a disturbance index (DI) for alteration owing to dams at each streamgage (DIdams,g) was computed for each year using the method of Wieczorek and others (2021):
whereDIdams,g
is the disturbance index for alteration owing to dams at streamgage;
n
is the total number of dams above river segment;
Storaged
is the storage at the dam, in acre-feet;
DAd
is the drainage area above the dam, in acres;
P
is the average annual precipitation, in feet; and
DAT
is the total drainage area above the streamgage, in acres.
The streamflow record at each streamgage was classified as “altered–major alteration (dams)” for value of DIdams,g equal to or exceeding 0.02, as “altered–minor alteration (dams)” for DIdams,g greater than 0.01 and less than 0.02, and “unaltered (dams)” for DIdams,g values less than or equal to 0.01.
Alteration Owing to Diversions
Streamflow alteration owing to diversions was assessed using a similar method to alteration owing to dams. The amount of water a diversion is allowed to take (Qdiv) was quantified as the amount reported from diversions data provided by the Wyoming State Engineer’s Office (Confluence Consulting, Inc., 2020; Wyoming State Engineer’s Office, 2021). These data were accumulated along NHD flowlines (Hallberg and others, 2023) and divided by mean annual streamflow embedded in the NHDPlus version 2 (QmeanNHD) (U.S. Geological Survey and U.S. Environmental Protection Agency, 2012; USGS, 2022b). A disturbance index for alteration owing to diversions (DIdiversions,g) was computed as follows:
whereDIdiversions,g
is the disturbance index for alteration owing to diversions;
Qdiv
is the diversion flow amount, in cubic feet per second; and
QmeanNHD
is the mean annual flow from NHDPlus version 2 (U.S. Geological Survey and U.S. Environmental Protection Agency, 2012), in cubic feet per second.
Threshold values for DIdiversions,g were identified where streamgages were classified as “altered (diversions)” for DIdiversions,g greater than or equal to 10 and “unaltered (diversions)” for DIdiversions,g values less than 10.
Alteration Status Owing to Dams and Diversions
A multi-tiered method, which considers both dams and diversions, was used to generate a final classification of streamflow alteration at each streamgage (table 1). Large river diversions in Wyoming are often planned around water storage in large reservoirs because these reservoirs schedule releases to meet irrigation demands during dry months (Roberts, 2019). Where available, dam construction completion dates were used as the beginning of streamflow alteration. The date of alteration was designated October 1 of the water year one year before the dam began altering the natural streamflow. For example, if a dam was installed and began controlling streamflow in 1975, the date of alteration would be October 1, 1974, to encompass all of the water year 1975, because historical data often were provided only for the year the dam was completed. However, records describing when diversions began are rare and some diversions may not divert streamflow in some years or parts of years, so specific dates of regulation were not assigned to these sites. Alteration owing to diversions was assigned date of regulation of October 1, 1868, which is the first year that water records were available for Wyoming streamgages.
Streamflow alteration at 13 Wyoming streamgages was assessed using a modified approach. Further examination of streamgage drainage areas by using remote-sensing methods, reviews of site visits and historical descriptions, and corrected dam and diversion locations resulted in changes to alteration status for Wyoming site numbers 06244500.10, 06257500.10, 06258000.10, 06284500.00, 06300900.10, 06301495.10, 06301500.10, 06426160.00, 06641000.10, 06664500.00, 09216500.00, 09219000.10, and 10016000.00 (Armstrong and others, 2025).
Table 1.
Method for determining final classification of streamgages and date used for alteration status.[POR, period of record; NA, not applicable]
Data Screening
Ideally, a complete record (no missing days during the period of record) is used to compute streamflow statistics. However, examination of the daily mean streamflows from many streamgages indicated periods of repeated streamflow measurements. Most of the repeating daily streamflows were hypothesized to be caused by frozen equipment during the winter months or periods of record that were simply estimated. Many repeated periods occurred prior to 1970, so historical records were not often available to identify a reason for the repeated values. McCarthy (2016) determined similar repeated values for some streamgages in Montana and removed them when developing Montana StreamStats. For this project, data screening removed portions of the daily flow record having 10 or more days of the daily mean streamflow repeated. Repeated daily streamflows of less than 0.1 cubic foot per second (ft3/s) were not removed owing to rounding error and the possibility of a zero-flow condition that was recorded accurately. There were 423 streamgages with unaltered periods of record with daily streamflows removed from the analysis. Those streamgages are noted in Armstrong and others (2025).
Repeated daily mean streamflows were screened using an algorithm developed in R (R Core Team, 2022). This algorithm (hereafter referred to as the “duplicate date removal code”) reads a comma-separated value spreadsheet with the disturbance indices for diversions (DIdiversions,g) and dams (DIdams,g) and stores them as input files. The duplicate date removal code uses the USGS streamgage identification numbers to download the daily mean streamflows for the period of continuous data collection from NWIS (USGS, 2022a). The package PFFREX (Siefken and McCarthy, 2021) was used to download streamgage-specific information including latitude, longitude, drainage area, and years of record; and qualify the streamgages as continuous and (or) crest-stage gages. Crest-stage gages were not included in the analyses because they do not have daily streamflow values.
As described in the “Streamflow Alteration at Streamgages” section, streamgages were classified as “altered–major alteration,” “altered–minor alteration,” or “unaltered” owing to diversions and reservoirs. The duplicate date removal code adds qualifiers to the ends of USGS streamgage identification numbers to indicate alteration classification. Streamgages classified as “Unaltered” were denoted with XXXXXXXX.00, and streamgages classified as “altered–major alteration” and “altered–minor alteration” were denoted by XXXXXXXX.10, where the Xs represent 8- or 11-digit USGS streamgage identification numbers (the resultant streamgage identifiers are referred to as “site numbers” herein and in the accompanying data release [Armstrong and others, 2025]). Data from unaltered streamgages were run through the duplicate date removal code to remove repeated daily streamflows. Streamgages where altered periods began after the streamgage started recording were considered partially altered and were split into two records representing the altered and unaltered periods of record, which were denoted by “.10” and “.00” after the USGS streamgage identification number, respectively. The duplicate date removal code removed the repeated daily streamflows from the start of the unaltered period of record to the date of alteration. The duplicate date removal code did not remove daily values for the altered period of record, which was from the date of alteration to the end of the record. Streamgages below dams with a disturbance index (DIdams,g) greater than or equal to 0.01 were considered to have altered status and accurate measurements owing to the upstream streamflow regulation, so these streamgages did not have any repeated daily streamflow values removed. All daily mean streamflow data are provided in comma-separated value spreadsheets in Armstrong and others (2025); the spreadsheets are organized into folders by four-digit HUC and use the site number for the file name.
Streams with substantial canal and ditch diversions were also considered to be altered. Streamgages that had a disturbance index (DIdiversionss,g) greater than 10 were determined to be altered. Unlike streamgages altered by dams, the streamgages altered by diversions were run through the duplicate date removal code because diversions do not control streamflow downstream like a dam. Daily streamflows also often repeat during the winter when diversions are not often in operation.
Basic and Seasonal Statistics
Basic and seasonal statistics include the years of record; mean and maximum streamflows; and the associated standard deviations for annual, monthly, and seasonal periods. For annual streamflow statistics, each daily mean value from a given year was averaged to produce a single daily mean value for each year in the dataset, creating a time series of annual mean flows for each streamgage. This time series was used to compute the mean, maximum, and standard deviations of the annual statistics. Kendall’s tau is included for annual streamflow statistics to test for trends in the data during the years of record. No changes were made to site analyses based on trends determined in the Kendall’s tau analysis.
Rather than creating a time series of mean values for monthly and seasonal statistics, every daily mean streamflow value was used for the entirety of the period of record. Monthly and seasonal statistics determined the mean, standard deviation, maximum, and minimum streamflow from each daily mean value in the period of record. Monthly streamflow statistics were averaged across all applicable months of record for each streamgage.
Basic and seasonal statistics had a maximum number of days of missing record allowed during a month or year to be considered an applicable record. For annual statistics, the record could have five or fewer daily mean streamflows missing from a water year to be considered applicable, and all 12 months had to be complete to compute the annual statistics. For monthly statistics, only months missing 2 or fewer days were used in the computations. For example, if water year 1970 had only 3 days missing from the water year record and all days were from different months, that water year would be included in the annual statistics. If the 3 days were all missing from the same month, that month would be excluded from the computations, and water year 1970 would not be included in annual statistics computations because there would only be 11 complete months in the record.
The seasonal streamflows were divided into four seasons based on flow regimes and temperatures during the year: fall (October–December), winter (January–March), spring (April–June), and summer (July–September). Seasonal statistics required all 3 months in the season to be complete for that season to be included. A maximum number of missing days was not applied for seasonal statistics but excluding months with three or more missing daily streamflows resulted in an insufficient record to compute seasonal statistics for some years.
Flow-Duration Statistics
Flow-duration statistics were computed using years with the same maximum number of missing days per month or year (2 and 6 days, respectively) as the basic and seasonal statistics. Flow durations for annual and monthly time periods are presented as streamflow-exceedance probabilities. Streamflow-exceedance probabilities describe the likelihood that a streamflow will be equaled or exceeded for a percentage of the specified time interval; that is, a 20 percent exceedance probability indicates the streamflow would be exceeded on average 20 percent of the time for the month or year.
Streamflow-exceedance probabilities were computed by modifying the flow-duration function in the EGRET package (Hirsch and De Cicco, 2015). The annual record was sorted, and the number of rows was multiplied by each exceedance probability on the curve. This computation created a list of row numbers corresponding to the relevant exceedance probabilities. The probability of zero flow was determined by dividing the total number of daily mean zero flows in the streamgage record by the total days in the period of record, providing a percent of total streamflows that were zero in the record.
Annual n-day Low-Flow Statistics
N-day low-flow statistics were computed for streamgages with a minimum of 10 years of complete daily streamflow record. For a year to be included, daily mean streamflows could not be missing from the water year; otherwise, the water year was excluded from the log-Pearson Type III fit and was not used in the computation of the statistic (Kiang and others, 2018). The log-Pearson Type III fit is a statistical technique for fitting frequency distribution data, including daily mean streamflows. N-day low-flow statistics were computed from the annual record by developing a time series of the lowest 7-day mean flow from each year. A probability distribution was developed by fitting a log-Pearson Type III distribution to the time series using the SWToolbox application (Kiang and others, 2018). The n-day low-flow data (Armstrong and others, 2025) are presented as non-exceedance probabilities, which is the reciprocal of exceedance probability (also known as a “recurrence interval”). Statistics describing the log-Pearson Type III fit were output from SWToolbox. Streamgages with a zero flow in the time series had the distribution fitted exclusively to its non-zero values because log-transformations are not appropriate to use with zero-flow values. Instead, a conditional-probability adjustment was applied to account for zero flows (Kiang and others, 2018). In cases where the conditional-probability adjustment was applied, SWToolbox was unable to compute confidence intervals or variance. More information on the methodology of computations from SWToolbox is available in Kiang and others (2018).
Annual n-day High-Flow Statistics
N-day high-flow statistics were computed for any site with a minimum of 10 years of complete record by fitting them to a log-Pearson Type III distribution using SWToolbox (Kiang and others, 2018). For a year to be included, daily mean streamflows could not be missing from the water year. N-day high-flow statistics were computed from annual series of the highest mean streamflows for specific consecutive n-day periods within a water year and are presented as an exceedance probability (also referred to as a “recurrence interval”). More information on the methodology of computations from SWToolbox is available in Kiang and others (2018).
Regression Statistics
Regression statistics include metrics relevant to the development of regional regression equations for prediction of streamflow statistics at locations in stream networks without streamgages (ungaged). Regression statistics include the Kendall’s tau for the n-day time series, the p-value and Sen’s slope for the Kendall’s tau, the log-Pearson Type III k-value, and the upper 95 percent and lower 5 percent confidence levels of the log-Pearson Type III fit for a given n-day statistic. These statistics were computed for each site using SWToolbox (Kiang and others, 2018). R scripts were developed to arrange the results into the published formats. The start year, end year, and years excluded owing to not meeting missing dates criteria were determined in R (R Core Team, 2022) using the daily mean streamflows processed by the duplicate date removal code and were then input into SWToolbox. Because the regression statistics were associated with each n-day statistic, standards for applicable data are the same as described above for high- and low-flow n-day statistics.
Streamflow Statistics Analyses and Results
Streamflow data are available for 997 streamgages in and near Wyoming (USGS, 2022a), and streamflow statistics were computed for 615 streamgages with 10 or more years of daily mean streamflow record. A total of 15,005 years of record with a mean of approximately 23.8 years of record were used to develop streamflow statistics. Streamflow statistics were computed for active (through September 30, 2021) and discontinued streamgages, and streamflow at each streamgage was assessed for degree of human alteration owing to dams and diversions. Streamflow was classified as unaltered for 507 streamgage periods of record and altered for 124 streamgage periods of record. The classification of each streamgage is included in Armstrong and others (2025). The disturbance index method was used to determine the alteration status for streamgages within the State of Wyoming (400 streamgage periods of record). The StreamStats application was used to determine the alteration status for streamgages within the study area but outside the State of Wyoming (231 streamgage periods of record). Remote-sensing methods, reviews of site visits and historical descriptions, and corrected dam and diversion locations resulted in changes to alteration status for nine streamgages within the State of Wyoming.
Streamflow statistics were divided into four groups: basic and seasonal, flow-duration, n-day, and regression statistics. The basic, seasonal, and flow-duration statistics were computed for 615 streamgages using scripts developed in R (R Core Team, 2022). N-day and regression statistics were computed for 387 streamgages using the SWToolbox application (Kiang and others, 2018). The number of applicable years of record for each streamgage and statistics are provided in Armstrong and others (2025).
N-day frequency curves crossed at seven streamgages, which were either manually adjusted or not adjusted. Statistically, it is not possible for n-day frequency curves to cross other frequency curves, because short-duration (fewer days) streamflows should be higher than the long-duration streamflows. For example, a 7-day, 5-year low streamflow (M7D5Y) should always have a higher discharge than a 14-day, 5-year low streamflow (M14D5Y). Most often, these crossing curves were the result of repeated zero flows during the period of record, which may cause incorrect n-day estimates from the SWToolbox application (Kiang and others, 2018). These n-day curves were adjusted to zero where applicable, and when differences of less than 0.1 ft3/s separated the crossed curves, the curves were manually corrected using a measurement error of 0.1 ft3/s.
Summary
The U.S. Geological Survey (USGS), in cooperation with the Wyoming Water Development Office, developed streamflow statistics for streamgages in and near Wyoming. A total of 15,005 years of record (periods of record from water year 1868 to 2021) with a mean of approximately 23.8 years of record were used to compute streamflow statistics for active (through September 30, 2021) and discontinued streamgages with 10 or more years of daily mean streamflow record.
Streamflow at each streamgage was assessed for degree of human alteration owing to dams and diversions before streamflow statistics were computed. Streamflow alteration status (altered or unaltered) for streamgages outside of Wyoming (Colorado, Idaho, Montana, South Dakota, North Dakota, Utah, and Nebraska; 231 streamgage periods of record) was determined before this study, and that information was obtained through StreamStats for each State. Streamflow alteration status for streamgages in Wyoming (400 streamgage periods of record) was not available through StreamStats, and a method was developed to determine the degree of alteration at each streamgage. Streamflow was classified as unaltered for 507 streamgage periods of record and altered for 124 streamgage periods of record.
Streamflow records from 615 streamgages were used to compute basic, seasonal, and flow-duration statistics; records from 387 streamgages were used to compute n-day statistics, which are statistics describing streamflow over a number of days (n), and statistics that can be used for regional regression. Basic, seasonal, and flow-duration statistics for streamgages were computed using the programming language R with flow-duration functions contained in the EGRET package. N-day statistics and regression statistics for streamgages were computed using SWToolbox. The streamflow statistics and ancillary information for each streamgage are provided in a USGS data release that accompanies this report and through the USGS StreamStats application. The StreamStats application can be used to delineate drainage areas, determine basin characteristics, and compute statistics at locations with and without streamgages. The statistics and methods presented in this report are part of a larger project to develop the StreamStats application for Wyoming (https://www.usgs.gov/centers/wyoming-montana-water-science-center/science/wyoming-streamstats).
Acknowledgments
Amy McHugh of the U.S. Geological Survey (USGS) provided and helped interpret the scripts that were used to compute the at-site statistics in the report. Seth Siefken of the USGS provided and helped interpret the scripts that retrieved and organized data from the USGS National Water Information System database.
The authors also would like to thank the Wyoming Water Development Office (WWDO) staff who supported this work, especially Barry Lawrence, Mabel Jones, and Chace Tavelli, as well as Jodi Pring (retired WWDO).
References Cited
Armstrong, D.W., Lange, D.A., and Chase, K.J., 2025, Streamflow statistics for selected streamgages in and near Wyoming through water year 2021: U.S. Geological Survey data release, accessed January 2025 at https://doi.org/10.5066/P9E3LEG6.
De Cicco, L.A., Lorenz, D., Hirsch, R.M., Watkins, W.D., and Johnson, M., 2022, dataRetrieval—R packages for discovering and retrieving water data available from U.S. Federal hydrologic web services (ver. 2.7.12): U.S. Geological Survey software package, accessed February 2022 at https://doi.org/10.5066/P9X4L3GE. [Also available at https://code.usgs.gov/water/dataRetrieval.]
Feaster, T.D., and Guimaraes, W.B., 2014, Low-flow frequency and flow duration of selected South Carolina streams in the Catawba-Wateree and Santee River Basins through March 2012: U.S. Geological Survey Open-File Report 2014–1113, 34 p., accessed January 2022 at https://doi.org/10.3133/ofr20141113.
Hallberg, L.L., Dutton, D.M., and Brugger, C.L., 2023, Fundamental datasets for Wyoming StreamStats: U.S. Geological Survey data release, accessed August 2023 at https://doi.org/10.5066/P9MCZ44X.
Helsel, D.R., Hirsch, R.M., Ryberg, K.R., Archfield, S.A., and Gilroy, E.J., 2020, Statistical methods in water resources: U.S. Geological Survey Techniques and Methods, book 4, chap. A3, 458 p., accessed October 31, 2023, at https://doi.org/10.3133/tm4a3. [Supersedes USGS Techniques of Water-Resources Investigations, book 4, chap. A3, version 1.1.]
Hirsch, R.M., and De Cicco, L.A., 2015, User guide to Exploration and Graphics for RivEr Trends (EGRET) and dataRetrieval—R packages for hydrologic data (version 2.0, February 2015): U.S. Geological Survey Techniques and Methods, book 4, chap. A10, 93 p., accessed March 2022 at https://doi.org/10.3133/tm4A10.
Kiang, J.E., Flynn, K.M., Zhai, T., Hummel, P., and Granato, G.E., 2018, SWToolbox—A surface-water tool-box for statistical analysis of streamflow time series: U.S. Geological Survey Techniques and Methods, book 4, chap. A11, 33 p., accessed January 2022 at https://doi.org/10.3133/tm4A11.
Langbein, W.B., and Iseri, K.T., 1983, General introduction and hydrologic definitions, manual of hydrology—Part 1, General surface-water techniques (3d ed.): U.S. Geological Survey Water-Supply Paper 1541–A, 29 p., accessed October 31, 2023, at https://doi.org/10.3133/wsp1541A.
Lowham, H.W., 1976, Techniques for estimating flow characteristics of Wyoming streams: U.S. Geological Survey Water-Resources Investigations Report 76–112, 83 p., accessed October 31, 2023, at https://doi.org/10.3133/wri76112.
Lowham, H.W., 1988, Streamflows in Wyoming: U.S. Geological Survey Water-Resources Investigations Report 88–4045, 78 p., accessed September 2021 at https://doi.org/10.3133/wri884045.
McCarthy, P.M., 2016, Streamflow characteristics based on data through water year 2009 for selected streamflow-gaging stations in or near Montana: U.S. Geological Survey Scientific Investigations Report 2015–5019–E, 10 p., accessed August 2021 at https://doi.org/10.3133/sir20155019E.
PRISM Climate Group, 2022, Mean annual precipitation (1991–2020) for Wyoming: Oregon State University web page, accessed January 18, 2024, at https://prism.oregonstate.edu/projects/gallery_view.php?state=WY.
Rantz, S.E., and others, 1982, Measurement and computation of streamflow—Volume 1, measurement of stage and discharge: U.S. Geological Survey Water-Supply Paper 2175, v. 1, 284 p., accessed January 2023 at https://doi.org/10.3133/wsp2175.
Ries, K.G., III, Newson, J.K., Smith, M.J., Guthrie, J.D., Steeves, P.A., Haluska, T.L., Kolb, K.R., Thompson, R.F., Santoro, R.D., and Vraga, H.W., 2017, StreamStats, version 4: U.S. Geological Survey Fact Sheet 2017–3046, 4 p., accessed October 31, 2023, at https://doi.org/10.3133/fs20173046. [Supersedes USGS Fact Sheet 2008–3067.]
Ries, K.G., III, Steeves, P.A., and McCarthy, P., 2024, StreamStats—A quarter century of delivering web-based geospatial and hydrologic information to the public, and lessons learned: U.S. Geological Survey Circular 1514, 40 p., accessed May 29, 2024, at https://doi.org/10.3133/cir1514.
Risley, J., Stonewall, A., and Haluska, T., 2008, Estimating flow-duration and low-flow frequency statistics for unregulated streams in Oregon: U.S. Geological Survey Scientific Investigations Report 2008–5126, 22 p., accessed September 2022 at https://doi.org/10.3133/sir20085126.
Roberts, P., 2019, Watering a dry land—Wyoming and Federal irrigation: Wyoming Historical Society web page, accessed December 2022 at https://www.wyohistory.org/encyclopedia/watering-dry-land-wyoming-and-federal-irrigation.
R Core Team, 2022, R—A language and environment for statistical computing (ver. 4.1.3): R Foundation for Statistical Computing, accessed March 2022 at https://www.r-project.org.
Siefken, S.A., and McCarthy, P.M., 2021, Peak-flow frequency R Extensions (PFFREX): U.S. Geological Survey software package, accessed February 2022 at https://doi.org/10.5066/P99ETAVR. [Also available at https://code.usgs.gov/StreamStats/flood-frequency/pffrex.]
Seaber, P.R., Kapinos, F.P., and Knapp, G.L., 1987, Hydrologic Unit Maps: U.S. Geological Survey Water-Supply Paper 2294, 63 p., accessed January 2023 at https://pubs.usgs.gov/wsp/wsp2294/.
University of Wyoming, 2019, The climate of Wyoming: Wyoming Water Resources Data System and State Climate Office web page, accessed January 2023 at http://www.wrds.uwyo.edu/sco/wyoclimate.html#:~:text=The%20lowest%20point%2C%203%2C125%20feet,in%20the%20west%2Dcentral%20portion.
U.S. Geological Survey [USGS], 2022a, USGS water data for the Nation: U.S. Geological Survey National Water Information System database, accessed September 2022 at https://doi.org/10.5066/F7P55KJN.
U.S. Geological Survey [USGS], 2022b, National Hydrography Dataset: U.S. Geological Survey website, accessed April 2022 at https://www.usgs.gov/national-hydrography/national-hydrography-dataset.
U.S. Geological Survey [USGS], 2019, The StreamStats program: accessed September 2022 at https://streamstats.usgs.gov/ss/.
U.S. Geological Survey and U.S. Environmental Protection Agency, 2012, National Hydrography Dataset Plus—NHDPlus version 2, vector digital dataset: U.S. Geological Survey and U.S. Environmental Protection Agency digital dataset, accessed April 2021 at https://www.epa.gov/waterdata/nhdplus-national-hydrography-dataset-plus.
Wieczorek, M.E., Wolock, D.M., and McCarthy, P.M., 2021, Dam impact/disturbance metrics for the conterminous United States, 1800 to 2015: U.S. Geological Survey data release, accessed September 2022 at https://doi.org/10.5066/P92S9ZX6.
Wyoming State Engineer’s Office, 2021, E-Permit database: Wyoming State Engineer’s Office e-Permit database, accessed December 2021 at http://seoweb.wyo.gov/e-Permit/common/login.aspx?ReturnUrl=%2fe-Permit%2fCommon%2fHome.aspx.
Yee, T.W., 2022, VGAM—Vector Generalized Linear and Additive Models (ver. 1.1-8): R package documentation web page, accessed January 2022 at https://cran.r-project.org/web/packages/VGAM/index.html.
Conversion Factors
U.S. customary units to International System of Units
Supplemental Information
Water year is the 12-month period from October 1 through September 30 and is designated by the year in which it ends.
Climatic year is the 12-month period from April 1 through March 31 and is designated by the year in which it starts.
Daily mean streamflow is the arithmetic mean of all streamflow for a single specified day.
Abbreviations
DI
disturbance index
HUC
hydrologic unit code
k-value
coverage factor, determines the confidence in the data points within a standard deviation value
M7D5Y
7-day, 5-year low-flow statistic
M14D5Y
14-day, 5-year low-flow statistic
M7D2Y
7-day, 2-year low-flow statistic
n-day
streamflow statistic describing a streamflow event over number of days (n)
NHD
National Hydrography Dataset
p-value
statistical probability level
USGS
U.S. Geological Survey
V1D5Y
1-day, 5-year high-flow statistic
For more information about this publication, contact:
Director, USGS Wyoming-Montana Water Science Center
3162 Bozeman Avenue
Helena, MT 59601
406–457–5900
For additional information, visit: https://www.usgs.gov/centers/wy-mt-water/
Publishing support provided by the
Rolla Publishing Service Center
Disclaimers
Any use of trade, firm, or product names is for descriptive purposes only and does not imply endorsement by the U.S. Government.
Although this information product, for the most part, is in the public domain, it also may contain copyrighted materials as noted in the text. Permission to reproduce copyrighted items must be secured from the copyright owner.
Suggested Citation
Armstrong, D.W., Lange, D.A., and Chase, K.J., 2025, Methods to determine streamflow statistics based on data through water year 2021 for selected streamgages in or near Wyoming: U.S. Geological Survey Scientific Investigations Report 2024–5104, 10 p., https://doi.org/10.3133/sir20245104.
ISSN: 2328-0328 (online)
Study Area
| Publication type | Report |
|---|---|
| Publication Subtype | USGS Numbered Series |
| Title | Methods to determine streamflow statistics based on data through water year 2021 for selected streamgages in or near Wyoming |
| Series title | Scientific Investigations Report |
| Series number | 2024-5104 |
| DOI | 10.3133/sir20245104 |
| Publication Date | January 24, 2025 |
| Year Published | 2025 |
| Language | English |
| Publisher | U.S. Geological Survey |
| Publisher location | Reston, VA |
| Contributing office(s) | Wyoming-Montana Water Science Center |
| Description | Report: v, 10 p.; Dataset |
| Country | United States |
| State | Wyoming |
| Online Only (Y/N) | Y |
| Additional Online Files (Y/N) | N |