U.S. Geological Survey Scientific Investigations Report 2005-5065
Back to the Table of Contents
The U.S. Geological Survey (USGS)—in cooperation with local, State, and other Federal agencies — conducted several studies in Georgia and adjacent states during 2002 – 03 to better define the occurrence and quality of ground water and to monitor hydrologic conditions. Summaries of current USGS studies in Georgia are provided in the following sections and include information regarding:
|
|
Back to the Table of Contents
 Assessment of Ground-Water Flow near the Savannah River Site, Georgia and South Carolina
The U.S. Department of Energy (DOE) Savannah River Site (SRS) has manufactured nuclear materials for national defense since the early 1950s. A variety of hazardous materials — including radionuclides, volatile organic compounds, and trace metals — are either disposed of or stored at several locations at the SRS. As a result, contamination of ground water has been detected at several locations within the site and concern has been raised about the possible migration of water-borne contaminants offsite. Two issues have been raised: (1) is ground water flowing from the SRS and beneath the Savannah River into Georgia?; and (2) under what pumping scenarios could such ground-water movement occur? To address these concerns, the U.S. Geological Survey (USGS), in cooperation with the DOE, conducted a comprehensive study during 1991– 97 that simulated ground-water flow and stream- aquifer relations in the vicinity of the SRS. These ground-water simulations are limited by simplification of the conceptual model, which was based on available data through 1992. Large increases in ground-water pumping in Burke and Screven Counties, Georgia, since 1992 and a pronounced drought during 1998 –2002 may have changed hydraulic gra-dients near the river and affected the potential for transriver flow. To provide a more accurate and up-to-date evaluation of trans-river flow near the SRS, the earlier model is being updated to incorporate new data and simulate 2002 conditions. The revised model will be used to simulate a variety of water-management scenarios that could impact transriver flow in the SRS area.
Clarke, J.S., and West, C.T., 1998, Simulation of ground-water flow and stream-aquifer relations in the vicinity of the Savannah River Site, Georgia and South Carolina: U.S. Geological Survey Water-Resources Investigations Report 98-4062, 134 p.
Falls, W.F., Baum, J.S., Harrelson, L.G., Brown, L.H., and Jerden, J.L., 1997, Geology and hydrogeology of Cretaceous and Tertiary strata, and confinement in the vicinity of the U.S. Department of Energy Savannah River Site, South Carolina and Georgia: U.S. Geological Survey Water-Resources Investigations Report 97-4245, 125 p.
Fanning, J.L., 1997, Water use in Georgia by county for 1995: Georgia Geologic Survey Information Circular 101, 95 p.
Fanning, J.L., 2003, Water use in Georgia by county for 2000 and water use trends for 1980 – 2000: Georgia Geologic Survey Information Circular 106, 176 p.
The 5,147-square-mile study area (above) is in the Coastal Plain physiographic province, and is the same area investigated during the earlier 1991– 97 study, including the SRS and adjacent parts of Georgia and South Carolina. Coastal Plain sediments consist of layers of silt, clay, sand, and minor amounts of limestone ranging in age from Cretaceous to Tertiary. Sediments dip to the southeast away from the Fall Line and reach a maximum thickness of about 2,700 feet near the southern boundary of the study area.
![]() Map showing land use in the study area
Map showing land use in the study area
 The major increase in ground-water use between 1995 and 2000 is evident for Burke, Jefferson, and Screven Counties, Ga. In these counties, ground-water use for irrigation increased from 12.6 Mgal/d during 1995 to 43.8 Mgal/d during 2000, and irrigated acreage increased from 53,520 acres during 1995 to 76,380 acres during 2000 (Fanning, 2003). In the Georgia part of the study area, the majority of ground water used for irrigation is withdrawn from the Upper Three Runs aquifer in Jenkins and southern Screven Counties, and from the Upper Three Runs and Gordon aquifers in Jefferson, Burke, and northern Screven Counties.
 Assessment of Surficial and Brunswick Aquifer Systems, Coastal Georgia
![]() Location of test sites in coastal Georgia.
Location of test sites in coastal Georgia.
The Upper Floridan aquifer is the primary source of water in the coastal area of Georgia. Declining water levels and localized occurrences of saltwater contamination in the Upper Floridan aquifer have resulted in the Georgia Environmental Protection Division capping permitted withdrawals at 1997 rates from the Upper Floridan aquifer in parts of the coastal area. These restrictions have prompted interest in developing supplemental sources of ground water, including the surficial and Brunswick aquifer systems. The surficial aquifer system includes the water table and semiconfined zones; the Brunswick aquifer system includes the upper and lower Brunswick aquifers (Clarke, 2003).
Clarke, J.S., 2003, The surficial and Brunswick aquifer systems-alternative ground-water resources for Coastal Georgia, in Proceedings of the 2003 Georgia Water Resources Conference held April 23–23, 2003, at The University of Georgia, Kathryn J. Hatcher, ed, Institute of Ecology, The University of Georgia, Athens, Georgia, CD–ROM.
Weems, R.E., and Edwards, L.E., 2000, Geology of Oligocene, Miocene, and younger deposits in the coastal area of Georgia: Georgia Geologic Survey Bulletin 131, 124 p.
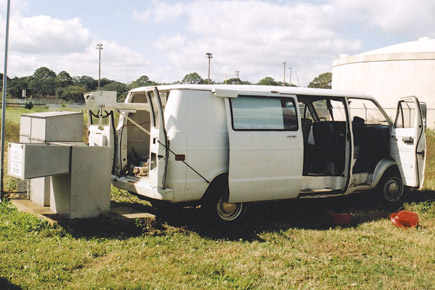
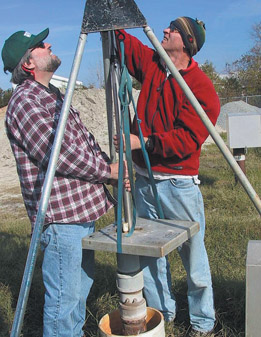
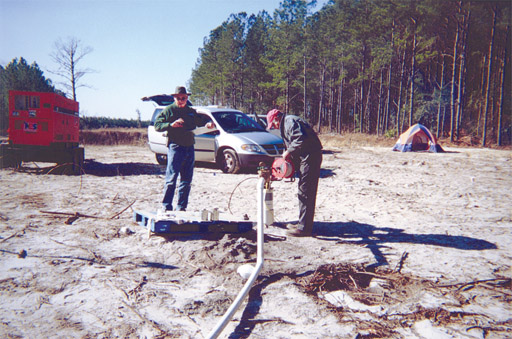 A USGS hydrologist and drilling contractor taking water-level measurements during aquifer test of the lower Brunswick aquifer at Old Sunbury Road, Liberty County, Georgia, January 2002. The test is being conducted to better define the hydraulic properties of the surficial and Brunswick aquifer systems and to determine the usefulness of these aquifers as secondary sources of ground water. Photo by Sherlyn Priest, USGS.
Location and construction data for wells used in the study (gal/min/ft, gallons per minute per feet; —, no data; do., ditto).
| Site name | Other identifier1 | Water-bearing unit2 | Altitude3 (feet) | Casing diameter (inches) | Test dates during 2003 | Draw-down (feet) | Yield (gal/min) | Specific capacity (gal/min /ft) | ||
|---|---|---|---|---|---|---|---|---|---|---|
| Land surface | Top of screen or open interval | Bottom of screen or open interval | ||||||||
| Liberty County | ||||||||||
| 35N076 | Old Sunbury Rd OW-4 | WT | 10 | – 5 | – 8 | 2 | — | — | — | — |
| 35N075 | Old Sunbury Rd OW-3 | CU | 10 | – 42 | – 43 | 4 | — | — | — | — |
| 35N072 | Old Sunbury Rd PW-2 | SS | 10 | – 50 | – 140 | 6 | February 5 – 7 | 29 | 40 | 1.38 |
| 35N074 | Old Sunbury Rd OW-2 | SS | 10 | – 50 | – 55 | 4 | ||||
| 35N071 | Old Sunbury Rd PW-1 | LB | 10 | – 305 | – 355 | 6 | January 14–17 | 50 | 78.5 | 1.57 |
| 35N073 | Old Sunbury Rd OW-1 | LB | 10 | – 307 | – 312 | 4 | ||||
| Camden County | ||||||||||
| 32G046 | Waverly Fire Station | LB | 20 | – 340 | – 425 | 6 | — | — | — | — |
| 32G047 | Waverly Fire Station PW-1 | UB | 20 | – 230 | – 270 | 6 | October 9 – 11 | 98 | 12 | 0.12 |
| 32G048 | Waverly Fire Station PW-2 | SS | 20 | – 80 | – 170 | 6 | December 9–11 | 31 | 47.5 | 1.53 |
| Long County | ||||||||||
| 32M017 | City of Ludowici Prison #1 | UB | 65 | – 165 | – 205 | 10 | July 8 – 10 | 59 | 600 | 10.2 |
| do. | do. | LB | do. | – 275 | – 355 | 10 | do. | do. | do. | do. |
| 32M018 | City of Ludowici Prison #2 | SS | 65 | – 60 | – 140 | 10 | July 29 – 30 | 7.5 | 825 | 110 |
| McIntosh County | ||||||||||
| 34K102 | Darien #1 | S | 30 | 10 | – 10 | 6 | — | — | — | — |
| 34K103 | Darien #2 | SS | 30 | – 130 | – 230 | 6 | — | — | — | — |
| 34K104 | Darien #3 | LB | 30 | – 458 | – 548 | 6 | — | — | — | — |
| Glynn County | ||||||||||
| 35H075 | Lawrence Rd Fire Station #1 | LB | 20 | – 425 | – 505 | 6 | — | — | — | — |
| 35H076 | Lawrence Rd Fire Station #2 | SS | 20 | – 90 | – 150 | 6 | — | — | — | — |
1OW, observation well; PW, pumping well
2CU, confining unit; LB, lower Brunswick aquifer; S, surficial aquifer; SS, semiconfined surficial aquifer; UB, upper Brunswick aquifer; WT, water table
3Negative value denotes below NAVD 88
 City of Albany Cooperative Water-Resources Program
Long-term heavy pumping from the Claiborne, Clayton, and Cretaceous aquifers, which underlie the Upper Floridan aquifer, has resulted in substantial water-level declines in the deep aquifers in the Albany area. These declines have raised concern about the capacity of the deep aquifers to meet the increasing demand for potable water supply. To provide additional water supply and reduce the demand on the deep aquifers, the Albany Water, Gas, and Light Commission has developed a large wellfield southwest of Albany. The supply wells at this location primarily tap the Upper Floridan aquifer, a karstic unit that is the uppermost reliable source of water in the area. Because of local recharge to the aquifer, water quality may be affected by land-use practices. Nitrate levels exceeding the 10-milligrams per liter Maximum Contaminant Level (U.S. Environmental Protection Agency, 2000) have been detected in some wells upgradient of the proposed wellfield. The ground-water flow system and water quality of the Upper Floridan aquifer in the vicinity of the wellfield are complex and poorly understood.
U.S. Environmental Protection Agency, 2000, Maximum contaminant levels (Part 143, National Secondary Drinking Water Regulations): U.S. Code of Federal Regulations, Title 40, Parts 100 –149, revised as of July 1, 2000, p. 612 – 614.
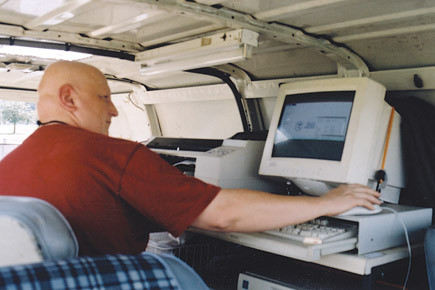
![]() The USGS continuously records water levels at 30 wells and 3 streamgages in the Albany area, shown on the map above. Data from four of these wells and the three streamgages are available in real time at http://ga.waterdata.usgs.gov/nwis
The USGS continuously records water levels at 30 wells and 3 streamgages in the Albany area, shown on the map above. Data from four of these wells and the three streamgages are available in real time at http://ga.waterdata.usgs.gov/nwis
Visit the Albany program Web site at http://ga.waterdata.usgs.gov/projects/albany
 City of Brunswick and Glynn County Cooperative Water-Resources Program
In the Brunswick area, saltwater has contaminated the Upper Floridan aquifer for nearly 50 years. Currently (2003) within an area of several square miles of downtown Brunswick, the aquifer yields water that has a chloride concentration greater than the 250 milligrams per liter (mg/L) State and Federal drinking-water standard (Georgia Environmental Protection Division, 1997; U.S. Environmental Protection Agency, 2000) and in some areas exceeds 2,250 mg/L. Saltwater contamination has constrained further development of the Upper Floridan aquifer in the Brunswick area and prompted interest in the development of alternative sources of water supply, primarily from the shallower surficial and Brunswick aquifer systems, and from the deeper Lower Floridan aquifer.
Georgia Environmental Protection Division, 1997, Secondary maximum contaminant levels for drinking water: Environmental Rule 391-3-5-19, revised October 1997: Official Code of Georgia Annotated Statutes, Statute 12-5-170 (Georgia Safe Drinking Water Act), variously paginated.
U.S. Environmental Protection Agency, 2000, Maximum contaminant levels (Part 143, National Secondary Drinking Water Regulations): U.S. Code of Federal Regulations, Title 40, Parts 100–149, revised as of July 1, 2000, p. 612–614.
 Fluid resistivity log being collected from an observation well completed in the surficial aquifer at Brunswick, Georgia. The log is being collected to determine the integrity of the well casing and to locate zones where saltwater may be entering the well. Photo by Michael F. Peck, USGS.
![]() Examples of geophysical logs collected from an unused production well on Jekyll Island using a multiparameter logging tool. The natural-gamma (NG) and electric (E) logs are used to determine different water-bearing zones and well construction, the fluid resistivity (F) log indicates zones of higher conductivity, and the temperature (T) log measures borehole fluid temperature.
Examples of geophysical logs collected from an unused production well on Jekyll Island using a multiparameter logging tool. The natural-gamma (NG) and electric (E) logs are used to determine different water-bearing zones and well construction, the fluid resistivity (F) log indicates zones of higher conductivity, and the temperature (T) log measures borehole fluid temperature.
![]() An unused production well on Jekyll Island is being converted into an observation well for continuous monitoring of ground-water levels. The 751-foot-deep well is completed in the Upper Floridan aquifer. Geophysical logs were collected to assess the integrity of the well casing and suitability for incorporation into the Georgia statewide ground-water-level monitoring network. A continuous ground-water-level recorder was installed at the well on October 25, 2004, at which time the water level was 21.83 feet above land surface. Photo by Michael F. Peck, USGS.
An unused production well on Jekyll Island is being converted into an observation well for continuous monitoring of ground-water levels. The 751-foot-deep well is completed in the Upper Floridan aquifer. Geophysical logs were collected to assess the integrity of the well casing and suitability for incorporation into the Georgia statewide ground-water-level monitoring network. A continuous ground-water-level recorder was installed at the well on October 25, 2004, at which time the water level was 21.83 feet above land surface. Photo by Michael F. Peck, USGS.
 Georgia Coastal Sound Science Initiative
Pumping from the Upper Floridan aquifer has resulted in substantial water-level decline and saltwater intrusion at the northern end of Hilton Head Island, South Carolina, and at Brunswick, Georgia. This saltwater contamination has constrained further development of the Upper Floridan aquifer in the coastal area and created competing demands for the limited supply of water. The Georgia Environmental Protection Division has capped permitted withdrawal from the Upper Floridan aquifer at 1997 rates in parts of the coastal area, prompting interest in the development of alternative sources of water supply, primarily from the shallower surficial and Brunswick aquifer systems.
Peck, M.F., and McFadden, K.W., 2004, Potentiometric surface of the Upper Floridan aquifer in the coastal area of Georgia, September 2000: U.S. Geological Survey Open-File Report 2004-1030. Available only online at https://pubs.usgs.gov/of/2004/1030/
![]() Coastal area ground-water-level monitoring network.
Coastal area ground-water-level monitoring network.
 Geophysical logging and water-quality sampling of the Lower Floridan aquifer well 39Q024 on Tybee Island in Chatham County, December 2003. Photo by Edward H. Martin, USGS.
![]() Potentiometric surface estimated from field measurements
Potentiometric surface estimated from field measurements
![]() Potentiometric surface estimated from simulated potentiometric surface during 2000.
Potentiometric surface estimated from simulated potentiometric surface during 2000.
 Effects of Impoundment of Lake Seminole on Water Resources in the Lower Apalachicola–Chattahoochee– Flint River Basin and in parts of Alabama, Florida, and Georgia
Multiple uses of freshwater supplies in the lower Apalachi-cola– Chattahoochee – Flint (ACF) River Basin have concerned water managers in the States of Alabama, Florida, and Georgia for many years. Numerous studies have been conducted to understand the complex relations between hydrologic-system components and natural stresses, and to answer questions regarding the effects on those relations caused by human intervention. Although previous studies addressed important water-resource issues in the lower ACF River Basin, by design, none collected hydrologic data needed to develop and maintain a monthly water budget for Lake Seminole and the corresponding stream-lake-aquifer flow system. None of these studies investi-gated the hydrologic and hydrogeologic implications of Lake Seminole impoundment by construction of Jim Woodruff Lock and Dam and the effects of the lake on other flow-system components. Therefore, the U.S. Geological Survey — in cooperation with the Georgia Department of Natural Resources, Environmental Protection Division — developed a monthly water budget for Lake Seminole, estimated the volume of water flowing into Florida before and after construction of the dam, and assessed karst solution features to evaluate the potential for sinkhole collapse beneath the lake, followed by catastrophic lake drainage.
Jones, L.E., and Torak, L.J., 2004, Simulated effects of impoundment of Lake Seminole on ground-water flow in the Upper Floridan aquifer in southwestern Georgia and adjacent parts of Alabama and Florida: U.S. Geological Survey Scientific Investigations Report 2004-5077, 22 p. Available only online at http://water.usgs.gov/pubs/sir/2004/5077/
Mosner, M.S., Aulenbach, B.T., and Torak, L.J., 2004, Ground-water and surface-water flow and estimated water budget for Lake Seminole, southwestern Georgia and northwestern Florida: U.S. Geological Survey Scientific Investigations Report 2004-5073, 54 p. Available only online at http://water.usgs.gov/pubs/sir/2004/5073/
 Hydrogeologic Assessment and Simulation of Stream-Aquifer Relations in the Lower Apalachicola–Chattahoochee–Flint River Basin
Current hydrologic information and ground-water flow modeling in the lower Apalachicola – Chattahoochee – Flint (ACF) River Basin (map below) are insufficient to describe effects of time-variant irrigation pumping on streamflow. Therefore, existing models cannot accurately predict ground-water or streamflow conditions during a growing season. The Georgia Department of Natural Resources, Environmental Protection Division (GaEPD) has implemented a hydrologic assessment of the Upper Floridan aquifer in southwestern Georgia to obtain new information and to further understanding of stream-aquifer relations and the effects of ground-water pumping on streamflow in a karst hydrologic setting. The U.S. Geological Survey (USGS) has engaged in a cooperative effort with GaEPD to develop a ground-water flow model that can account for stream-aquifer interaction and streamflow reduction because of agricultural pumping. Information obtained from the model is vital for the State's management of ground-water resources and for providing early indications of low-streamflow conditions that would affect delivery of water to downstream, out-of-state users.
![]() Flowmeter installed in discharge line of irrigation system. Photo by L. Elliott Jones, USGS.
Flowmeter installed in discharge line of irrigation system. Photo by L. Elliott Jones, USGS.
![]() Real-time streamflow data-collection platform
Real-time streamflow data-collection platform
![]() Real-time streamflow data-collection platform installed at station 02353265, Ichawaynochaway Creek at Georgia Highway 37, near Morgan, Georgia, and graph of data that can be accessed at http://ga.waterdata.usgs.gov/nwis/current/?type=flow&group_key=basin_cd
Real-time streamflow data-collection platform installed at station 02353265, Ichawaynochaway Creek at Georgia Highway 37, near Morgan, Georgia, and graph of data that can be accessed at http://ga.waterdata.usgs.gov/nwis/current/?type=flow&group_key=basin_cd
 Ground-Water Information and Project Support
Ground water accounts for about 22 percent of freshwater withdrawals in Georgia — more than 2.7 billion gallons per day. More than 1.8 million people are served by ground- water supplies, and 734 million gallons per day are with-drawn for irrigation (Julia L. Fanning, U.S. Geological Survey, oral commun., 2004). The distribution and quality of ground water are highly variable and directly related to geology, and natural and human stresses. Monitoring ground-water levels and ground-water quality is essential for the management and development of this resource.
Coffin, Robert, Grams, S.C., Leeth, D.C., and , and Peck, M.F., 2003, Continuous ground-water-level data, and periodic surface-water- and ground-water-quality data, calendar year 2002, v. 2 in Alhadeff, S.J., and McCallum, B.E. (compilers), Water resources data – Georgia, 2002: U.S. Geological Survey Water-Data Report GA-02-2, CD –ROM.
Coffin, Robert, Grams, S.C., Peck, M.F., and Cressler, A.M., 2004, Continuous ground-water-level data, and periodic surface-water- and ground-water-quality data, calendar year 2003, v. 2 in Alhadeff, S.J., McCallum, B.E., Landers, M.N., (compilers), Water resources data–Georgia, 2003: U.S. Geological Survey Water-Data Report GA-03-2, CD –ROM.
![]() A downhole continuous recorder in Gwinnett County, Georgia, which is part of the ground-water-level monitoring network for an ongoing study. The equipment consists of a data logger, battery, and 15-pounds-per-square-inch transducer — all installed inside of a 6-inch-diameter casing. The recorder is set to collect data on an hourly basis, and processed and stored in National Water Information System. Photo by Alan M. Cressler, USGS.
A downhole continuous recorder in Gwinnett County, Georgia, which is part of the ground-water-level monitoring network for an ongoing study. The equipment consists of a data logger, battery, and 15-pounds-per-square-inch transducer — all installed inside of a 6-inch-diameter casing. The recorder is set to collect data on an hourly basis, and processed and stored in National Water Information System. Photo by Alan M. Cressler, USGS.
![]() A typical real-time continuous recorder well in DeKalb County, which is part of the ground-water-level monitoring network. The equipment consists of a data logger, 30-pounds-per-square-inch transducer, a radio and antenna for transmitting data, and a solar panel and battery. Real-time data are typically recorded at 60-minute intervals, stored on site, and then transmitted to USGS offices from every 1 to 4 hours via satellite, telephone, or radio relay. The NWIS database may be accessed on the Web at http://waterdata.usgs.gov/ga/nwis/current/?type=gw Photo by Alan M. Cressler, USGS.
A typical real-time continuous recorder well in DeKalb County, which is part of the ground-water-level monitoring network. The equipment consists of a data logger, 30-pounds-per-square-inch transducer, a radio and antenna for transmitting data, and a solar panel and battery. Real-time data are typically recorded at 60-minute intervals, stored on site, and then transmitted to USGS offices from every 1 to 4 hours via satellite, telephone, or radio relay. The NWIS database may be accessed on the Web at http://waterdata.usgs.gov/ga/nwis/current/?type=gw Photo by Alan M. Cressler, USGS.
![]() A hydrologic technician from the Ground-Water Informa-tion and Project Support Unit collects a water sample for chloride analysis from a well in Glynn County, Georgia. The sampling trailer contains a 5-horsepower centrifugal pump, reel with 100 feet of suction hose, and pipe fittings and adapters. The samples are collected annually in support of the Brunswick and Glynn County Cooperative Water-Resources Program. Photo by Alan M. Cressler, USGS.
A hydrologic technician from the Ground-Water Informa-tion and Project Support Unit collects a water sample for chloride analysis from a well in Glynn County, Georgia. The sampling trailer contains a 5-horsepower centrifugal pump, reel with 100 feet of suction hose, and pipe fittings and adapters. The samples are collected annually in support of the Brunswick and Glynn County Cooperative Water-Resources Program. Photo by Alan M. Cressler, USGS.
![]() A public supply well in Glynn County is shown flowing at about 30 gallons per minute while spinner flowmeter logs were collected to estimate the percentages of water from different water-bearing zones. This well is completed in the confined surficial, upper Brunswick, and lower Brunswick aquifers, and the flowmeter logs help to quantify the ground-water contribution from each zone. Photo by Michael F. Peck, USGS.
A public supply well in Glynn County is shown flowing at about 30 gallons per minute while spinner flowmeter logs were collected to estimate the percentages of water from different water-bearing zones. This well is completed in the confined surficial, upper Brunswick, and lower Brunswick aquifers, and the flowmeter logs help to quantify the ground-water contribution from each zone. Photo by Michael F. Peck, USGS.
 Ground-Water Resources and Hydrogeology of Crystalline-Rock Aquifers in Rockdale County, North-Central Georgia
Ground water in crystalline rocks of the State has not been extensively tapped as a source of public drinking water. This source, however, may prove to be a valuable resource to communities wishing to supplement their existing surface-water supplies and augment the amount of available drinking water in rapidly-growing areas of north Georgia, such as in Rockdale County (map, right). Little information is available to evaluate fully the quantity and quality of ground-water resources in the area. Because geology is the principal control on the availability of ground water, the U.S. Geological Survey (USGS) is conducting this study, in cooperation with Rockdale County, to determine the rock types and geologic structures that influence ground-water availability. Ultimately, this information will increase the understanding of how ground water flows through complex crystalline-rock aquifer systems and provide critical information for the future development and manage-ment of this resource.
![]() Although well inventories are time consuming and require a site visit, it is the only available means to obtain accurate location and water-level data for area wells. Depth, yield, and water level are obtained from wells. Map (A) shows wells inventoried during previous studies. Map (B) shows approximately 450 wells inventoried during this study.
Although well inventories are time consuming and require a site visit, it is the only available means to obtain accurate location and water-level data for area wells. Depth, yield, and water level are obtained from wells. Map (A) shows wells inventoried during previous studies. Map (B) shows approximately 450 wells inventoried during this study.
![]() Water-quality sampling— Samples were collected from three wells to determine water quality. A pump is set into the well to collect the samples. Water-quality properties are monitored during the process of purging the well prior to sampling. Photo by Lester J. Williams, USGS.
Water-quality sampling— Samples were collected from three wells to determine water quality. A pump is set into the well to collect the samples. Water-quality properties are monitored during the process of purging the well prior to sampling. Photo by Lester J. Williams, USGS.
![]() Geologic mapping — Rock types, joints, fractures, and other water-bearing features are mapped by walking along roads, riverbeds, power lines and other access points. The above photo shows a prominent set of joints aligned parallel to the streambed of the Yellow River near Milstead, Georgia. Photo by Lester J. Williams, USGS.
Geologic mapping — Rock types, joints, fractures, and other water-bearing features are mapped by walking along roads, riverbeds, power lines and other access points. The above photo shows a prominent set of joints aligned parallel to the streambed of the Yellow River near Milstead, Georgia. Photo by Lester J. Williams, USGS.
Well refurbishment
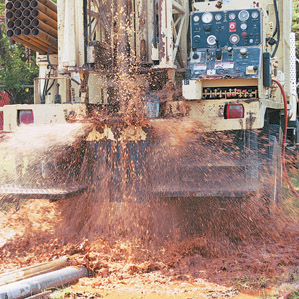
Photo of an air-rotary drilling rig, after 30 minutes |
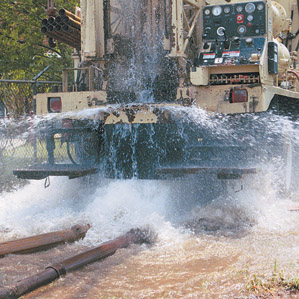
Photo of an air-rotary drilling rig, after 4 hours
Photos of an air-rotary drilling rig used to refurbish and clean out an old (unused) water-supply well in Conyers, Georgia. Photo A was taken after about 30 minutes (reddish color is iron scaling), and Photo B was taken after approximately 4 hours of development. The refurbishment was necessary to prepare the open portion of the borehole for logging and down-hole camera surveys. The drilling rig was air-lifting approximately 250 gallons of water per minute at the end of refurbishment. Photo by Lester J. Williams, USGS.
![]() Borehole geophysical logging—Borehole geophysical tools and down-hole cameras provide the most effective means to study the nature of water-bearing openings.
Borehole geophysical logging—Borehole geophysical tools and down-hole cameras provide the most effective means to study the nature of water-bearing openings.
![]() USGS employees calibrate a three-arm caliper tool. The caliper tool (right) measures diameter by pressing mechanical arms out against the borehole wall. Geophysical tools measure the physical properties of the rock surrounding the well. Photo by Lester J. Williams, USGS.
USGS employees calibrate a three-arm caliper tool. The caliper tool (right) measures diameter by pressing mechanical arms out against the borehole wall. Geophysical tools measure the physical properties of the rock surrounding the well. Photo by Lester J. Williams, USGS.
![]() A caliper log is the simplest log to interpret. Peaks show where the borehole is enlarged and indicate sections of the borehole where a fracture opening may be present. Down-hole camera images of a fracture formed parallel to rock layering at a depth of 73 feet.
A caliper log is the simplest log to interpret. Peaks show where the borehole is enlarged and indicate sections of the borehole where a fracture opening may be present. Down-hole camera images of a fracture formed parallel to rock layering at a depth of 73 feet.
 Sustainability of Ground-Water Resources in the City of Lawrenceville area
The city of Lawrenceville overlies an igneous and metamorphic-rock aquifer that supplies about 6 percent of the city's current water use. Lawrenceville plans to increase ground-water withdrawal from wells located in the upper Alcovy River Basin and from wells in the Redland–Pew Creek River Basin. Long-term effects of the withdrawal of ground water in this area are largely unknown. For this reason the U.S Geological Survey (USGS), in cooperation with the city of Lawrenceville, began a study to investigate the sustainability of ground-water resources as additional municipal wells become operational.
Concern about the possible effects of ground-water withdrawal has led the city of Lawrenceville to install a monitoring network to assess changes in the hydrologic system that pumping may initiate. These changes possibly include a decrease in ground-water levels, cross-basin transfer of ground water, dewatering of the overlying saprolite, and a decline in streamflows. As ground-water development continues to increase in the Piedmont region of Georgia, it is important to monitor the effects of ground-water withdrawal to better manage the resource.
![]() Location of the Lawrenceville study area in the Piedmont physiographic province of Georgia.
Location of the Lawrenceville study area in the Piedmont physiographic province of Georgia.
![]() The USGS is monitoring streamflow weekly at four sites in the study area, one of these being Redland Creek, shown above. Photo by Phillip N. Albertson, USGS.
The USGS is monitoring streamflow weekly at four sites in the study area, one of these being Redland Creek, shown above. Photo by Phillip N. Albertson, USGS.
![]() Staff gage on Cedar Creek. Photo by Phillip N. Albertson, USGS.
Staff gage on Cedar Creek. Photo by Phillip N. Albertson, USGS.
![]() Drillers install a new regolith monitoring well. Photo by Phillip N. Albertson, USGS.
Drillers install a new regolith monitoring well. Photo by Phillip N. Albertson, USGS.
Back to the Table of Contents
Recent USGS publications on Georgia or Georgia Water-Resources Information