 |
|
|
||||
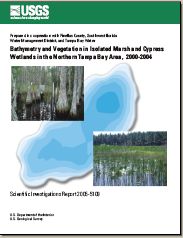
| Scientific Investigations Report 2005-5109 |
Prepared in cooperation with
2005
 |
Select an option: |
|
CONTENTS Abstract Introduction Purpose and Scope Background Site Selection Description of the Study Area Acknowledgments Methods of Data Collection and Analysis Delineation of the Wetland Perimeter and Determination of Perimeter Elevations Measurement of Wetland Stage and Collection of Bathymetric Data Creation of Bathymetric Contour Maps and Calculation of Wetland Area and Stored Water Volume Assessment of Wetland Vegetation Bathymetry of Marsh and Cypress Wetlands Stage-Area-Volume Relations for Marsh and Cypress Wetlands Potential Effects of Bathymetric Mapping Approach on Stage-Area and Stage-Volume Relations Relative Abundance of Wetland Plants in Fixed Plots Natural Marsh Wetlands Impaired Marsh Wetland Augmented Marsh Wetlands Natural Cypress Wetlands Impaired Cypress Wetland Augmented Cypress Wetlands Relation of Wetland Vegetation to Bathymetry Summary and Conclusions References Appendixes
|
Wetland bathymetry and vegetation mapping are two commonly used lines of evidence for assessing the hydrologic and ecologic status of expansive coastal and riverine wetlands. For small isolated freshwater wetlands, however, bathymetric data coupled with vegetation assessments are generally scarce, despite the prevalence of isolated wetlands in many regions of the United States and the recognized importance of topography as a control on inundation patterns and vegetation distribution.
In the northern Tampa Bay area of west-central Florida, bathymetry was mapped and vegetation was assessed in five marsh and five cypress wetlands. These 10 isolated wetlands were grouped into three categories based on the effects of ground-water withdrawals from regional municipal well fields: natural (no effect), impaired (drier than natural), and augmented (wetlands with artificially augmented water levels). Delineation of the wetland perimeter was a critical component for estimating wetland-surface area and stored water volume. The wetland perimeter was delineated by the presence of Serenoa repens (the �palmetto fringe�) at 9 of the 10 sites. At the 10th site, where the palmetto fringe was absent, hydric-soils indicators were used to delineate the perimeter. Bathymetric data were collected using one or more techniques, depending on the physical characteristics of each wetland. Wetland stage was measured hourly using continuous stage recorders. Wetland vegetation was assessed semiannually for 2 1/2 years in fixed plots located at three distinct elevations. Vegetation assessments were used to determine the community composition and the relative abundance of obligate, facultative wet, and facultative species at each elevation.
Bathymetry maps were generated, and stage-area and stage-volume relations were developed for all 10 wetlands. Bathymetric data sets containing a high density of data points collected at frequent and regular spatial intervals provided the most useful stage-area and stage-volume relations. Bathymetric maps of several wetlands also were generated using a low density of data points collected along transect lines or contour lines. In a comparative analysis of the three mapping approaches, stage-area and stage-volume relations based on transect data alone underestimated (by 50-100 percent over certain ranges of stage) the wetland area and volume compared to results using a high density of data points. Adding data points collected along one elevation contour below the wetland perimeter to the transect data set greatly improved the agreement of the resulting stage-area and stage-volume relations to the high-density mapping approach.
Stage-area relations and routinely monitored stage data were used to compare and contrast the average flooded area in a natural marsh and an impaired marsh over a 2-year period. Vegetation assessments used together with flooded-area information provided the potential for extrapolating vegetation results from points or transects to wetlands as a whole. A comparison of the frequency of flooding of different areas of the wetland and the species composition in vegetation plots at different elevations indicated the dependence of vegetation on inundation frequency. Because of the broad tolerances of many wetlands plants to a range of inundation conditions, however, vegetation assessments alone provided less definitive evidence of the hydrologic differences between the two sites, and hydrologic changes occurring during the 2 years, than the flooded-area frequencies.
Combining flooded-area frequencies with vegetation assessments could provide a more versatile and insightful approach for determining the ecological status of wetlands than using vegetation and stage data alone. Flooded-area frequencies may further provide a useful approach for assessing the ecological status of wetlands where historical vegetation surveys and stage data are lacking. Comparing the contemporary flooded-area frequencies and vegetation in impaired or augmented wetlands to the flooded-area frequencies of natural wetlands with similar geologic and climatic settings provides a method to assess the impacts of human activities on hydrology and ecology. The approach requires first determining flooded-area frequencies in a representative population of natural (or reference) wetlands. Because the variables are spatial, such comparisons can be used to interpret the extent of wetland mitigation achieved using augmentation, and to objectively assess the area of wetlands affected by human activities.
Bathymetric data, historical stage data, stage-area and stage-volume relations, and vegetation community assessment are all important tools for water managers tasked with assessing wetland status and the impacts of human activities on wetlands. Together these data sets can be used as tools to refine understanding and management of wetland systems.
U.S. Department of the Interior
U.S. Geological Survey
Suite 215
10500 University Center Dr.
Tampa, FL 33612-6427
khhaag@usgs.gov
| AccessibilityFOIAPrivacyPolicies and Notices | |
 |
|