
Quality-Control Practices
Analytical Sequence
The same analytical sequence is used each time the GC is run. The analytical sequence is given in table 8.
Table 8
(View this table on a separate page.)Sequence of blanks, calibration standards, quality-control standards, and unknown samples analyzed during one run of the gas chromatograph.
[MTBE, methyl tert-butyl ether; Std, standard; QCS, quality-control sample; µg/L, micrograms per liter; HAA, haloacetic acid; CCV, continuing calibration verification]
[MTBE, methyl tert-butyl ether; Std, standard; QCS, quality-control sample; µg/L, micrograms per liter; HAA, haloacetic acid; CCV, continuing calibration verification]
| Vial number | Sample ID | Sample description |
|---|---|---|
| 1 | MTBE | Instrument blank |
| 2 | Std 1 | Calibration standards |
| 3 | Std 2 | Calibration standards |
| 4 | Std 3 | Calibration standards |
| 5 | Std 4 | Calibration standards |
| 6 | Std 5 | Calibration standards |
| 7 | Std 6 | Calibration standards |
| 8 | Std 7 | Calibration standards |
| 9 | Std 8 | Calibration standards |
| 10 | Std 9 | Calibration standards |
| 11 | MTBE | Instrument blank |
| 12 | Extraction blank | Organic-free water carried through all extraction steps |
| 13 | Full procedural blank | Organic-free water carried through full procedure |
| 14 | QCS5 | Quality-control standard containing 5 µg/L of each HAA |
| 15 | QCS50 | Quality-control standard containing 50 µg/L of each HAA |
| 16 | MTBE | Instrument blank |
| 17 | Sample 1 diluted | Sample used for matrix spike, sample is diluted 1:5 with organic-free water |
| 18 | Matrix spike | 1:4 diluted sample 1 spiked with std 5 concentrations of HAA |
| 19 | Matrix spike duplicate | 1:4 diluted sample 1 spiked with std 5 concentrations of HAA |
| 20 | Sample 2 | Sample |
| 21 | Sample 3 | Sample |
| 22 | Sample 4 | Sample |
| 23 | Sample 5 | Sample |
| 24 | Sample 6 | Sample |
| 25 | Sample 7 | Sample |
| 26 | Sample 8 | Sample |
| 27 | Sample 9 | Sample |
| 28 | Sample 10 | Sample |
| 29 | MTBE | Instrument blank |
| 30 | CCV – std 4 | Continuing calibration verification-std level 4 |
| 31 | CCV – std 5 | Continuing calibration verification-std level 5 |
| 32 | MTBE | Instrument |
| 33 | Sample 1 | Same samples as in vials 17−29, but diluted 1:5 with organic-free water prior to extraction |
| 34 | Sample 2 diluted | Diluted sample |
| 35 | Sample 3 diluted | Diluted sample |
| 36 | Sample 4 diluted | Diluted sample |
| 37 | Sample 5 diluted | Diluted sample |
| 38 | Sample 6 diluted | Diluted sample |
| 39 | Sample 7 diluted | Diluted sample |
| 40 | Sample 8 diluted | Diluted sample |
| 41 | Sample 9 diluted | Diluted sample |
| 42 | Sample 10 diluted | Diluted sample |
| 43 | MTBE | Instrument blank |
| 44 | CCV – std 4 | Continuing calibration verification–std level 4 |
| 45 | CCV – std 5 | Continuing calibration verification–std level 5 |
| 46 | MTBE | Instrument blank |
Calibration Standard Level-2 Check
After the analysis sequence has started, the performance of calibration standard level-2 is checked to insure proper detector sensitivity, peak symmetry, and peak resolution. Peak area counts for the nine HAA in the level-2 calibration standard are recorded for every run to monitor the continuity of instrument performance. Drastic changes in peak area counts between runs or gradual drift in peak area counts during several runs indicate that corrective actions are required. The chromatographic separation between peaks in the two pairs of closely eluting peaks is examined. The peaks for dibromoacetic acid [retention time (RT) = 13.308 min] and bromodichloroacetic acid (RT = 13.529 min) should be fully resolved to the baseline, and the peaks for trichloroacetic acid (RT = 10.745 min) and bromochloroacetic acid (RT = 10.864 min) should be nearly resolved to the baseline. Inability to demonstrate acceptable instrument performance indicates the need for reevaluation of the instrument system. If column or chromatographic performance cannot be met, one or more of the following remedial actions should be taken: cut off approximately 0.3 to 0.5 meter (m) of the injector end of the column and reinstall, change injector liner, or install a new column. Peak shape and resolution also can be affected by adjusting column flows or modifying the oven temperature program.
Blanks
Three types of blanks are analyzed for the HAAFP method: instrument blanks, extraction blanks, and full procedural blanks. Instrument blanks composed of MTBE are analyzed at the beginning of the run; after the calibration-curve standards, QC standards, and continuing calibration verification standards; and between sets of samples within the run. The measured HAA concentration in the instrument blank must be less than half the concentration in the lowest calibration standard. This concentration corresponds to maximum permissible concentrations in the instrument blanks of 0.05µg/L for trichloroacetic acid and dibromoacetic acid; 0.1µg/Lfor monobromoacetic acid, bromochloroacetic acid, and bromodichloroacetic acid; 0.15µg/L for monochloroacetic acid and dichloroacetic acid; 0.25µg/L for dibromochloroacetic acid; and 0.5µg/L for tribromoacetic acid. If the instrument blanks have higher concentrations of HAA than permitted, corrective actions must be taken. The injector end of the column should be cut and reinstalled, the injection liner changed, or a new column installed.
Extraction blanks consist of organic-free water extracted and methylated along with the samples. This blank is used to test for contamination or interference in the extraction and methylation steps. Any compounds detected must have concentrations below the MDL.
Full procedural blanks consist of organic-free water that is dosed, incubated, and quenched like a sample. It is dosed to achieve a residual-free Cl2 concentration of 2–4 mg/L. The full procedural blanks then are extracted and methylated along with the samples. This blank is used to test for overall cleanliness of sample handling during the dosing and quenching process and to demonstrate the presence/absence of any interference in the extraction and methylation process. Traces of monochloroacetic acid, dichloroacetic acid, and trichloroacetic acid, usually below the established MDL, commonly are found in the full procedural blanks (fig. 1). If concentrations higher than the MDL are observed, the source of contamination should be determined and eliminated. Samples associated with a contaminated full procedural blank are to be considered suspect and should be re-extracted, if possible.
Quality-Control Samples
The quality-control samples (QCS) are used to verify the primary calibration standards and are prepared from the QCSS A and B. The QCS50 is prepared by adding 10 µL of QCSSA to 40 mL of organic-free water to give a final concentration of 50 µg/L for each of the nine HAA. The QCS5 is prepared by adding 10 µL of QCSSB to 40 mL of organic-free water to give a final concentration of 5 µg/L for each of the nine HAA. These samples are included with each sample set for extraction and methylation. QCS5 is used to check the low end of the calibration curve and QCS50 is used to check the high end of the calibration curve. The percent recovery and standard deviation were determined for 16 QCS5 and for 15 QCS50 samples (table 9). Acceptable recoveries are 70 to 130 percent of the true value for all nine HAA, although actual recoveries are generally better. The QCS analyzed during this study had recoveries ranging from 75 to 122 percent of the true value for all nine HAA. If the measured analyte concentrations are not of acceptable accuracy, then the following must be checked: (1) the standard solutions for degradation, (2) contamination, (3) instrument performance, and (4) the entire analytical procedure to locate and correct the source of the problem. Once the problem has been solved, the samples need to be re-extracted and analyzed, if possible.
Table 9
(View this table on a separate page.)The percent recovery for nine haloacetic acids in replicate samples of quality-control standards.
[n, number of replicate samples; µg/L, micrograms per liter]
[n, number of replicate samples; µg/L, micrograms per liter]
| Quality-control Sample 5 (n=16) | Quality-control Sample 50 (n=15) | |||||
|---|---|---|---|---|---|---|
| Analyte name | Concentration (µg/L) | Mean percent recovery | Standard deviation (percent) | Concentration (µg/L) | Mean percent recovery | Standard deviation (percent) |
| Bromochloroacetic acid | 5.0 | 84 | 8.2 | 50 | 80 | 7.6 |
| Bromodichloroacetic acid | 5.0 | 75 | 17 | 50 | 84 | 13 |
| Dibromochloroacetic acid | 5.0 | 114 | 27 | 50 | 122 | 19 |
| Dibromoacetic acid | 5.0 | 109 | 16 | 50 | 116 | 27 |
| Dichloroacetic acid | 5.0 | 108 | 12 | 50 | 97 | 8.6 |
| Monobromoacetic acid | 5.0 | 105 | 21 | 50 | 102 | 8 |
| Monochloroacetic acid | 5.0 | 104 | 15 | 50 | 103 | 23 |
| Tribromoacetic acid | 5.0 | 118 | 44 | 50 | 118 | 27 |
| Trichloroacetic acid | 5.0 | 111 | 16 | 50 | 110 | 18 |
Continuing Calibration Verification Standard
The continuing calibration verification (CCV) standards are used to verify that the calibration is accurate through the entire run. They are prepared by the same method as the procedural calibration standards and at the same concentration as standard levels 4 and 5. Acceptable mean-percent recovery values for this method are 70 to 130 percent for each of the nine HAA. The mean-percent recovery and standard deviation for the CCV standards (standard level 5) analyzed with the Orange County surface-water samples are presented in table 9. The mean-percent recovery values range from 86 to 113 percent for this sample set.
Table 10
(View this table on a separate page.)The mean percent recovery for the nine haloacetic acids in 28 analyses of continuing calibration verification standard level 5.
[µg/L, micrograms per liter; n, number of standards analyzed]
[µg/L, micrograms per liter; n, number of standards analyzed]
| Analyte name | Concentration (μg/L) | Mean percent recovery (n = 28) | Standard deviation (percent) |
|---|---|---|---|
| Bromochloroacetic acid | 4.0 | 105 | 8 |
| Bromodichloroacetic acid | 4.0 | 86 | 10 |
| Dibromochloroacetic acid | 10. | 86 | 9 |
| Dibromoacetic acid | 2.0 | 97 | 12 |
| Dichloroacetic acid | 6.0 | 113 | 4 |
| Monobromoacetic acid | 4.0 | 108 | 8 |
| Monochloroacetic acid | 6.0 | 113 | 14 |
| Tribromoacetic acid | 20. | 92 | 16 |
| Trichloroacetic acid | 2.0 | 95 | 11 |
Surrogate Recovery
The surrogate analyte is added to the aqueous portion of all samples and blanks. The surrogate is a means of assessing method performance for every sample from extraction to final chromatographic performance. For the Orange County surface-water samples used to develop this method, the average surrogate recovery was 106 percent with a standard deviation of 17 percent. The surrogate recovery for this method should be between 70 and 130 percent. If the surrogate recovery is outside this range, check (1) standard solutions for degradation, (2) contamination, and (3) instrument performance. If those steps do not reveal the cause of the problem, the sample should be reextracted and reanalyzed, if possible. If the surrogate recovery of the reanalyzed sample meets the criterion, only data for the reextracted sample should be reported. If the reanalysis fails the 70–130 percent recovery criterion, the sample should be flagged as showing possible matrix interference and all data for that sample should be reported as estimated data.
Internal Standard Area Count
The EZChrom software uses the IS to quantify the samples. The IS response (peak area counts or peak height) is checked and under current (2002) conditions is approximately 230,000 area counts. For the Orange County surface water samples, the IS response varied from 189,000 to 291,000 area counts with a mean of 230,000 area counts and a standard deviation of 21,800. The analyst must monitor the IS response of all injections during each analysis day. The IS response for any sample should not deviate from this mean IS response by more than 30 percent. If the IS response is not within 30 percent for an individual extract, check the chromatogram for coelution problems and, if necessary, optimize instrument performance and analyze a new extract. If this analyzed aliquot produces an acceptable IS response, report results for that aliquot.
Matrix Spikes
Matrix spikes are prepared by adding a known concentration of all nine analytes to one sample per extraction set or a minimum of 10 percent of the samples, whichever is greater. The concentrations should be equal to or greater than the background concentrations in the sample selected for spiking. Matrix spikes for the Orange County, California, surface-water samples were diluted 1:5 with organic-free water prior to dosing and then spiking with 8 µL of working standard solution B. Matrix spikes should be analyzed for samples from all routine sample sources.
The mean-percent recoveries for each analyte are calculated, and in order for the recoveries to be considered acceptable, they must fall between 70 and 130 percent for all the target analytes. If the recovery falls outside of this acceptance range and no other problems with the analysis could be determined, then a matrix-induced bias can be assumed for the respective analyte. The data for the analyte must be reported to the data user as suspect due to matrix effects.
Duplicates
The duplicates are used to assess the precision of the dosing and extraction process. The matrix spike duplicates are used to assess the validity of matrix interferences. The duplicates are prepared starting with the dosing process. Matrix spike duplicates are prepared prior to the extraction process by taking one sample vial and splitting it into three samples. These three samples are made by using 8 mL of sample and diluting to a final volume of 40 mL with 32 mL of organic-carbon-free water. Two of these diluted samples then are spiked with HAA and the third is used to assess background levels.
The percent relative difference between duplicate results should be less than or equal to 30 percent. The percent relative difference is determined by the following formula:
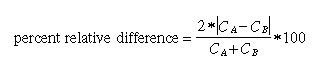
(6)
where
- CA is the measured concentration in one of duplicates and
- CB is the measured concentration in the other duplicate
The percent relative differences for the duplicates and matrix spike duplicates for the Orange County surface-water samples ranged from 0.02 to 28.3 percent and 0 to 28.2 percent, respectively.
Instrument Maintenance
Instrument maintenance is performed on the autosampler, injection port, detector, and column prior to analyzing a new extraction batch or after analyzing 50 extracts, whichever comes sooner. In order to insure proper instrument performance, the injector and detector are baked at 350ºC according to instrument and column manufacturer’s recommendation. The injector side of the analytical column is cut by approximately 0.3 to 0.5 m and reinstalled; the syringe on the autosampler is inspected for wear and sample residue. Also, the septum on the injector is replaced after approximately 100 injections or after analyzing two extraction batches.