Scientific Investigations Report 2005–5215
U.S. GEOLOGICAL SURVEY
Scientific Investigations Report 2005–5215
Each monthly VS2DH model’s saturated hydraulic conductivity and anisotropy ratio was optimized with PEST based on simulated and measured subsurface temperatures. The results varied greatly between a single transect’s monthly model runs for saturated hydraulic conductivity and the anisotropy ratio. Saturated hydraulic conductivity values varied from month to month at one transect as much as three orders of magnitude from the slug-test estimate, and some anisotropy ratio estimates varied the entire allowed range from 0.1 to 1.
Based on PEST results and visual interpretations of the simulated and measured temperature comparisons, saturated hydraulic conductivity was adjusted within an order of magnitude of the slug-test estimate. A single value of saturated hydraulic conductivity was chosen for each textural class for the entire modeling period. Anisotropy values were chosen following the same methodology within the range of acceptable values for the area (0.1–1).
Because VS2DI models heat transport, comparisons between measured and simulated subsurface temperatures are the primary indication of model accuracy. Differences between the temperature comparisons are typically less than 2°C, with a range of 0–5°C (figs. 4A-B). As noted earlier, the PEST modeling results were used to update saturated hydraulic conductivity and the anisotropy ratio. Using simulated and measured temperature differences, additional modifications in the saturated hydraulic conductivity and anisotropy ratio were made. For example, an increase in the saturated hydraulic conductivity increases the amplitude of the simulated temperature to match the measured temperature variation, while decreasing the anisotropy ratio prevents the increased temperature amplitude from propagating to the simulated subsurface temperature.
Another evaluation of model performance is to compare measured and simulated head values. Simulated ground-water head information was exported along with the temperature data at piezometers B, C, E, and F. The field measured head values were then subtracted from the simulated head values with corresponding dates and times (table 2) to determine simulated head errors. The simulated heads were greater than the measured heads except for a couple of instances for the model of transect 2. Transect 2 had the smallest head differences at less than 0.25 ft, followed by transect 3 at about 0.25 ft. Transects 2 and 3 have the best estimates of seepage according to their low simulated and measured head differences. Transect 3’s head differences were about 0.5 ft, and transect 4 was the worst at about 1 ft head difference between the simulated and measured.
| Transect | Piezometer | Month | ||||
|---|---|---|---|---|---|---|
| April | May | June | July | August | ||
| 1 | B | 0.59 | 0.51 | 0.47 | 0.40 | 0.51 |
| 1 | C | .61 | .44 | .41 | .33 | .46 |
| 1 | E | .80 | .57 | .58 | .79 | .60 |
| 1 | F | .75 | .59 | .74 | .83 | .73 |
| 2 | B | .24 | .02 | -.03 | .08 | .02 |
| 2 | C | .60 | .04 | .00 | .09 | .06 |
| 2 | E | .13 | -.00 | -.04 | .03 | .03 |
| 2 | F | .39 | .15 | .21 | .17 | .25 |
| 3 | B | .05 | .47 | .17 | .13 | .25 |
| 3 | C | .13 | .40 | .21 | .18 | .25 |
| 3 | E | .18 | .35 | .20 | .21 | .22 |
| 3 | F | .33 | .78 | .46 | .47 | .59 |
| 4 | B | 1.43 | 1.47 | 1.44 | 1.47 | 2.24 |
| 4 | C | 1.01 | .98 | .98 | 1.02 | 1.72 |
| 4 | E | .76 | .79 | .81 | .79 | 1.56 |
| 4 | F | .83 | .74 | .81 | .73 | 1.72 |
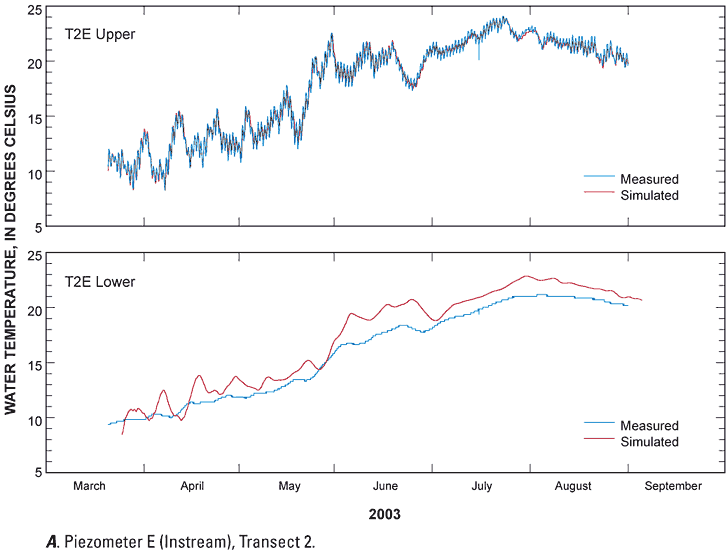
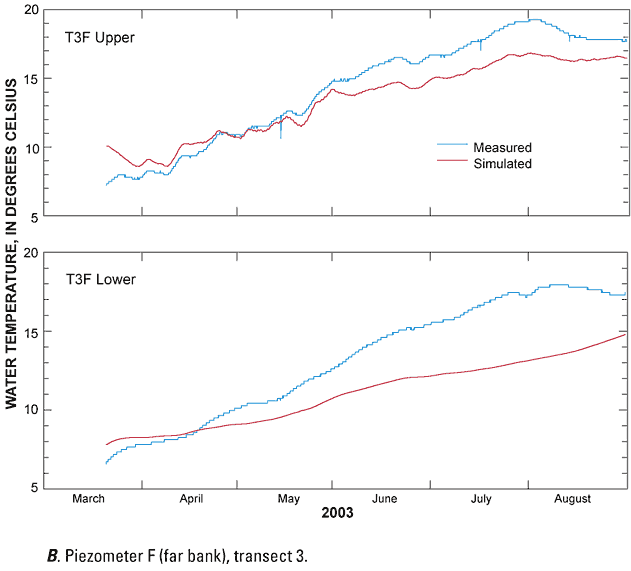
Figure 4.—Continued.
The objective of the modeling is to estimate the flux between ground water and surface water within a 3 river-mile reach of the lower Boise River. The VS2DI software estimates the total seepage (or flux) of water through the model for every hourly recharge period and the total seepage for the entire model run. However, the VS2DI models estimate seepage for the entire model area, not just within specific boundaries (i.e., only the streambed boundary). As head measurements indicate, there is a horizontal gradient of ground water through each transect. The horizontal gradient precludes using the seepage estimates provided by VS2DI because they would include ground water flowing in from one side of the model and out the other.
An alternative method for determining seepage using the Darcy equation was identified by using the ground-water velocities for each model grid cell along the streambed. VS2DH can export horizontal and vertical ground-water velocities for each grid cell and recharge period. The vertical ground-water velocities at each grid cell along the streambed of the model were multiplied by the grid cell’s cross-sectional area to determine a volume flux per time (cubic feet per second [ft3/s]) through the unit width (1 meter) modeled streambed. The volumes were then summed to get a total flux per time for the portion of the transect that interacts with the streambed. The resultant flux estimate is expressed in units of (ft3/s)/m, which were then converted to (ft3/s)/mi for comparison with previous studies.
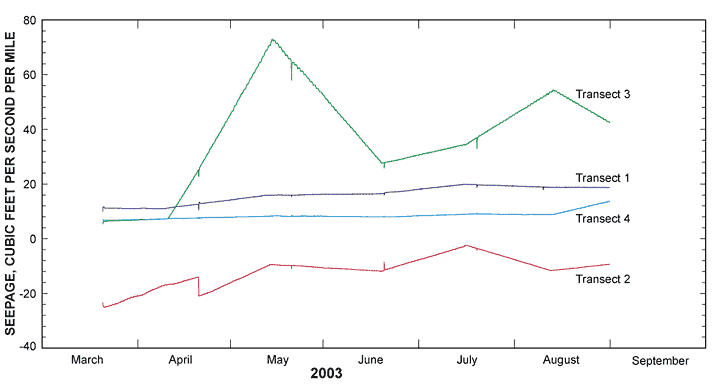
The seepage-rate estimates (fig. 5) are primarily controlled by the relation between the ground-water head and stream stage. A linear change in the simulated seepage occurs between the times the ground-water head and stream stage values were measured. Breaks in the seepage estimates, most visible in transect 2, indicate the transition from one month’s model to the next (fig. 5). Even though all the ending conditions from one month’s model are copied into the beginning conditions of the next month’s model, a short transition period still occurs.
Transect 2 was the only transect indicating a losing stream condition (that is, seepage from the stream into the ground water). However, due to the large simulated head errors in transect 4, seepage estimates for this transect are high. Therefore, an equilibrium or slightly losing stream condition could be within the error range. The seepage rates shown in figure 5 vary greatly from transect to transect. Seepage rate estimates range from 8 to 16 (ft3/s)/mi for transect 1, gradually increasing throughout the modeling period. Transect 4 was similar to transect 1, with a seepage rate increasing from 6 to 14 (ft3/s)/mi throughout the simulation period. Transect 2 was a losing reach with seepage from the river at a decreasing rate of 18 to 2 (ft3/s)/mi. Transect 3 had the highest seepage rates to the river at 73 (ft3/s)/mi. They all indicate a rising water table and/or a falling stream stage during the summer months.
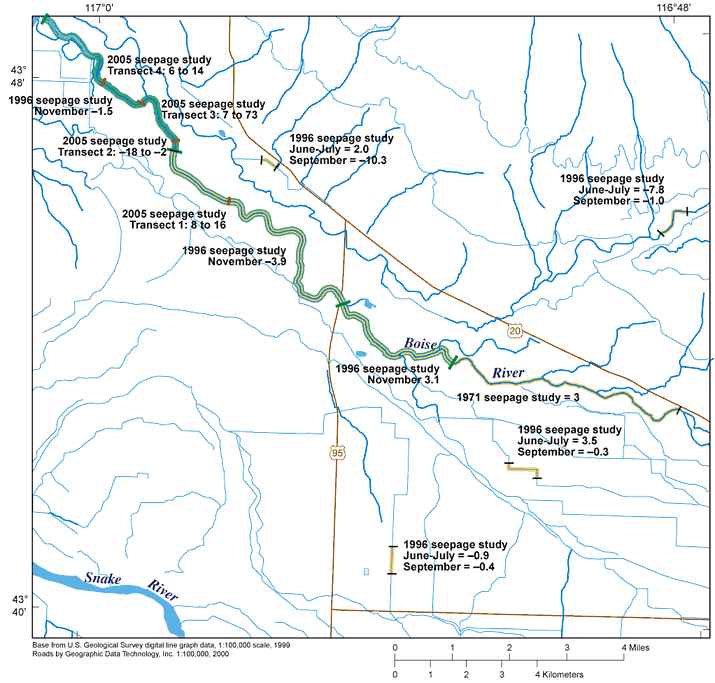
One previous estimate of seepage in the lower Boise River was conducted during the non-irrigation season in November 1971 by comparison of discharge measurements throughout the river reach. Thomas and Dion (1974) estimated the seepage of ground water to the Boise River between the gaging stations at Notus (13212500) and Parma (13213000) to be an average of 3 ft3/s. This estimate is for seepage due to seeps and very short drains, all of which come from ground water, Thomas and Dion (1974) conducted this study during a 3-day period when no water was being released from Lucky Peak Dam. The difference between discharge measurements at the U.S. Highway 95 crossing of the Boise River and the gaging station at Parma was a gain of 43 ft3/s from tributaries, diversions, and drains. This figure converts to an average gain of 10 (ft3/s)/mi. A 1999 seepage study by Berenbrock (1999) in canals near this project’s study area during June-July and again in September 1996 yielded seepage ranges of -10.3 to 3.52 (ft3/s)/mi (negative values indicate a seepage from the river to ground water) with the late summer seepage values being less than those for early summer except for one location. Berenbrock (1999) also conducted seepage measurements during November 1996 in the Boise River near this project’s study area with seepage rates of -3.9 to -3.1 (ft3/s)/mi (fig. 6).
The previous estimates for seepage in the study area are based on seepage run estimates, which result in a seepage rate representative of an extended reach of a stream or canal. Seepage run estimates are determined by measuring all of the inflow and outflow surface-water discharges for a reach of stream. The difference between inflow and outflow is either seepage into the stream from ground water or out of the stream to ground water. The seepage rate estimates from VS2DI are for transect locations on the stream with a unit width of one meter, and they are indicative of that short river reach only. Multiple VS2DI seepage estimates indicate the variability of seepage that occurs within an extended stream reach and how it varies over time. While the VS2DI seepage estimates show the variability of seepage throughout a stream reach, the variability makes it difficult to determine the total amount of seepage occurring in the entire stream reach. Although this variability creates uncertainty with respect to the extent to which measurements for one transect may be extrapolated over a stream reach, figure 6 shows all the reported seepage values for this and previous reports providing a comparative survey of reported seepage fluxes for this section of the lower Boise River.
For more information about USGS activities in Idaho, visit the USGS Idaho Water Science Center home page .

![]() U.S. Department of the Interior |
U.S. Geological Survey
U.S. Department of the Interior |
U.S. Geological Survey
Persistent URL: https://pubs.water.usgs.gov/sir
Page Contact Information: Publications Team
Page Last Modified:
