Scientific Investigations Report 2005-5227
U.S. GEOLOGICAL SURVEY
Scientific Investigations Report 2005-5227
The SVRP aquifer is composed of the previously described unconsolidated coarse-grained sand, gravel, cobbles, and boulders primarily deposited by a series of catastrophic glacial outburst floods. The material deposited in this high-energy depositional environment is coarser-grained than is typical for most basin-fill deposits, resulting in one of the most productive aquifers in the world. Water volume in the entire SVRP aquifer is estimated to be about 10 trillion gallons with an average of about 250 to 650 Mgal of water flowing through the aquifer daily at the Idaho–Washington border (MacInnis and others, 2000).
The aquifer generally has a greater percentage of finer material near the margins of the valley and becomes more coarse and bouldery near the center of the valley. Near Athol and between Athol and Rathdrum, several bodies of perched water have been reported in the flood deposits where downward water percolation is slowed by clay lenses or low-permeability till (Anderson, 1951). In the Spokane Valley, the aquifer is reported to contain no significant layers of low-permeability materials. In the Hillyard Trough, however, a clay layer appears to separate the aquifer into upper and lower units (pl. 2, section A-A’) (CH2M HILL, 2000). This clay layer is presumed to be glacial lake deposits from glacial Lake Columbia. In north Spokane County, the glaciolacustrine deposits are difficult to distinguish from the Latah sediments, especially in well logs (Boese, 1996).
In the Spokane area, CH2M HILL (1998) reports that the SVRP aquifer in the west part of the Spokane area consists of two relatively independent systems mostly separated by a buried basalt ridge that extends about 2 mi south of Five Mile Prairie. The main body of the aquifer is east of the ridge and in the Hillyard Trough and part of Spokane Valley. An area referred to as Trinity Trough is a breach across this basalt ridge and probably connects the east and west parts of the aquifer in that vicinity. The small portion of the aquifer between Spokane Falls and Nine Mile Dam has been referred to as to the western arm of the aquifer (J. Covert, Washington Department of Ecology, written commun., 2005) and the downriver segment (CH2M HILL, 1998).
In the downriver segment of the SVRP aquifer, at the former city of Spokane North Landfill site, monitoring well drillers’ logs indicate that SVRP aquifer flood deposits are underlain by glacial lake deposits (silt and clay) except in lower elevation areas near the Spokane River where the aquifer is underlain by basalt (CH2M HILL, 1988).
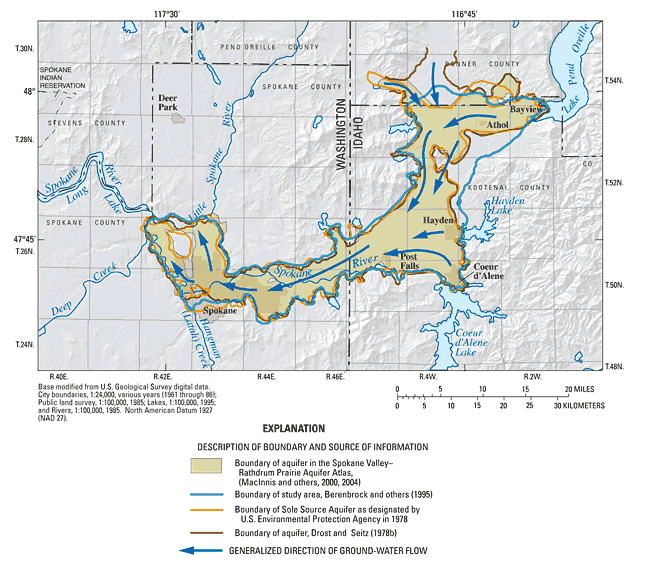
The areal extent of the SVRP aquifer designations differ somewhat between investigators and over time. Many recent aquifer-related documents, including the SVRP Atlas (MacInnis and others, 2000, 2004), used a modified version of the original Spokane Valley–Rathdrum Prairie Sole Source Aquifer boundary designated by the USEPA in 1978 (fig. 5). Earlier studies tended to use a somewhat larger aquifer boundary as shown in Drost and Seitz (1978b, fig. 5). A slightly larger extent, that includes more of the surficial deposits adjacent to and in hydraulic connection with the Sole Source Aquifer, is shown in Berenbrock and others (1995, fig. 5).
For modeling purposes, it may be important to use a more inclusive aquifer boundary to better represent contributions from adjacent surficial deposits that are in hydraulic connection with the Sole Source Aquifer. An example of this is in the Chilco channel area where ground water flows into the Rathdrum Prairie portion of the Sole Source SVRP aquifer from an area in hydraulic connection with the aquifer but outside the official aquifer boundary (Painter, 1991a, 1991b, Graham and Buchanan, 1994). Similarly, Baldwin and Owsley (2005) have documented about 200 ft of saturated alluvium within the Middle (Ramsey) Channel that has similar water levels to the surrounding Sole Source Aquifer. They also suggested that this area be incorporated into the official aquifer extent in order for this area to be treated with the same levels of aquifer protection as the rest of the aquifer.
A revised extent map was drawn for this investigation that includes unconsolidated coarse-grained deposits based on the most recent surficial geologic mapping (pl. 2), including the Middle (Ramsey) and Chilco Channels. The revised map reflects adjustments that were made by moving the boundaries of the aquifer within Hoodoo and Spirit Valleys and near Careywood, Idaho, to ground-water divides that were mapped during previous investigations (Walker, 1964; Parliman and others, 1980).
The revised extent map also includes revisions to the aquifer boundary along the western arm of the aquifer near Riverside State Park in Washington (pl. 2). Recent analysis of ground-water level data, Nine Mile Reservoir elevation data, bedrock outcrops, and historical streamflow data have resulted in redrawing the western arm of the aquifer boundary ending near Nine Mile Falls rather than being continuous through that area as shown in previous aquifer boundaries. A bedrock ridge extending northwest from Five Mile Prairie to Nine Mile Dam forms the northern boundary of the western arm of the aquifer (J. Covert, Washington Department of Ecology, written commun., June 2005). The aquifer ends about one mile south of Nine Mile Dam and the water moving through this arm of the aquifer re-emerges into the Spokane River (Nine Mile Reservoir) before the dam. Summer streamflow data from the 1950s show that the Spokane River gained as much as 400 ft3/s between Hangman (Latah) Creek and Nine Mile Dam from the aquifer (J. Covert, Washington Department of Ecology, written commun., June 2005). Following completion of Nine Mile Dam, summer reservoir levels have been maintained at a constant level by changing the volume of water discharged through the dam. The water-table in the western arm of the aquifer is controlled by the elevation of Nine Mile Reservoir and ground water levels in the area between Seven Mile bridge and the dam follow the trend exhibited by Nine Mile Reservoir (J. Covert, Washington Department of Ecology, written commun., June 2005).
SVRP aquifer thickness generally is unknown except along its margins where wells have been drilled through its entire thickness. Since many wells in the SVRP aquifer are extremely productive, few wells in the aquifer extend more than 100 ft into the saturated zone. Well depths in the USGS National Water Information System (NWIS) database range from less than 10 to about 700 ft with a median of 162 ft. The greatest known thickness was recorded in Hillyard Trough where a 780-ft well did not penetrate the full thickness of the glacial and flood deposits (Cline, 1969). Coarse aquifer deposits in the Hillyard Trough area are separated by a layer of clay, silt, and sand at about 360 to 490 ft below land surface. The aquifer thickness is about 500 to 550 ft near the Idaho−Washington State line east of Spokane, Washington (Gerstel and Palmer, 1994) and overall, aquifer deposits are about 150-ft to more than 600-ft deep (MacInnis and others, 2000). Generalized hydrogeologic cross sections (simplified from CH2M HILL 1998, 2000a, and Baldwin and Owsley, 2005) for the Hillyard Trough (A−A’), Spokane Valley (B−B’), state line area (C−C’), and West (Main), Middle (Ramsey), and Chilco Channel areas (D−D’) are shown on plate 2.
To date (2004), the only aquifer-wide digital representation of the aquifer extent and bottom was prepared by Buchanan (2000), as input for a ground-water flow model of the SVRP aquifer system. His map of estimated bottom elevations of the aquifer’s bedrock base was based in part on seismic reflection profiling done in the 1990s (Buchanan, 2000). Although Buchanan’s work provides an aquifer-wide gross estimate of aquifer bottom, refinements are needed to better determine depth to bedrock, as well as determine the depth to the aquifer base where the aquifer is underlain by fine-grained unconsolidated material rather than consolidated bedrock.
In Washington, Poelstra and others (2005) have developed a preliminary, and as yet unreleased, three-dimensional digital geologic model for the Washington part of the SVRP aquifer system based on surface geology maps, geologic and geophysical cross sections, and well logs. Originally developed to evaluate the ground-motion amplification effect of soft soils in the upper 100 ft of the soil-rock column (Palmer and others, 2004), this three-dimensional model was expanded to include the full thickness of these “soft soils” as represented by unconsolidated deposits overlying bedrock. The preliminary model is composed of three separate unconsolidated units based on the dominant grain texture including gravel, sand, and silt-clay (S. Palmer, Washington Department of Natural Resources, written commun, February 2005). The gravel unit corresponds to SVRP’s major water productive section, as exhibited in the eastern part of the Spokane Valley. The sand unit consists of significantly thick slackwater flood deposits, typified by the thick accumulation exposed at the surface in the Hillyard Trough. The silt-clay unit corresponds to subsurface occurrences of Glacial Lake Columbia sediments present only in the subsurface in the Hillyard Trough and in the Little Spokane River drainage (S. Palmer, Washington Department of Natural Resources, written commun, February 2005).
A number of investigators have estimated hydraulic properties of the SVRP aquifer, including specific yield, hydraulic conductivity, and transmissivity. Hydraulic conductivity values for most of the central SVRP aquifer generally are large. Currently (2004), the USGS has information available in the NWIS database for about 1,200 wells inventoried as part of previous studies of the SVRP aquifer and surrounding basin-fill aquifers (table 3).
[Summary statistics: From U.S. Geological Survey National Water Information System database. Abbreviation: <, less than]
| Altitude (feet above sea level) | Well depth (feet) | Water level (feet below land surface) | Yield (gallons per minute) | |
|---|---|---|---|---|
| Minimum | 1,540 | 7 | 2 | <2 |
| Maximum | 2,587 | 600 | 573 | 25,000 |
| Median | 2,053 | 162 | 106 | 500 |
Wells in the aquifer generally yield large volumes of water with relatively little drawdown. Wells in the saturated coarse-grained deposits can yield several thousand gallons per minute (Bolke and Vaccaro, 1979; Stone and others, 1996), with several wells near Spokane reportedly yielding over 5,000 gal/min. Reported yields for wells in the SVRP aquifer in the USGS database range from less than 2 to 25,000 gal/min with a median of 500 gal/min (table 3).
Although much of the SVRP aquifer is considered highly permeable, hydraulic characteristics are locally variable and include less-permeable, fine-grained sedimentary material. Several previous studies including Drost and Seitz (1978b), Bolke and Vaccaro (1981), and CH2M HILL (1998) have calculated aquifer characteristics based on aquifer tests and ground-water model simulations. Although hydraulic properties of the aquifer were variable, most results indicated that hydraulic conductivity (a measure of the ability of the aquifer material to transmit water) and transmissivity (the rate at which water is transmitted through a unit width of the aquifer under a unit hydraulic gradient, equal to the hydraulic conductivity multiplied by the aquifer thickness) values were on the upper end of values measured in the natural environment. Drost and Seitz (1978b) reported transmissivity values that ranged from less than 130,000 ft2/d in the western part of the aquifer to more than 13 million ft2/d near the Washington–Idaho state line. Estimated ground-water velocities exceeded 60 ft/d near the state line to about 47 ft/d in the Hillyard Trough (fig. 1). Bolke and Vaccaro (1981) estimated hydraulic conductivity values of between about 2,600 to 6,000 ft/d for most of the aquifer on the Washington side, with a value of about 860 ft/d in the less permeable Hillyard Trough area. CH2M HILL (1998) reported hydraulic conductivity values ranging from about 100 to 6,200 ft/d, with most values greater than 1,000 ft/d.
Vertical anisotropy is the ratio of horizontal hydraulic conductivity to vertical hydraulic conductivity. Bolke and Vaccaro (1981) stated the available data suggested no vertical stratification of the aquifer lithology, and therefore, no vertical anisotropy. Golder Associates, Inc. (2004) used an initial vertical anisotropy of 3:1. CH2M HILL (1998) assumed a vertical anisotropy of 10:1 that produced conservative (large) estimates of well capture zones.
Depth to ground water in the SVRP aquifer ranges from near land surface to more than 500 ft below land surface (Bolke and Vaccaro, 1979; Berenbrock and others, 1995; Briar and others, 1996; Stone and others, 1996; MacInnis and others, 2000). The greatest depth to ground water occurs in the northern Rathdrum Prairie in Idaho and the shallowest depth (less than 50 ft in places) is near Spokane along the Spokane River. Water levels measured in wells and recorded in the USGS database (2004) range from 2- to 573-ft deep with a median depth of 106 ft (table 3). Seasonal water-level fluctuations in the aquifer generally are less than 15 ft in most areas (Drost and Seitz, 1978b).
The water table in the SVRP aquifer generally reflects the land-surface topography and slopes from Hoodoo Valley and Lake Pend Oreille, Idaho, to Nine Mile Falls, Washington. Ground water generally flows in a southward direction from the area near the southern end of Lake Pend Oreille with a water-level altitude of about 2,150 ft, towards the city of Coeur d’Alene, and then westward towards the city of Spokane with an altitude of about 1,500 ft near the Little Spokane River (Drost and Seitz, 1978b; Molenaar, 1988; and MacInnis and others, 2000). The water table in the northeastern-most part of the aquifer slopes about 20 ft/mi, while the major part, from north of Round Mountain, Idaho, to the southern end of the Hillyard Trough, Washington, slopes gently from 2 to 10 ft/mi (Drost and Seitz, 1978b). Steeper slopes, sometimes more than 60 ft/mi, are in the Hillyard and Trinity Trough areas and along the Spokane River west of Five Mile Prairie. Generalized ground-water flow directions based on water-level elevations measured in the aquifer are shown in figure 5.
SVRP aquifer upstream margins include the southern parts of the Hoodoo and Spirit Valleys and Careywood in southern Bonner County, Idaho, in addition to the outlet at the southern end of Lake Pend Oreille (pl. 2). In the Cocolalla Valley, a ground-water divide is reported near Careywood along U.S. Highway 95 (Parliman and others, 1980). Ground water north of the divide flows northeast toward the Pend Oreille River; ground water south of the divide flows southwest toward Athol and the main body of the SVRP aquifer. In the Hoodoo Valley, historical water-level elevations indicated that a water-table divide was between Edgemere and Harlem (Walker, 1964). Ground water north of the divide moved northward toward the Pend Oreille River; ground water south of the divide moved southward toward Athol. In Spirit Valley, the ground-water divide was near Blanchard Lake (Parliman and others, 1980). West of the divide, ground water flows northwestward toward the Pend Oreille River; east of the divide, ground water flows southeastward into the main body of the SVRP aquifer.
Hammond (1974) reported that ground-water flow can be variable between Lake Pend Oreille and Athol. When the lake level declines below the adjacent water table an apparent ground-water mound (divide) is formed near Farragut State Park (Hammond, 1974). At such times, ground water can flow toward the lake from a distance of at least one-third of a mile and possibly farther (Hammond, 1974).
Most ground water from the SVRP aquifer discharges either to the Spokane and Little Spokane Rivers or is withdrawn by wells (Drost and Seitz, 1978b; Molenaar, 1988). An unknown amount of ground water may leave the system from the lower part of the aquifer in the Hillyard Trough and Little Spokane River area near Long Lake. Recharge occurs by infiltration of precipitation, snowmelt, irrigation water, subsurface inflow from adjoining highlands and tributary valleys, and leakage from adjacent and overlying surface-water sources (Molenaar, 1988). Several investigations reported that the Spokane River varies from losing to gaining along its course as it flows over the SVRP aquifer (Gearhart and Buchanan, 2000; Marti and Garrigues, 2001; and Caldwell and Bowers, 2003).
In 2004, an observation network was established by the USGS to measure water levels within the SVRP aquifer and adjacent hydrogeologic units. A monthly network of 47 wells was established in June 2004 to manually measure depth to water in wells throughout the aquifer. In July 2004, an eight-well network was established where depth to water is recorded hourly. As of 2005, both monthly and recorder networks are ongoing. During one week in September 2004, the depth to water was measured in 268 wells to develop a water-table map of the SVRP aquifer. Wells were visited by personnel from IDWR, WADOE, and USGS. The well locations in the observation networks and wells measured in September 2004 are shown on plate 1. The September 2004 water-table map and the supporting data are reported in Campbell (2005).
In addition to water-level data collected by USGS, water-level data are available from other sources for hundreds of wells throughout the SVRP aquifer. These data are available from several local and State government agencies, colleges and universities, water purveyors, and environmental consulting firms. Wells with multiple water-level measurements and measurement frequencies ranging from every 15 minutes (continuous recorders) to every few months are available for more than 100 wells. City and county government agencies have collected water levels as part of several programs including landfill monitoring, ground-water/ surface-water interaction studies, and wellhead protection. Water-level data from statewide monitoring well networks and local investigations are available from State agencies like IDWR and WADOE. Universities and colleges have collected water-level data as part of graduate thesis studies, class projects, and projects conducted by faculty members. Several water purveyors have been proactive in monitoring water levels in public water-supply and monitoring wells: some purveyors have collected over twenty years of data. Environmental consulting firms have collected water-level data from parts of the SVRP aquifer for several studies
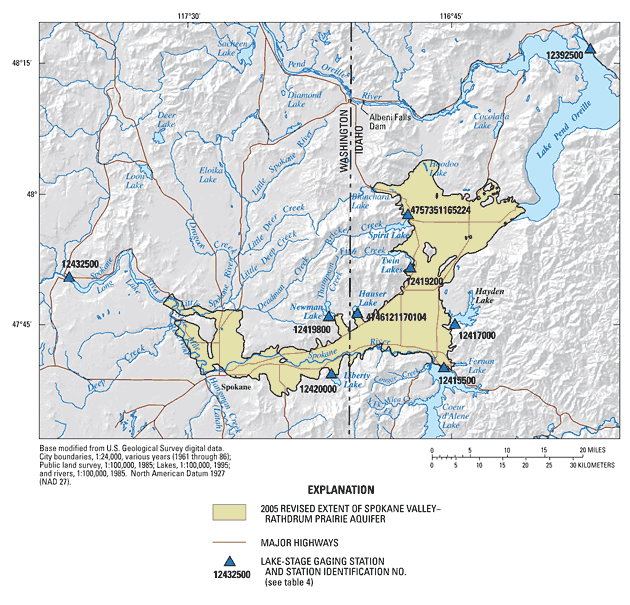
Lake stage data collection has been continuous at Coeur d’Alene, Hayden, and Pend Oreille Lakes, Idaho, and Long Lake, Washington, since the early 1900s (table 4, fig. 6). Historical data are available for Twin Lakes, Idaho, and Newman and Liberty Lakes, Washington, from the 1950s to the late 1960s or 1980s (table 4, fig. 6). As part of this study, gaging stations were re-established at Liberty and Newman Lakes, Washington, in August 2004, and at Twin Lakes, Idaho, in October, 2004. Also, in October 2004, gaging stations were established at Spirit and Hauser Lakes, Idaho, where no gaging stations were located previously. Currently (2005), USGS is making monthly lake stage measurements at Spirit, Twin, Hayden, and Hauser Lakes, Idaho, and Newman and Liberty Lakes, Washington. Hourly measurements are recorded at long-term measurement sites at Lakes Coeur d’Alene (USGS) and Pend Oreille (U.S. Army Corps of Engineers), Idaho and Long Lake (Avista Corporation), Washington. Liberty Lake Sewer and Water District began monitoring lake stage of Liberty Lake, Washington, January 1, 2004 (Liberty Lake Sewer and Water District, accessed June 1, 2005, http://207.88.115.227/libertylakemonitoring/liberty_lake.htm).
[Locations of stations are shown on figure 6. Period of record: At the time of publication of this report, the period of record is expected to continue beyond 2005 at each of these sites. Abbreviations: ID, Idaho; WA, Washington; USGS, U.S. Geological Survey]
| Gaging station name | USGS gaging station No. | Period of record | Measurements (2005) | |
|---|---|---|---|---|
| Frequency | Method | |||
| Lake Pend Oreille near Hope, ID | 12392500 | 1914–2005 | Hourly | Recorder |
| Spirit Lake at Spirit Lake, ID | 4757351165224 | 2004–05 | Monthly | Temporary gage |
| Twin Lakes near Rathdrum, ID | 12419200 | 1958–68, 2004–05 | Monthly | Staff gage |
| Hayden Lake at Hayden Lake, ID | 12417000 | 1920–2005 | Monthly | Staff gage |
| Coeur d’Alene Lake at Coeur d’Alene, ID | 12415500 | 1903–2005 | Hourly | Recorder |
| Hauser Lake at Hauser, ID | 4746121170104 | 2004–05 | Monthly | Temporary gage |
| Newman Lake near Newman Lake, WA | 12419800 | 1958–80, 2004–05 | Monthly | Staff gage |
| Liberty Lake at Liberty Lake, WA | 12420000 | 1950–89, 2004–05 | Monthly | Staff gage |
| Long Lake at Long Lake, WA | 12432500 | 1913–2005 | Hourly | Recorder |
In most places, the Spokane Valley–Rathdrum Prairie aquifer is bounded laterally by bedrock and the lower or bottom aquifer boundary is mostly unknown except along the margins or in shallower parts of the aquifer where wells have penetrated the entire aquifer thickness and reached bedrock or silt and clay deposits. Reported ground-water divides approximately represent the aquifer boundary in the Hoodoo and Spirit Valleys and near Careywood, Idaho (Walker, 1964 and Parliman and others, 1980). Upgradient aquifer areas also are bounded by tributary lakes, including Pend Oreille, Spirit, Twin, Hayden, Coeur d’Alene, Hauser, Newman, and Liberty. Streams tributary to the aquifer include Lewellen, Sage, and Rathdrum Creeks in Idaho, and Chester and Saltese Creeks in Washington. Streams tributary to the Spokane River in the aquifer extent include Hangman (Latah) Creek near Spokane, Washington, and the Little Spokane River north of Spokane. The aquifer’s lower discharge area is near Long Lake at the confluence of the Spokane and Little Spokane Rivers.
A water budget is an accounting of water and its movement in a hydrologic system. Water budgets can be as simple as a few numbers representing water added to and subtracted from the hydrologic system, or as complex as a numerical simulation of the hydrologic system. This hydrologic system can range in scale from global to site specific and could include only ground water, only surface water, or both. A water budget is a useful tool for helping water-resource scientists and managers conceptualize the hydrologic system. Because some of the inflows and outflows from the system cannot be measured directly, however, they must be estimated. Therefore, the resulting water budget is an approximation of the physical hydrologic system, and the measured inflow and outflow totals may not balance exactly.
Several investigators have compiled complete water budgets for large parts of the SVRP aquifer (table 5). These water budgets are not directly comparable because most studies have used different boundaries for the SVRP aquifer. More than 25 publications have addressed aspects of the water budget for the SVRP aquifer using different techniques. Water-budget component estimates from previous studies are summarized in tables 6 through 13.
Because of the long history of water development in the study area and the obscure nature of many reports on water-resource issues, numerous discrepancies exist between various reports. These discrepancies likely are due to the unavailability of original reports, resulting in investigators citing data referenced in subsequent reports. This potential source of error, compounded with misunderstandings and typographic mistakes, likely caused reported values to “drift” from the original. For this report, original sources were reviewed in nearly all cases; however, some documents were unavailable. These references are identified in the tables 6 through 13. How a particular value was obtained is not always known, but where possible, methods used by various investigators for their estimates have been identified. Finally, different investigators have defined or grouped measurement areas differently and estimates should be compared with caution. This report is intended as a review—the interested reader is urged to check original sources.
Water enters an aquifer by many processes and settings and these processes and settings can be classified in numerous ways. In this report, recharge is discussed by the setting in which it occurs. Three main settings in which water enters the SVRP aquifer are: the valley floor over the aquifer, tributary basins, and adjacent uplands surrounding the aquifer, and the Spokane River itself (which also acts as a discharge setting in some reaches). Some investigators have included total recharge estimates to the aquifer without differentiating the source. These estimates are included in table 5.
Table 5. Published water budgets for the Spokane Valley–Rathdrum Prairie aquifer.
[Method: M, ground-water-flow model; R, referenced; SM, streamflow measurements; W, water balance; WY, watershed yield. Abbreviations: ft3/s, cubic foot per second; –, not applicable or unknown]
| Area | Estimated total recharge/discharge (ft3/s) |
Period calculated | Primary method | Reference |
|---|---|---|---|---|
| Aquifer above Spokane | 1,21,200 | 1959 | R, SM, WY | Thomas (1963) |
| 1,21,100 | 1951–59 | R, SM, WY | Thomas (1963) | |
| 1,2939 | 1951–54 | – | Bureau of Reclamation (1963)3 | |
| Aquifer above Otis Orchards | 11,000 | 1911–60 | SM, WY | Pluhowski and Thomas (1968) |
| 11,000 | 1911–60 | SM, WY | Pluhowski (1970) | |
| Approximate sole-source aquifer boundary | 1,320/1,320 | Average conditions | R | Drost and Seitz (1978b) |
| Report model area | 1,010 | May 1977–Apr. 1978 | M4 | Bolke and Vaccaro (1981) |
| 1,030 | May 1977–Apr. 1978 | M5 | Bolke and Vaccaro (1981) | |
| Aquifer, Idaho portion | 1753 | Average conditions | R, W, WY | Painter (1991) |
| Report model area | 692/692 | Fall 19944 | M | CH2M HILL (1998) |
| 730/730 | Spring 19954 | M | CH2M HILL (1998) | |
| 652/652 | Fall 19944 | M | CH2M HILL (2000a) | |
| 397/397 | Steady state conditions4 | M | Buchanan (2000) |
1 Recharge only.
2 Does not include Lake Pend Oreille.
3 From Frink (1964).
4 Steady state.
5 Transient.
The main source of recharge to ground water from the valley floor is infiltration from land surface: precipitation, applied irrigation water, canal-seepage loss, and septic-tank effluent. However, water loss to evapotranspiration decreases the amount of precipitation and irrigation water that reaches the saturated zone.
Direct recharge from precipitation on the valley floor was recognized early as a significant component of SVRP water budgets due to the scarcity of streams that reach the Spokane River. Recharge estimates from precipitation are more straightforward than many other water-budget components; however, previous estimates still range over an order of magnitude (table 6), partly due to differences in how areas are delineated—some investigators included the entire watershed while others included only the valley floor. Also, some investigators factored evapotranspiration losses directly into their recharge estimates while others subtracted evapotranspiration as a separate item.
A facet of precipitation recharge is the presence of numerous storm-water injection, or dry wells in the study area. These drain wells allow local disposal of storm water eliminating the need for extensive storm-water sewerage. Due to the long-standing use of these dry wells, it is unclear exactly how many exist, though McLeod (1991) reported about 2,500 in the “Panhandle area around Coeur d’Alene.” Golder Associates, Inc. (2004) used Spokane County GIS coverages for the location of these wells and calculated that they recharge 83-87 percent of precipitation in the capture zone of the well and modeled them explicitly with a density of as many as 87 wells per square mile.
Many early studies of the SVRP aquifer were related to irrigation projects, consequently several estimates have been made of irrigation seepage and canal leakage. These irrigation-related components are summarized in table 6.
Recharge from septic-system effluent was not included explicitly as a component in SVRP aquifer water budgets until around the advent of numerical simulation. This probably corresponds to rapid population growth and explains why previous investigators may not have considered it significant. Septic-system effluent recharge estimates are shown in table 6.
Previous SVRP aquifer water budgets indicate that recharge from lakes and streams in tributary basins and adjacent uplands are the largest source of water to the SVRP aquifer. Traditionally, the quantity of such recharge has been difficult to measure and often has been calculated indirectly through water-budget or modeling methods.
Because of the SVRP aquifer’s physical setting, many investigators have believed that Coeur d’Alene Lake and Lake Pend Oreille are among the largest sources of recharge to the aquifer. Consequently, much effort has gone into quantifying recharge contribution by these and other lakes using methods ranging from simple watershed-yield estimates to numerical simulation (table 7). Note that some estimates for a given lake may range over several orders of magnitude.
Tributary basins without major lakes and adjacent uplands, while individually small, collectively contribute a significant quantity of recharge to the SVRP aquifer (table 8). However, they have received less attention than other water-budget components possibly because quantifying such recharge is difficult or because study areas differ. Previous seepage estimate studies primarily used watershed-yield, streamflow measurement, or numerical simulation methods and are shown in table 8. Some estimates range over an order of magnitude. Of special interest is possible underflow from the Hoodoo Valley into the SVRP aquifer. Though surface-water drainage is to the north, several investigators suggested that ground water flows south, aided by the increased head of water behind Albeni Falls dam.
Underflow into the SVRP aquifer cannot be directly measured; therefore, these estimates tend to be the residual of other water-budget components in ground-water-flow models. Table 9 shows underflow recharge estimates by previous investigators.
The direction and amount of water flowing between the Spokane River and the SVRP aquifer is one of the most important hydrologic issues in the study area. Not only do the volume and direction of flow between surface and ground water affect the amount of water in the river, they affect the volume of ground water available in the aquifer. Numerous studies have examined this interaction with a variety of techniques over different river reaches and have defined gaining (the river gains flow from ground-water discharge) and losing (the river loses flow to ground-water recharge). These often conflicting numbers result from different reach definition, seasonal and yearly precipitation variance, development in the study area, and study method. For instance, most investigators for most time periods have concluded that the Spokane River between Post Falls and Nine Mile Falls gains water from the aquifer, though shorter reaches lose water to the aquifer. Various estimates by previous investigators are shown in table 10 and are discussed in more detail in the Ground-Water/Surface-Water Interactions section.
[Recharge or discharge: Negative values indicate discharge from the aquifer. Method: C, calculated; D, Darcy’s Law; M, ground-water-flow model; MO, meteorological observations; R, referenced; SM, streamflow measurements; W, water balance; WY, watershed yield. Abbreviations: WRIA, Water Resource Inventory Area; ID, Idaho; WA, Washington; ft3/s, cubic foot per second; –, not applicable or unknown]
| Type of recharge or discharge | Recharge to aquifer (ft3/s) |
Period calculated |
Method | Reference |
|---|---|---|---|---|
| All recharge | 1,000 | 1928–38 | D | Piper and La Rocque (1944) |
| 1,000 | – | R | Piper and Huff (1943) | |
| 1,200 | 1959 | WB | Thomas (1963) | |
| 1,100 | 1951–59 | WB | Thomas (1963) | |
| 1,105 | – | – | Bureau of Reclamation (1966) | |
| 1,320 | Average conditions | – | Drost and Seitz (1978b) | |
| All recharge-WA | 384 | 1951–54 | – | Bureau of Reclamation (1963)5 |
| All recharge-ID except Lake Pend Oreille | 550 | 1951–54 | – | Bureau of Reclamation (1963)4 |
| All recharge except Lake Pend Oreille | 939 | 1951–54 | – | Bureau of Reclamation (1963)4 |
| All recharge except Lake Pend Oreille, Coeur d’Alene Lake, and Spokane River | 260–670 | Average year | – | Meneely (1951)5 |
| 40–390 | Dry year | – | Meneely (1951)5 | |
| 260–670 | Average year | R | Bureau of Reclamation (1956) | |
| 40–390 | Dry year | R | Bureau of Reclamation (1956) | |
| Precipitation, ID | 132 | 1959 | MO | Thomas (1963) |
| 130 | Average conditions | R | Drost and Seitz (1978b) | |
| 250 | – | W | Painter (1991) | |
| Precipitation, WA valley floor | 63 | 1959 | – | Thomas (1963) |
| Precipitation, WA | 50 | 1951–54 | – | Bureau of Reclamation (1963)5 |
| Precipitation, lowlands | 120 | – | WY | Piper and Huff (1943) |
| 381 | Average conditions | C | Nace and others (1970) | |
| Precipitation, uplands | 45 | – | WY | Piper and Huff (1943) |
| Precipitation, total | 165 | 1950 | R | Anderson (1951) |
| 250 | 1951–54 | R | Frink (1964) | |
| 50 | – | WY | Pluhowski and Thomas (1968) | |
| 530 | – | R | Pluhowski (1970) | |
| 1209 | May 1977–April 1978 | MO | Bolke and Vaccaro (1981) | |
| 2216 | May 1977–April 1978 | MO | Bolke and Vaccaro (1981) | |
| Precipitation | 125 | Steady state conditions | M | Buchanan (2000) |
| 25 | Fall 1994 | M | CH2M HILL (1998) | |
| 52 | Spring 1995 | M | CH2M HILL (1998) | |
| 25 | Fall 1994 | M | CH2M HILL (2000a) | |
| Precipitation–evapotranspiration lowlands | 156 | Average conditions | C | Nace and others (1970) |
| Precipitation and runoff-total | 770 | 1959 | – | Thomas (1963) |
| 640 | 1951–59 | – | Thomas (1963) | |
| Irrigation seepage, WA | 28 | 1950 | R | Anderson (1951) |
| 66 | May–Aug. | W | McDonald and Broom (1951) | |
| 54 | 1951–54 | – | Bureau of Reclamation (1963)5 | |
| Irrigation seepage-total | 113 | 1952 | C | Nace and others (1970) |
| Irrigation seepage (includes canals) | 55 | 1951–59 | – | Thomas (1963) |
| 56 | 1959 | – | Thomas (1963) | |
| Irrigation seepage | 280 | 1951–54 | R | Frink (1964) |
| 50 | – | WY | Pluhowski and Thomas (1968) | |
| 50 | – | R | Pluhowski (1970) | |
| Irrigation seepage, from surface water | 90 | 1952 | C | Nace and others (1970) |
| Irrigation seepage, from ground water | 23 | 1952 | C | Nace and others (1970) |
| Irrigation seepage, agriculture, 3,360 acres | 78 | Average conditions | C | Golder Associates, Inc. (2004) |
| Irrigation seepage, lawns, 15,260 acres | 8 | Average conditions | C | Golder Associates, Inc. (2004) |
| Canal Loss: Main Canal, Post Falls to State Line | 8 | 1953 | C | Bureau of Reclamation (1956) |
| Canal Loss: North Branch Canal, State Line to Pasadena Park | 10 | 1953 | C | Bureau of Reclamation (1956) |
| Canal Loss: South Branch Canal, State Line to Liberty Lake Road | 3 | 1953 | C | Bureau of Reclamation (1956) |
| Canal Loss: Liberty Lake Chute Outlet to Greenacres | 2 | 1953 | C | Bureau of Reclamation (1956) |
| Canal Loss: High lateral, Liberty Lake Chute Outlet to south of Greenacres | 1 | 1953 | C | Bureau of Reclamation (1956) |
| Land-applied water (from ground water) | 11 | Fall 1994 | C | CH2M HILL (1998) |
| 2 | Spring 1995 | C | CH2M HILL (1998) | |
| 11 | Fall 1994 | C | CH2M HILL (2000a) | |
| 199 | May 1977–Apr. 1978 | C | Bolke and Vaccaro (1981) | |
| 2108 | May 1977–Apr. 1978 | C | Bolke and Vaccaro (1981) | |
| 50 percent of pumpage from Spokane seasonal wells | 1977 | R | Bolke and Vaccaro (1981) | |
| 10 percent of pumpage from Spokane continuous wells | 1977 | R | Bolke and Vaccaro (1981) | |
| 100 percent of pumpage from non-Spokane wells | 1977 | R | Bolke and Vaccaro (1981) | |
| 100 percent of pumpage from irrigation wells | 1977 | R | Bolke and Vaccaro (1981) | |
| 0 percent of pumpage from industrial wells | 1977 | R | Bolke and Vaccaro (1981) | |
| Septic systems | 34 | Average conditions | R | Drost and Seitz (1978b) |
| 29 | 1976 | R | Drost and Seitz (1978b) | |
| 1,235 | May 1977–Apr. 1978 | – | Bolke and Vaccaro (1981) | |
| 16 | Fall 1994 | C | CH2M HILL (1998) | |
| 16 | Spring 1995 | C | CH2M HILL (1998) | |
| 16 | Fall 1994 | C | CH2M HILL (2000a) | |
| Evapotranspiration, lowlands | -225 | Average conditions | C | McQueen (1970) |
| Evapotranspiration | No direct | Average conditions | R | Drost and Seitz (1978b) |
| 1-143 | May 1977–Apr. 1978 | C | Bolke and Vaccaro (1981) | |
| 2-98 | May 1977–Apr. 1978 | C | Bolke and Vaccaro (1981) | |
| Evapotranspiration, WRIA 55 | -972 | Average conditions | C | Golder Associates, Inc. (2004) |
| Evapotranspiration, WRIA 57 | -307 | Average conditions | C | Golder Associates, Inc. (2004) |
| Consumptive crop use, WA | -33 | May–August | W | McDonald and Broom (1951) |
| Land-surface infiltration, Rathdrum Prairie Valley | 342–276 | 1950 | Lenz, 1950 | |
| 530 | 1911-60 | W | Pluhowski and Thomas (1968) |
1 Steady-state.
2 Transient.
3 Range of monthly averages.
4 From Frink (1964).
5 From Anderson (1951).
Table 7. Estimates of seepage from lakes into the Spokane Valley–Rathdrum Prairie aquifer.
[Method: D, Darcy’s Law; M, ground-water-flow model; R, referenced; W, water balance; WY, watershed yield. Abbreviations: ft3/s, cubic foot per second; ≥, greater than or equal; ≤, less than or equal; –, not applicable or unknown]
| Lake | Recharge to aquifer (ft3/s) |
Period calculated |
Method | Reference |
|---|---|---|---|---|
| Coeur d’Alene Lake | 300 | 1950 | R | Anderson (1951) |
| 300 | 1951–54 | – | Bureau of Reclamation (1963)1 | |
| 250 | Average conditions | R | Drost and Seitz (1978b) | |
| 35 | Steady state conditions | M | Buchanan (2000) | |
| Coeur d’Alene Lake and Spokane River–Post Falls gaging station | ≤300 | – | R | Bureau of Reclamation (1956) |
| 140 | 1959 | W | Thomas (1963) | |
| 170 | July 1959 | W | Thomas (1963) | |
| 120 | August 1959 | W | Thomas (1963) | |
| 270 | October 1959 | W | Thomas (1963) | |
| 250 | 1911–60 | W | Pluhowski and Thomas (1968) | |
| Coeur d’Alene Lake and Spokane River–Post Falls | 380 | – | W | McQueen and Nace (1970) |
| 225 | – | D | Sagstad (1977) | |
| 230 | – | R | Painter (1991) | |
| Hauser Lake | 37 | 1959 | W | Thomas (1963) |
| 37 | Average conditions | R | Drost and Seitz (1978b) | |
| 8.2 | – | Entranco Engineering (1990)5 | ||
| 8.2 | – | R | Painter (1991) | |
| 2.5 | Steady state conditions | M | Buchanan (2000) | |
| Hayden Lake | 50 | – | – | Meneely (1951)2 |
| 50 | 1951–54 | – | Bureau of Reclamation (1963)1 | |
| 100 | 1959 | W | Thomas (1963) | |
| 80 | 1951–59 | W | Thomas (1963) | |
| 100 | W | McQueen and Nace (1970) | ||
| 80 | Average conditions | R | Drost and Seitz (1978b) | |
| 37.8 | WY | Painter (1991) | ||
| 27 | Steady state conditions | M | Buchanan (2000) | |
| Liberty Lake | 16 | 1959 | W | Thomas (1963) |
| 16 | Average conditions | R | Drost and Seitz (1978b) | |
| Newman Lake drainage | 65 | 1959 | W | Thomas (1963) |
| Newman Lake | 65 | Average conditions | R | Drost and Seitz (1978b) |
| Lake Pend Oreille | 50–200 | 1911–60 | W | Pluhowski and Thomas (1968) |
| 201–309 | – | – | Simons and others (1953)3 | |
| ≥1,000 | Natural conditions | W | Piper and Huff (1943) | |
| “Several hundred” | 1950 | R | Anderson (1951) | |
| “Insignificant” | – | W | Thomas (1963) | |
| “Major source” | 1951–54 | – | Bureau of Reclamation (1956) | |
| 20–60 | – | D | Frink (1964) | |
| 50 | – | W | McQueen and Nace (1970) | |
| 46 | – | – | Hammond (1974) | |
| 20–50 | Average conditions | R | Drost and Seitz (1978b) | |
| 350 | – | R | Painter (1991) | |
| 61 | Steady state conditions | M | Buchanan (2000) | |
| Spirit Lake watershed | 98 | 1959 | W | Thomas (1963) |
| 93 | – | – | Hammond (1974) | |
| 100 | Average conditions | R | Drost and Seitz (1978b) | |
| 22 | – | W | Soltero and Hall (1985) | |
| 22 | – | W | Bellatty (1987)4 | |
| Spirit Lake | 22.3 | – | R | Painter (1991) |
| 13 | – | M | Buchanan (2000) | |
| Twin Lakes basin | 86 | – | W | Thomas (1963) |
| Twin Lakes | 85 | Average conditions | R | Drost and Seitz (1978b) |
| 25 | – | R | Painter (1991b) | |
| 25 | – | – | Falter and Hallock (1987)4 | |
| 6 | Steady state conditions | M | Buchanan (2000) |
1 From Frink (1964).
2 From Anderson (1951).
3 From Hammond (1974).
4 From Painter (1991).
[Method: M, ground-water-flow model; R, referenced; SM, streamflow measurements; WY, watershed yield. Abbreviations: ft3/s, cubic foot per second; –, not applicable or unknown]
| Source area | Recharge to aquifer (ft3/s) |
Period calculated |
Method | Reference |
|---|---|---|---|---|
| Bayview/Kelso drainage | 14.8 | – | WY | Painter (1991b) |
| Blanchard drainage | 89 | 1959 | SM | Thomas (1963) |
| 62.2 | – | WY | Painter (1991) | |
| 3 | Steady state conditions | M | Buchanan (2000) | |
| Blanchard Creek and Spirit Valley | 77 | – | – | Hammond (1974) |
| Cable Creek | 11 | 1959 | SM | Thomas (1963) |
| 11 | Average conditions | R | Drost and Seitz (1978b) | |
| Canfield drainage area | 11 | 1959 | SM | Thomas (1963) |
| Canfield drainage | 11 | Average conditions | R | Drost and Seitz (1978b) |
| 4.6 | – | WY | Painter (1991) | |
| Coulee Creek | 5 | – | R | Drost and Seitz (1978b) |
| Chilco Channel area | 43 | 1959 | SM | Thomas (1963) |
| 40 | Average conditions | R | Drost and Seitz (1978b) | |
| Chilco Channel | 40.6 | – | WY | Painter (1991) |
| 4 | Steady state conditions | M | Buchanan (2000) | |
| Deep Creek | 2 | Average conditions | R | Drost and Seitz (1978b) |
| Dishman Hills | 31 | 1959 | SM | Thomas (1963) |
| 31 | Average conditions | R | Drost and Seitz (1978b) | |
| Hangman (Latah) Creek | 15 | Average conditions | R | Drost and Seitz (1978b) |
| Hidden Valley area | 30 | 1959 | SM | Thomas (1963) |
| 30 | Average conditions | R | Drost and Seitz (1978b) | |
| Hidden Valley | 7.3 | – | WY | Painter (1991) |
| Hoodoo Valley | 90 | Average conditions | R | Drost and Seitz (1978b) |
| Indian Canyon | 2 | Average conditions | R | Drost and Seitz (1978b) |
| Uplands: Indian Canyon–Deep Creek | 2 | Average conditions | R | Drost and Seitz (1978b) |
| Uplands: Orchard Prairie area | 5 | Average conditions | R | Drost and Seitz (1978b) |
| Uplands: Peone Prairie area | 18 | Average conditions | R | Drost and Seitz (1978b) |
| Uplands: Pleasant Prairie area | 9 | 1959 | SM | Thomas (1963) |
| 9 | Average conditions | R | Drost and Seitz (1978b) | |
| Uplands: Saltese Flats area | 24 | 1959 | SM | Thomas (1963) |
| 24 | Average conditions | R | Drost and Seitz (1978b) | |
| Uplands: Scalan Creek area | 13 | 1959 | SM | Thomas (1963) |
| 13 | Average conditions | R | Drost and Seitz (1978b) |
[Recharge: Negative values indicate discharge from the aquifer. Method: M, ground-water-flow model; R, referenced. Abbreviation: ft3/s cubic foot per second]
| Inflow and outflow | Recharge to aquifer (ft3/s) |
Period calculated |
Method | Reference |
|---|---|---|---|---|
| Subsurface inflow, north, east, south model boundaries | 6681 | May 1977–Apr. 1978 | M1 | Bolke and Vaccaro (1981) |
| 6562 | May 1977–Apr. 1978 | M2 | Bolke and Vaccaro (1981) | |
| Subsurface outflow, west model boundary | -105 | May 1977–Apr. 1978 | M1 | Bolke and Vaccaro (1981) |
| -102 | May 1977–Apr. 1978 | M2 | Bolke and Vaccaro (1981) | |
| Ground-water outflow at Nine Mile Dam | 0 | Fall 1994 | M | CH2M HILL (1998) |
| 0 | Spring 1995 | M | CH2M HILL (1998) | |
| -55 | Average conditions | R | Drost and Seitz (1978b) | |
| 0 | Fall 1994 | M | CH2M HILL (2000a) | |
| 0 | Average conditions | M | Golder Associates, Inc. (2004) |
1 Steady-state.
2 Transient.
[Recharge: Negative values indicate discharge from the aquifer. Method: D, Darcy’s Law; M, ground-water-flow model; CM, chemical mass balance; R, referenced; SM, streamflow measurements. Abbreviations: RM, river mile; SIRTI, Spokane Intercollegiate Research and Technology Institute; WWTP, wastewater treatment plant; ft3/s, cubic foot per second; ≤, less than or equal; –, not applicable or unknown]
| Stream and reach | Recharge to aquifer (ft3/s) |
Period calculated |
Method | Reference |
|---|---|---|---|---|
| Spokane River | -282 | May 1977–Apr. 1978 | M1 | Bolke and Vaccaro (1981) |
| -338 | May 1977–Apr. 1978 | M2 | Bolke and Vaccaro (1981) | |
| 3-700–470 | May 1977–Apr. 1978 | M2 | Bolke and Vaccaro (1981) | |
| 120 | Steady state conditions | M | Buchanan (2000) | |
| Coeur d’Alene Lake to Post Falls gaging station | 120 | 1949–59 | R | Crosthwaite and others (1970) |
| ≤1,000 | – | R | Bureau of Reclamation (1956) | |
| Coeur d’Alene Lake to Sullivan Road | 9207 | – | CM | Miller (1996)5 |
| 6303 | – | CM | Miller (1996)5 | |
| 7319 | – | CM | Miller (1996)5 | |
| Coeur d’Alene Lake to 4 mi west of the State Line | 0 | – | SM | Piper and La Rocque (1944) |
| Post Falls to Otis Orchard gaging stations | 280 | 1951–54 | SM | Bureau of Reclamation (1956) |
| 150 | 1959 | SM | Thomas (1963) | |
| 180 | 1951–59 | SM | Thomas (1963) | |
| 120 | 1911–60 | W | Pluhowski and Thomas (1968) | |
| 88–1,130 | 1951–59 | SM | Crosthwaite and others (1970) | |
| 180 | 1951–59 | SM | Crosthwaite and others (1970) | |
| 969–810 | 1999–2001 | SM | Caldwell and Bowers (2003) | |
| 255 | 1999–2001 | SM | Caldwell and Bowers (2003) | |
| 1037–78 | 1929–83, 1999–2004 | SM | Hortness and Covert (2005) | |
| 177 | Sept. 2004 | SM | Hortness and Covert (2005) | |
| Post Falls to Greenacres gaging stations | 5.7 | Dec. 1948–Sept. 1949 | Anderson (1951) | |
| Minimal | 1947–50 | SM | McDonald and Broom (1951) | |
| 78 | Oct. 1948–Sept. 1950 | SM | Broom (1951) | |
| 11-529–757 | Oct. 1948–Sept. 1950 | SM | Broom (1951) | |
| 80 | Average conditions | R | Drost and Seitz (1978b) | |
| 50 | May 1977–Apr. 1978 | M1 | Bolke and Vaccaro (1981) | |
| 144 | July 1984–Sept. 1984 | SM | Patmount and others (1985) | |
| 9-42–770 | 1999–2001 | SM | Caldwell and Bowers (2003) | |
| 288 | 1999–2001 | SM | Caldwell and Bowers (2003) | |
| 292–919 | Annual range, 1994–99 | M | Golder Associates, Inc. (2004)12 | |
| 655 | Annual mean, 1994–99 | M | Golder Associates, Inc. (2004)12 | |
| 287 | Sept. 2004 | SM | Hortness and Covert (2005) | |
| Post Falls to Trent Bridge gaging stations | -357 | Dec. 1948–Sept. 1949 | SM | Anderson (1951) |
| Post Falls to Greene Street gaging stations | -807 | Dec. 1948–Sept. 1949 | SM | Anderson (1951) |
| Post Falls to Spokane gaging stations | -322– -1,383 | Dec. 1948–Mar. 1950 | SM | Lenz (1950) |
| -787 | Dec. 1948–Sept. 1949 | SM | Anderson (1951) | |
| -467 | 1920–48 | SM | Anderson (1951) | |
| 9-881– -77 | 1920–48 | SM | Anderson (1951) | |
| -753 | Oct. 1948–Sept. 1949 | SM | Anderson (1951) | |
| -467 | – | – | Bureau of Reclamation (1954) | |
| -460 | 1914–53 | SM | Bureau of Reclamation (1956) | |
| 268 | Sept. 12, 1994 | SM | CH2M HILL (1998) | |
| 153 | Sept. 13, 1994 | SM | CH2M HILL (1998) | |
| 103 | Sept. 14, 1994 | SM | CH2M HILL (1998) | |
| 43 | Sept. 15, 1994 | SM | CH2M HILL (1998) | |
| 103 | Apr. 9, 1995 | SM | CH2M HILL (1998) | |
| 3 | Apr. 10, 1995 | SM | CH2M HILL (1998) | |
| 3 | Apr. 11, 1995 | SM | CH2M HILL (1998) | |
| -247 | Apr. 12, 1995 | SM | CH2M HILL (1998) | |
| Post Falls gaging station to Seven Mile | -878 | Oct. 1948–Sept. 1949 | SM | Anderson (1951) |
| Post Falls gaging station to Nine Mile | -1,014 | Oct. 1948–Sept. 1949 | SM | Anderson (1951) |
| 224 | Sept. 12, 1994 | SM | CH2M HILL (1998) | |
| 29 | Sept. 13, 1994 | SM | CH2M HILL (1998) | |
| -104 | Sept. 14, 1994 | SM | CH2M HILL (1998) | |
| -39 | Sept. 15, 1994 | SM | CH2M HILL (1998) | |
| -1,080 | Apr. 09, 1995 | SM | CH2M HILL (1998) | |
| -1,207 | Apr. 10, 1995 | SM | CH2M HILL (1998) | |
| -1,099 | Apr. 11, 1995 | SM | CH2M HILL (1998) | |
| -1,381 | April 12, 1995 | SM | CH2M HILL (1998) | |
| Stateline to Barker Road | 45 | Fall 1994 | M | CH2M HILL (1998) |
| 71 | Spring 1995 | M | CH2M HILL (1998) | |
| 45 | Fall 1994 | M | CH2M HILL (2000a) | |
| 76–444 | – | D | Gearhart (2001) | |
| 142–660 | Aug. 20, 1998–July 6, 1999 | SM | Gearhart (2001) | |
| Stateline to Harvard Road | 168–591 | Annual range, 1994–99 | M | Golder Associates, Inc. (2004) |
| 406 | Annual mean, 1994–99 | M | Golder Associates, Inc. (2004) | |
| 4 mi west of State Line to a few miles below Spokane | -600– -800 | Late summer-fall | SM | Piper and La Rocque (1944) |
| Otis Orchard to Greenacres gaging stations | Minimal | 1951–59 | SM | Crosthwaite and others (1970) |
| Minimal | 1948–52, 1999–2004 | SM | Hortness and Covert (2005) | |
| Harvard Road to Barker Road | 28.7–137 | – | D | Gearhart (2001) |
| 5.7–16.6 | Annual range, 1994–99 | M | Golder (2004)13 | |
| 11.8 | Annual mean, 1994–99 | M | Golder (2004)13 | |
| Harvard Road to E. Trent Bridge | -404 | July 1984–Sept. 1984 | SM | Patmount and others (1985) |
| Greenacres to Trent Bridge gaging stations | -363 | Oct. 1948–Sept. 1949 | SM | Anderson (1951) |
| -370 | Oct. 1948–Sept. 1950 | SM | Broom (1951) | |
| 11-1,140– -39 | Oct. 1948–Sept. 1950 | SM | Broom (1951) | |
| -330 | Average conditions | R | Drost and Seitz (1978b) | |
| -240 | May 1977–Apr. 1978 | M1 | Bolke and Vaccaro (1981) | |
| 10-754– -330 | 1948–54 | SM | Hortness and Covert (2005) | |
| Greenacres to Greene Street gaging stations | -813 | Oct. 1948–Sept. 1949 | SM | Anderson (1951) |
| Greenacres to Spokane gaging stations | -793 | Oct. 1948–Sept. 1949 | SM | Anderson (1951) |
| ≤-1,500 | 1948–52 | SM | Bureau of Reclamation (1956) | |
| -720 | 1951–59 | SM | Crosthwaite and others (1970) | |
| 8-995– -576 | 1951 | SM | Crosthwaite and others (1970) | |
| -557 | Sept. 2004 | SM | Hortness and Covert (2005) | |
| Greenacres to Spokane gaging stations, Little Spokane River | -900 | – | R | Piper and Huff (1943) |
| Greenacres gaging station to Seven Mile | -885 | Oct. 1948–Sept. 1949 | SM | Anderson (1951) |
| Greenacres gaging station to Nine Mile | -1,021 | Oct. 1948–Sept. 1949 | SM | Anderson (1951) |
| Greenacres to Long Lake gaging stations | -1,286 | 1951 | SM | Crosthwaite and others (1970) |
| 8-1,009– -1,642 | 1951 | SM | Crosthwaite and others (1970) | |
| Greenacres gaging station to Sullivan Road | -273– -172 | Annual range, 1994–99 | M | Golder Associates, Inc. (2004)13 |
| -211 | Annual mean, 1994–99 | M | Golder Associates, Inc. (2004)13 | |
| -284– -202 | Annual range, 1994–99 | M | Golder Associates, Inc. (2004)12 | |
| -232 | Annual mean, 1994–99 | M | Golder Associates, Inc. (2004)12 | |
| Barker Road to Sullivan Road | 91 | Fall 1994 | M | CH2M HILL (1998) |
| 100 | Spring 1995 | M | CH2M HILL (1998) | |
| 75 | Fall 1994 | M | CH2M HILL (2000a) | |
| -241–423 | – | D | Gearhart (2001) | |
| Barker Road to Plante’s Ferry footbridge | -493– -110 | Aug. 20, 1998–July 6, 1999 | SM | Gearhart (2001) |
| Sullivan Road to Kaiser–Trentwood WWTP | 7 | Fall 1994 | M | CH2M HILL (1998) |
| 5 | Spring 1995 | M | CH2M HILL (1998) | |
| -1 | Fall 1994 | M | CH2M HILL (2000a) | |
| Sullivan Road to East Trent Bridge | -164–288 | – | D | Gearhart (2001) |
| -116– -82.3 | Annual range, 1994-99 | M | Golder Associates, Inc. (2004)13 | |
| -94.1 | Annual mean, 1994-99 | M | Golder Associates, Inc. (2004)13 | |
| Sullivan Road to Plante’s Ferry footbridge | -117– -81.2 | Annual range, 1994-99 | M | Golder Associates, Inc. (2004)12 |
| -93.6 | Annual mean, 1994-99 | M | Golder Associates, Inc. (2004)12 | |
| 9-206 | – | CM | Miller (1996)5 | |
| 6-315 | – | CM | Miller (1996)5 | |
| 7-160 | – | CM | Miller (1996)5 | |
| Kaiser–Trentwood WWTP to E. Trent Bridge | -22 | Fall 1994 | M | CH2M HILL (1998) |
| -64 | Spring 1995 | M | CH2M HILL (1998) | |
| -63 | Fall 1994 | M | CH2M HILL (2000a) | |
| East Trent Bridge to Plante’s Ferry footbridge | -1 | Fall 1994 | M | CH2M HILL (1998) |
| -12 | Spring 1995 | M | CH2M HILL (1998) | |
| -12 | Fall 1994 | M | CH2M HILL (2000a) | |
| -69–121 | – | D | Gearhart (2001) | |
| .0-.4 | Annual range, 1994-99 | M | Golder Associates, Inc. (2004)13 | |
| .1 | Annual mean, 1994-99 | M | Golder Associates, Inc. (2004)13 | |
| East Trent Bridge to Upriver Dam | 13.1–15.7 | Annual range, 1994-99 | M | Golder Associates, Inc. (2004)12 |
| 16.2 | Annual mean, 1994-99 | M | Golder Associates, Inc. (2004)12 | |
| East Trent Bridge to Greene Street | -321 | July 1984–Sept. 1984 | SM | Patmount and others (1985) |
| Trent Bridge gaging station to Upriver Dam | 40 | May 1977–Apr. 1978 | M1 | Bolke and Vaccaro (1981) |
| Trent Bridge gaging station to Greene Street gaging station | -273 | Oct. 1948–Sept. 1949 | SM | Anderson (1951) |
| -566 | Oct. 1948–Sept. 1950 | SM | Broom (1951) | |
| 11-1,650–12 | Oct. 1948–Sept. 1950 | SM | Broom (1951) | |
| 10447– -229 | 1949–52 | SM | Hortness and Covert (2005) | |
| Trent Bridge gaging station to Spokane gaging station | -430 | Oct. 1948–Sept. 1949 | SM | Anderson (1951) |
| -230 | – | R | Drost and Seitz (1978b) | |
| Trent Bridge gaging station to Seven Mile | -522 | Oct. 1948–Sept. 1949 | SM | Anderson (1951) |
| Trent Bridge gaging station to Nine Mile | -658 | Oct. 1948–Sept. 1949 | SM | Anderson (1951) |
| Plante’s Ferry footbridge to Argonne Road | 12 | Fall 1994 | M | CH2M HILL (1998) |
| 4 | Spring 1995 | M | CH2M HILL (1998) | |
| 11 | Fall 1994 | M | CH2M HILL (2000a) | |
| 2.8–3.9 | Annual range, 1994-99 | M | Golder Associates, Inc. (2004)13 | |
| 3.3 | Annual mean, 1994-99 | M | Golder Associates, Inc. (2004)13 | |
| Plante’s Ferry footbridge to Upriver Dam | Possible gain9 | – | CM | Miller (1996)5 |
| Indeterminate6 | – | CM | Miller (1996)5 | |
| Possible gain7 | – | CM | Miller (1996)5 | |
| Argonne Road to Upriver Dam | 6 | Fall 1994 | M | CH2M HILL (1998) |
| 4 | Spring 1995 | M | CH2M HILL (1998) | |
| 6 | Fall 1994 | M | CH2M HILL (2000a) | |
| 18.0–20.1 | Annual range, 1994–99 | M | Golder Associates, Inc. (2004)13 | |
| 19.1 | Annual mean, 1994–99 | M | Golder Associates, Inc. (2004)13 | |
| Upriver Dam to Upriver Drive (RM 79.1) | -102– -77.4 | Annual range, 1994–99 | M | Golder Associates, Inc. (2004)12 |
| -90.8 | Annual mean, 1994–99 | M | Golder Associates, Inc. (2004)12 | |
| Upriver Dam to Greene Street | -270 | May 1977-–Apr. 1978 | M1 | Bolke and Vaccaro (1981) |
| 9-209 | – | CM | Miller (1996)5 | |
| 6-264 | – | CM | Miller (1996)5 | |
| 7-377 | – | CM | Miller (1996)5 | |
| -149 | Fall 1994 | M | CH2M HILL (1998) | |
| -194 | Spring 1995 | M | CH2M HILL (1998) | |
| -174 | Fall 1994 | M | CH2M HILL (2000a) | |
| -82.3– -38.9 | Annual range, 1994–99 | M | Golder Associates, Inc. (2004)13 | |
| -66.8 | Annual mean, 1994–99 | M | Golder Associates, Inc. (2004)13 | |
| Upriver Drive (RM 79.1) to Greene Street | 19.4–43.2 | Annual range, 1994–99 | M | Golder Associates, Inc. (2004)12 |
| 29.8 | Annual mean, 1994–99 | M | Golder Associates, Inc. (2004)12 | |
| Greene Street to Mission Street | 38 | Fall 1994 | M | CH2M HILL (1998) |
| 32 | Spring 1995 | M | CH2M HILL (1998) | |
| 26 | Fall 1994 | M | CH2M HILL (2000a) | |
| 104–166 | Annual range, 1994–99 | M | Golder Associates, Inc. (2004)13 | |
| 132.9 | Annual mean, 1994–99 | M | Golder Associates, Inc. (2004)13 | |
| Greene Street to Upper Falls Dam | 200 | May 1977–Apr. 1978 | M1 | Bolke and Vaccaro (1981) |
| 142–224 | Annual range, 1994–99 | M | Golder Associates, Inc. (2004)12 | |
| 177.0 | Annual mean, 1994–99 | M | Golder Associates, Inc. (2004)12 | |
| Greene Street to Monroe Street | 9-63 | – | CM | Miller (1996)5 |
| 60 | – | CM | Miller (1996)5 | |
| 7-122 | – | CM | Miller (1996)5 | |
| Greene Street to Spokane gaging stations | 20 | Oct. 1948–Sept. 1949 | SM | Anderson (1951) |
| 39 | Oct. 1948–Sept. 1950 | SM | Broom (1951) | |
| 11-216–428 | Oct. 1948–Sept. 1950 | SM | Broom (1951) | |
| 75 | July 1984–Sept. 1984 | SM | Patmount and others (1985) | |
| Minimal | 1949–52 | SM | Hortness and Covert (2005) | |
| Greene Street to Seven Mile | -72 | Oct. 1948–Sept. 1949 | SM | Anderson (1951) |
| Greene Street to Nine Mile | -208 | Oct. 1948–Sept. 1949 | SM | Anderson (1951) |
| Mission Avenue to Trent Avenue Bridge at SIRTI | 22 | Fall 1994 | M | CH2M HILL (1998) |
| 9 | Spring 1995 | M | CH2M HILL (1998) | |
| 11 | Fall 1994 | M | CH2M HILL (2000a) | |
| Trent Avenue Bridge at SIRTI to Monroe Street | 15 | Fall 1994 | M | CH2M HILL (1998) |
| 1 | Spring 1995 | M | CH2M HILL (1998) | |
| 8 | Fall 1994 | M | CH2M HILL (2000a) | |
| 35.3–57.9 | Annual range, 1994–99 | M | Golder Associates, Inc. (2004)13 | |
| 43.7 | Annual mean, 1994–99 | M | Golder Associates, Inc. (2004)13 | |
| Upper Falls Dam to Monroe Street | 0.0 | Annual range, 1994–99 | M | Golder Associates, Inc. (2004)12 |
| 0.0 | Annual mean, 1994–99 | M | Golder Associates, Inc. (2004)12 | |
| -130 | May 1977–Apr. 1978 | M1 | Bolke and Vaccaro (1981) | |
| Monroe Street to Spokane gaging station | 957 | – | CM | Miller (1996)5 |
| 619 | – | CM | Miller (1996)5 | |
| 780 | – | CM | Miller (1996)5 | |
| 42 | Fall 1994 | M | CH2M HILL (1998) | |
| 41 | Spring 1995 | M | CH2M HILL (1998) | |
| 41 | Fall 1994 | M | CH2M HILL (2000a) | |
| 46.6–62.9 | Annual range, 1994–99 | M | Golder Associates, Inc. (2004)13 | |
| 56.2 | Annual mean, 1994–99 | M | Golder Associates, Inc. (2004)13 | |
| 46.5–58.1 | Annual range, 1994–99 | M | Golder Associates, Inc. (2004)12 | |
| 56.0 | Annual mean, 1994–99 | M | Golder Associates, Inc. (2004)12 | |
| Spokane gaging station to T.J. Meenach Bridge | 110 | Fall 1994 | M | CH2M HILL (1998) |
| 80 | Spring 1995 | M | CH2M HILL (1998) | |
| 91 | Fall 1994 | M | CH2M HILL (2000a) | |
| -24.0– -23.7 | Annual range, 1994–99 | M | Golder Associates, Inc. (2004)13 | |
| -30.4 | Annual mean, 1994–99 | M | Golder Associates, Inc. (2004)13 | |
| -37.8– -24.2 | Annual range, 1994–99 | M | Golder Associates, Inc. (2004)12 | |
| -30.4 | Annual mean, 1994–99 | M | Golder Associates, Inc. (2004)12 | |
| Spokane gaging station to 1 mi above T.J. Meenach Bridge | 50 | May 1977–Apr. 1978 | M1 | Bolke and Vaccaro (1981) |
| Spokane gaging station to Seven Mile | -92 | Oct. 1948–Sept. 1949 | SM | Anderson (1951) |
| -126 | Oct. 1948–Sept. 1950 | SM | Broom (1951) | |
| 11-427–184 | Oct. 1948–Sept. 1950 | SM | Broom (1951) | |
| -120 | Average conditions | R | Drost and Seitz (1978b) | |
| Spokane gaging station to Nine Mile | -853– -60 | Dec. 1948–Mar. 1950 | Lenz (1950) | |
| -138 | Oct. 1948–Sept. 1949 | SM | Anderson (1951) | |
| -115 | July 1984–Sept. 1984 | SM | Patmount and others (1985) | |
| -43 | Sept. 12, 1994 | SM | CH2M HILL (1998) | |
| -123 | Sept. 13, 1994 | SM | CH2M HILL (1998) | |
| -206 | Sept. 14, 1994 | SM | CH2M HILL (1998) | |
| -81 | Sept. 15, 1994 | SM | CH2M HILL (1998) | |
| -1,183 | Apr. 9, 1995 | SM | CH2M HILL (1998) | |
| -1,210 | Apr. 10, 1995 | SM | CH2M HILL (1998) | |
| -1,102 | April 11, 1995 | SM | CH2M HILL (1998) | |
| -1,134 | Apr. 12, 1995 | SM | CH2M HILL (1998) | |
| Spokane gaging station to Long Lake | -220 | Oct. 1948–Mar. 1952 | SM | Bureau of Reclamation (1956) |
| 8-207– -11 | Oct. 1948–Mar. 1952 | SM | Bureau of Reclamation (1956) | |
| -564 | 1951–59 | SM | Crosthwaite and others (1970) | |
| 8-713– -352 | 1951–59 | SM | Crosthwaite and others (1970) | |
| 1 mi above T.J. Meenach Bridge to T.J. Meenach Bridge | -5 | May 1977–Apr. 1978 | M1 | Bolke and Vaccaro (1981) |
| T.J. Meenach Bridge to Bowl and Pitcher Bridge | -50 | Fall 1994 | M | CH2M HILL (1998) |
| -56 | Spring 1995 | M | CH2M HILL (1998) | |
| -49 | Fall 1994 | M | CH2M HILL (2000a) | |
| -51.2– -48.4 | Annual range, 1994–99 | M | Golder Associates, Inc. (2004)13 | |
| -52.1 | Annual mean, 1994–99 | M | Golder Associates, Inc. (2004)13 | |
| T.J. Meenach Bridge to Seven Mile | 40 | May 1977–Apr. 1978 | M1 | Bolke and Vaccaro (1981) |
| -169– -159 | Annual range, 1994–99 | M | Golder Associates, Inc. (2004)12 | |
| -165.4 | Annual mean, 1994–99 | M | Golder Associates, Inc. (2004)12 | |
| Bowl and Pitcher Bridge to Seven Mile | -50 | May 1977–Apr. 1978 | M1 | Bolke and Vaccaro (1981) |
| -77 | Fall 1994 | M | CH2M HILL (1998) | |
| -82 | Spring 1995 | M | CH2M HILL (1998) | |
| -71 | Fall 1994 | M | CH2M HILL (2000a) | |
| -101– -80.2 | Annual range, 1994–99 | M | Golder Associates, Inc. (2004)13 | |
| -94.8 | Annual mean, 1994–99 | M | Golder Associates, Inc. (2004)13 | |
| Seven Mile to Nine Mile | -136 | Oct. 1948–Sept. 1949 | SM | Anderson (1951) |
| -21 | Oct. 1948–Sept. 1950 | SM | Broom (1951) | |
| 11-653–1,028 | Oct. 1948–Sept. 1950 | SM | Broom (1951) | |
| -100 | Average conditions | R | Drost and Seitz (1978b) | |
| -40 | May 1977–April 1978 | M1 | Bolke and Vaccaro (1981) | |
| -6 | Fall 1994 | M | CH2M HILL (1998) | |
| -9 | Spring 1995 | M | CH2M HILL (1998) | |
| -5 | Fall 1994 | M | CH2M HILL (2000a) | |
| 1.1–38.9 | Annual range, 1994–99 | M | Golder Associates, Inc. (2004)13 | |
| 9.6 | Annual mean, 1994–99 | M | Golder Associates, Inc. (2004)13 | |
| 59.4–77.4 | Annual range, 1994–99 | M | Golder Associates, Inc. (2004)12 | |
| 71.0 | Annual mean, 1994–99 | M | Golder Associates, Inc. (2004)12 | |
| Nine Mile to Little Spokane River confluence | -62.4– -51.6 | Annual range, 1994–99 | M | Golder Associates, Inc. (2004)12 |
| -63.9 | Annual mean, 1994–99 | M | Golder Associates, Inc. (2004)12 | |
| Nine Mile to Long Lake | -507– -343 | Dec. 1948–Mar. 1950 | Lenz (1950) | |
| -157 | Oct. 1948–Sept. 1950 | SM | Broom (1951) | |
| 11-1,422–603 | Oct. 1948–Sept. 1950 | SM | Broom (1951) | |
| -100 | 1951–59 | SM | Crosthwaite and others (1970) |
1 Steady-state.
2 Transient.
3 Range in 5-day recharge periods.
4 Flow at 347 cubic feet per second.
5 From Gearhart (2001).
6 Flow at 1,190 cubic feet per second.
7 Flow at 2,030 cubic feet per second.
8 Range in yearly averages.
9 Range in monthly averages.
10 Range in monthly averages, July–December.
11 Range in weekly averages.
12 Golder Associates, Inc., 2004 (table 9.3, revised).
13 Golder Associates, Inc., 2004 (table 9.5).
Ground water leaves the SVRP aquifer in several ways: through pumpage from wells; seepage into the Spokane and Little Spokane Rivers; and outflow to Long Lake.
Monthly ground-water withdrawal data for 1990 through 2004 currently (2005) are being compiled for this study, and generally are available from almost all public-supply water systems with varying degrees of completeness. Data quality differs from system to system and the limitations include:
Estimates of ground-water withdrawals by previous investigators are shown in table 11. Two types of irrigation pumpage are shown in table 11: irrigation pumpage and irrigation pumpage consumptive loss. The former is strictly ground water pumped for irrigation. The latter is ground water pumped for irrigation that is used consumptively, that is, lost to evapotranspiration or plant growth and not returned to the aquifer. Ground-water withdrawal estimates used in previous models are discussed in more detail in the Previous Ground Water Flow Modeling section.
Much of the ground water pumped by municipal or industrial users is returned to the Spokane or Little Spokane Rivers through wastewater-treatment plants. Though not strictly an input or withdrawal from ground water, estimates are included in table 12 to show (in addition to evapotranspiration and recharge) the destination of ground-water withdrawals.
As discussed above, the Spokane River gains and loses flow along its length, depending upon the particular reach. See table 10 and the Ground-Water/Surface-Water Interactions section for more information.
The Little Spokane River primarily gains flow from the SVRP aquifer. Loss estimates primarily are from streamflow measurements and vary much less than other SVRP water budget components (table 13).
Evapotranspiration in the study area primarily is by crop irrigation and lawn and landscaping vegetation. Previous evapotranspiration estimates have been either subtracted from precipitation, irrigation, or general land-application volumes or explicitly included as an item in water budgets. Both estimate types are included in table 6. Previous investigators rejected evapotranspiration directly from the saturated zone as a significant water-budget component.
As with ground-water underflow to the SVRP aquifer, underflow out of the aquifer cannot be directly measured and estimates usually are the residual of other water-budget components. Previous underflow estimates are shown in table 9.
Table 11. Estimates of ground-water withdrawals from the Spokane-Valley–Rathdrum Prairie aquifer.
[Withdrawal: shown as negative for consistency with other water-budget components (negative values indicate discharge from the aquifer). Method: C, calculated; R, referenced; Abbreviations: SW, surface water; ID, Idaho; WA, Washington; ft3/s, cubic foot per second; ≤, less than or equal; –, not applicable or unknown]
| Pumpage | Withdrawal from aquifer (ft3/s) |
Period calculated |
Method | Reference |
|---|---|---|---|---|
| Pumpage, total | -138 | – | – | Bureau of Reclamation (1954) |
| -227 | 1977 | R | Bolke and Vaccaro (1981) | |
| 1-119– -465 | 1977 | R | Bolke and Vaccaro (1981) | |
| -234 | Fall 1994 | C | CH2M HILL (1998) | |
| -129 | Spring 1995 | C | CH2M HILL (1998) | |
| -234 | Fall 1994 | C | CH2M HILL (2000a) | |
| Pumpage, total, WA | -100– -250 | 1928–38 | R | Piper and La Rocque (1944) |
| -178 | 1972 | R | U.S. Army Corps of Engineers and Kennedy-Tudor Engineers (1976) | |
| Industrial pumpage | -14 | 1950 | R | Anderson (1951) |
| -14 | 1955 | R | Bureau of Reclamation (1956) | |
| Industrial pumpage2 | -19 | 1964 | R | Cline (1969) |
| Industrial pumpage | -19 | 1976 | R | Drost and Seitz (1978b) |
| Irrigation pumpage | -33 | 1977 | R | Bolke and Vaccaro (1981) |
| Irrigation pumpage, WA | -44 | 1950 | R | Anderson (1951) |
| -31 | 1976 | R | Drost and Seitz (1978b) | |
| Irrigation pumpage, ID | -61 | 1976 | R | Drost and Seitz (1978b) |
| Irrigation pumpage consumptive loss, WA | -21 | 1976 | R | Drost and Seitz (1978b) |
| Irrigation pumpage consumptive loss, WA | -17 | 1950 | R | Anderson (1951) |
| Irrigation pumpage consumptive loss, ID | -41 | 1976 | R | Drost and Seitz (1978b) |
| Irrigation pumpage | -48 | – | R | Bureau of Reclamation (1954) |
| -48 | 1955 | R | Bureau of Reclamation (1956) | |
| Irrigation pumpage2 | -3 | 1964 | R | Cline (1969) |
| Municipal pumpage | -90 | – | R | Anderson (1951) |
| Municipal pumpage2 | -15 | 1964 | R | Cline (1969) |
| Municipal pumpage | -128 | 1976 | R | Drost and Seitz (1978b) |
| -160 | 1977 | R | Bolke and Vaccaro (1981) | |
| Municipal pumpage, city of Spokane | -83 | 1950 | R | Anderson (1951) |
| -82 | 1951 | R | Broom (1951) | |
| -84 | 1949 | R | Bureau of Reclamation (1954) | |
| -93 | 1955 | R | Bureau of Reclamation (1956) | |
| Municipal and domestic pumpage | ≤-117 | 1955 | R | Bureau of Reclamation (1956) |
| Rural domestic pumpage2 | -1 | 1964 | R | Cline (1969) |
| Stock pumpage2 | -1 | 1964 | R | Cline (1969) |
| Pumpage discharged to SW, WA | -62 | Average conditions | R | Drost and Seitz (1978b) |
| Pumpage discharged to SW, ID | -2 | Average conditions | R | Drost and Seitz (1978b) |
| Irrigation pumpage consumptive loss | -14 | 1955 | R | Bureau of Reclamation (1956) |
| Pumpage consumptive loss, WA | -17 | 1950 | R | Anderson (1951) |
| -65 | Average conditions | R | Drost and Seitz (1978b) | |
| Pumpage consumptive loss, ID | -46 | Average conditions | R | Drost and Seitz (1978b) |
| Pumpage consumptive loss, exempt users | -14 | – | R | Golder Associates, Inc. (2004) |
1 Range in monthly averages.
2 Primarily the Little Spokane River Valley.
[Method: R, referenced. Abbreviations: ID, Idaho; WA, Washington; WWTP, wastewater-treatment plant; ft3/s, cubic foot per second]
| Discharges | Discharge/ diversion (ft3/s) |
Period calculated |
Method | Reference |
|---|---|---|---|---|
| Wastewater discharge, WA | 62 | 1976 | R | Drost and Seitz (1978b) |
| Wastewater discharge, ID | 2 | 1976 | R | Drost and Seitz (1978b) |
| Coeur d’Alene WWTP | 3.58 | Mean, July–Sept. 1984 | R | Patmount and others (1985) |
| Liberty Lake WWTP | 0.7–.8 | Monthly range | R | Golder Associates, Inc. (2004) |
| .7 | Annual average | R | Golder Associates, Inc. (2004) | |
| .4 | Mean, July–Sept. 1984 | R | Patmount and others (1985) | |
| Spokane Industrial Park | 1.46 | Mean, July–Sept. 1984 | R | Patmount and others (1985) |
| Kaiser Trentwood | 37.5 | Mean, July–Sept. 1984 | R | Patmount and others (1985) |
| 29.7–34.6 | Monthly range | R | Golder Associates, Inc. (2004) | |
| 32 | Annual average | R | Golder Associates, Inc. (2004) | |
| Inland Empire Paper | 3.38 | Mean, July–Sept. 1984 | R | Patmount and others (1985) |
| 5.9–6.7 | Monthly range | R | Golder Associates, Inc. (2004) | |
| 6.1 | Annual average | R | Golder Associates, Inc. (2004) | |
| Avista heating wastewater | .5 | Monthly range | R | Golder Associates, Inc. (2004) |
| .5 | Annual average | R | Golder Associates, Inc. (2004) | |
| Spokane WWTP | 63 | 1951 | R | Broom (1951) |
| Spokane Advanced WWTP | 56.5–75.0 | Monthly range | R | Golder Associates, Inc. (2004) |
| 58.2–67.8 | Range, July–Sept. 1984 | R | Patmount and others (1985) | |
| 62.6 | Mean, July–Sept. 1984 | R | Patmount and others (1985) | |
| 63.9 | Annual average | R | Golder (2004) | |
| Northwest Terrace WWTP | .13 | Mean, July–Sept. 1984 | R | Patmount and others (1985) |
| Colbert Landfill east and west systems | 1.4 | Monthly range | R | Golder Associates, Inc. (2004) |
| 1.4 | Annual average | R | Golder Associates, Inc. (2004) | |
| Colbert Landfill south system | .1 | Monthly range | R | Golder Associates, Inc. (2004) |
| .1 | Annual average | R | Golder Associates, Inc. (2004) | |
| Fish hatchery (to Little Spokane River) | 14 | Monthly range | R | Golder Associates, Inc. (2004) |
| 14 | Annual average | R | Golder Associates, Inc. (2004) | |
| Total wastewater discharge to surface water | 64 | 1976 | R | Drost and Seitz (1978b) |
| Wastewater discharge to surface water | 50 percent pumpage from Spokane seasonal wells | 1977 | R | Bolke and Vaccaro (1981) |
| 90 percent pumpage from Spokane continuous wells | 1977 | R | Bolke and Vaccaro (1981) |
[Recharge: Negative values indicate discharge from the aquifer into the stream. Method: M, ground-water-flow model; R, referenced; SM, streamflow measurements; WY, watershed yield. Abbreviations: ft3/s, cubic foot per second; –, not applicable or unknown; <, less than]
| Stream and reach | Recharge to aquifer (ft3/s) |
Period calculated | Method | Reference |
|---|---|---|---|---|
| Little Spokane River | < -249 | – | – | Bureau of Reclamation (1954) |
| -336– -223 | Sept. 1955-70, 1973, 1977 | SM | Bolke and Vaccaro (1981) | |
| 1-267 | Sept. 1955-70, 1973, 1977 | SM | Bolke and Vaccaro (1981) | |
| -250 | May 1977-Apr. 1978 | M2 | Bolke and Vaccaro (1981) | |
| -263 | May 1977-Apr. 1978 | M3 | Bolke and Vaccaro (1981) | |
| 4-280– -250 | May 1977-Apr. 1978 | M3 | Bolke and Vaccaro (1981) | |
| -300 | Fall 1994 | M | CH2M HILL (1998) | |
| -335 | Spring 1995 | M | CH2M HILL (1998) | |
| -182 | Fall 1994 | M | CH2M HILL (2000a) | |
| -281 | 1994-99 | M | Golder Associates, Inc. (2004) | |
| Lower Little Spokane River | “A few hundred”5 | 1931-32 | R | Piper and La Rocque (1944) |
| Above at Dartford gaging station | -160 | – | R | Cline (1969) |
| Above near Dartford gaging station | -130 | – | SM, WY | Pluhowski (1970) |
| At Dartford–Near Dartford gaging stations | 6-251– -218 | Oct. 1948-Sept. 1952 | SM | Broom (1951) |
| 7-279– -46 | Oct. 1948-Sept. 1952 | SM | Broom (1951) | |
| -230 | Mean, Apr. 1948–Mar. 1952 | SM | Bureau of Reclamation (1956) | |
| 6-251– -216 | Apr. 1948-Mar. 1952 | SM | Bureau of Reclamation (1956) | |
| 7-264– -172 | Apr. 1948-Mar. 1952 | SM | Bureau of Reclamation (1956) | |
| 4-mile reach below Dartford | -60 | -- | R | Cline (1969) |
| At Dartford–Near Dartford gaging stations | -235 | Oct. 1948-Mar. 1952 | SM | Crosthwaite and others (1970) |
| 6-250– -218 | Oct. 1948-Mar. 1952 | SM | Crosthwaite and others (1970) | |
| Dartford–3 mi above mouth | -310 | Average conditions | R | Drost and Seitz (1978b) |
| At Dartford–Near Dartford gaging stations | -255 | Sept. 2004 | SM | Hortness and Covert (2005) |
| 4-249– -244 | 1947-52, 1998-2003 | SM | Hortness and Covert (2005) | |
| At Dartford–mouth | -318– -236 | Dec. 1976-Sept. 1977 | SM | Bolke and Vaccaro (1981) |
| 1-266 | Sept. 1955-70, 1973, 1977 | SM | Bolke and Vaccaro (1981) |
Spokane River interacts dynamically with the SVRP aquifer acting as a ground-water recharge source in some places and as a ground-water discharge area in other places. An adequate understanding of the Spokane River and the SVRP aquifer interaction is essential for managers and scientists when making water resource decisions for the area.
Streams interact with ground water in three basic ways: a stream can gain water from inflow of ground water through the streambed, a stream can lose water to the aquifer by outflow through the streambed, or a stream can do both by gaining in some reaches and losing in other reaches (Winter and others, 1998). When the stream-water surface altitude is higher than ground-water levels in the nearby area, water potentially flows to the aquifer from the river (a losing reach). Conversely, when the stream-water surface altitude is less than the nearby ground-water levels, water flows from the aquifer to the river (a gaining reach). Since ground-water levels and stream stage can change temporally with various factors such as precipitation, water use, and streamflow changes (natural or human-caused), stream reaches may temporally alternate from gaining to losing.
The rate at which water flows from stream to aquifer depends on several factors including hydraulic properties of the streambed and adjoining aquifer, depth of stream penetration into the aquifer, and the hydraulic gradient between the stream and aquifer. Generally, for a losing reach, increased leakage from the river will result as the stream level increases (increasing hydraulic gradient) and as more streambed area is submerged. When unsaturated conditions exist below a stream (the water table is below the stream bottom), leakage from the stream is unaffected by the hydraulic head in the aquifer. When saturated conditions exist below a stream, leakage from the stream will decrease as the hydraulic head in the aquifer approaches the stream level.
The Spokane River is the only surface outflow of Coeur d’Alene Lake in northern Idaho (pl. 1). The river flows out of the northern end of Coeur d’Alene Lake and then westward into the glacial and flood deposit filled valley and through the city of Spokane, Washington (pl. 2). Between Lake Coeur d’Alene and the Washington–Idaho state line, the river flows adjacent to bedrock uplands to the south or through narrow bedrock channels. The river flows through a relatively narrow valley incised in valley deposits from the Washington−Idaho state line and westward through Spokane. A short reach of the river in downtown Spokane flows over basalt.
Water discharge from Coeur d’Alene Lake into the Spokane River is regulated by a set of dams at Post Falls. Therefore, streamflow does not always represent the runoff from the watershed. During normal years, the gates are usually open between December and June and streamflow increases during the spring snowmelt and decreases in June. During most of summer, flow is regulated to maintain levels in Coeur d’Alene Lake. From late September through December, the gates are incrementally opened to lower the lake to its natural level (Box and Wallis, 2002.) Streamflow has been measured by USGS since 1913 at Spokane River near Post Falls, Idaho, (table 14).
[Abbreviations: ID, Idaho; WA, Washington]
| Gaging station name | Gaging station No. | Period of record (water years) |
|---|---|---|
| Spokane River near Post Falls, ID | 12419000 | 1913–present |
| Spokane River above Liberty Bridge, near Otis Orchards, WA | 12419500 | 1929–83, 1999–present |
| Spokane River at Greenacres, WA | 12420500 | 1948–52, 1999–present |
| Spokane River at Trent, WA | 12421000 | 1912–13 |
| Spokane River below Trent Bridge, near Spokane, WA | 12421500 | 1948–54 |
| Spokane River below Greene Street, at Spokane, WA | 12422000 | 1949–52 |
| Spokane River at Spokane, WA | 12422500 | 1891–present |
| Hangman (Latah) Creek at Spokane, WA | 12424000 | 1948–present |
| Little Spokane River at Dartford, WA | 12431000 | 1929–32, 1947–present |
| Little Spokane River near Dartford, WA | 12431500 | 1948–52, 1998–present |
Several investigations (including Piper and La Rocque, 1944; Broom, 1951; McDonald and Broom, 1951; Drost and Seitz, 1978b; Bolke and Vaccaro, 1981; CH2M HILL, 1998; Gearhart and Buchanan, 2000; Marti and Garrigues, 2001; Caldwell and Bowers, 2003; Hortness and Covert, 2005) have determined that the Spokane River loses water to the SVRP aquifer in some places and gains water from the aquifer in other places. As early as 1944, Piper and La Rocque noted that the upper reach of Spokane River from at least Post Falls, Idaho, to a point 4 mi west of the Washington−Idaho state line appeared to be insulated from and higher than the regional water table. They also noted that ground-water level fluctuations were similar to river water-level fluctuations. Later studies corroborated their results.
Broom (1951) and McDonald and Broom (1951) analyzed data from 11 gaging stations on the Spokane and Little Spokane Rivers for water years 1948-50. They concluded that not only did the amounts of gains and losses vary throughout the year, but also that the locations of the gains and losses varied. For example, the reach of the Spokane River between Post Falls, Idaho, and the Barker Road Bridge near Greenacres, Washington (fig. 1), ranged from gaining as much as 529 ft3/s to losing as much as 757 ft3/s, with an average annual loss of about 78 ft3/s.
Based on data from Broom (1951) and McDonald and Broom (1951), Drost and Seitz (1978b) provided estimates of average gains and losses between the SVRP aquifer and the Spokane and Little Spokane Rivers. They estimated an average annual loss of about 80 ft3/s in the reach of the Spokane River between Post Falls, Idaho, and near Barker Road Bridge in Washington (fig. 1). They also estimated that about 250 ft3/s recharged the aquifer from Coeur d’Alene Lake and the Spokane River between the lake and Post Falls. It was estimated that the remainder of the Spokane River between the Barker Road Bridge and its confluence with the Little Spokane River gained an annual average of 780 ft3/s. Drost and Seitz (1978b) separated the gaining reach of the Spokane River into four segments and provided estimates of annual gains for each. They also estimated that the Little Spokane River gains about 310 ft3/s from the aquifer below Dartford, Washington (fig. 1). Overall, Drost and Seitz (1978b) estimated a net annual discharge of 1,010 ft3/s from the SVRP aquifer to the Spokane and Little Spokane Rivers.
Bolke and Vaccaro (1981) presented gains and losses of the Spokane River based on a numerical flow model. The Spokane and Little Spokane Rivers were divided into 13 reaches. In contrast to earlier studies, several gaining and losing stream reaches were determined based on the May 1977 to April 1978 modeled period. Previous studies reported that the Spokane River was entirely a gaining reach below Barker Road Bridge in Greenacres, whereas, Bolke and Vaccaro (1981) reported five losing reaches and five gaining reaches below Barker Road Bridge.
The consulting firm CH2M HILL (1998) constructed a finite-element ground-water flow model of the Washington part of the SVRP aquifer for the city of Spokane. Riverbed leakage rates were specified in the model for 16 Spokane River reaches. Results of two model simulations based on two data-collection periods (autumn 1994 and spring 1995) indicated that the Spokane River had a net streamflow loss of about 83 ft3/s during autumn and a net gain of 80 ft3/s during spring. The river fluctuated several times from losing to gaining along its course on the Washington part of the aquifer in both modeling scenarios. Ten reaches were reported as losing and six were reported as gaining. However, CH2M HILL (1998) reported considerable uncertainty in quantifying magnitudes and locations of the streamflow gains and losses.
Gearhart and Buchanan (2000) examined the hydraulic connection between the Spokane River and the aquifer from the Washington−Idaho state line to Spokane, Washington, and also described the results of previous studies. The river was divided into five reaches and each reach was specified as unsaturated, saturated, or transitional (combination of saturated and unsaturated) based on ground-water levels and river stage. Consistent with earlier studies, they concluded that the river was a losing reach between Post Falls, Idaho, and the Barker Road Bridge west of Spokane (fig. 1) with unsaturated flow conditions between the river and aquifer. Gearhart and Buchanan (2000) also concluded that the river is transitional downstream between the Barker Road and Sullivan Road Bridges as it varies from losing to gaining with changes in the water table and river stage (fig. 1). Flux values were calculated for each reach using Darcy’s equation with riverbed areas estimated from aerial photographs and field observations at high and low streamflow conditions.
Caldwell and Bowers (2003) monitored the Spokane River and ground water between Post Falls and the Sullivan Road Bridge (fig. 1) over various hydrologic conditions at a streamflow-gaging station and at 25 monitoring wells ranging from 40 to 3,500 ft from the river. River stage, ground-water level, water temperature, and specific conductance were measured hourly to biweekly. Hydrologic and chemical data corroborated with earlier studies, which indicate that the Spokane River recharges the SVRP aquifer along an 18-mi reach between Post Falls, Idaho, and Barker Road Bridge (fig. 1). However, ground-water levels in the near-river aquifer (less than 300 ft from the river) indicated that saturated conditions could exist below the river where a steep hydraulic gradient is between the river and the aquifer. Therefore, the conceptual model for the river’s losing section between Post Falls and Spokane shows that the river either is separated from the ground-water system by an unsaturated zone or a steep hydraulic gradient exists from the river to aquifer. Caldwell and Bowers (2003) describe the streambed of Spokane River along this reach as being composed of coarse gravel, pebbles, and cobbles, with interstitial fine silt and clay between the larger materials below the surface. The fine-grained material, some of which may have been transported with the leaking water from the river, likely decreases the permeability of the streambed and underlying adjacent substrate. This low permeability material acts as a leaky layer between the river and the underlying aquifer.
Caldwell and Bowers (2003) used water levels from about 70 wells to construct a generalized water-table map of the area between Post Falls, Idaho, and Spokane, Washington (fig. 7). A hydraulic gradient of about 0.001 (5.4 ft/mi) characterizes the regional flow system in the central part of the valley, which supports the reported high transmissivity for the aquifer. However, the hydraulic gradient determined using monitoring wells near the losing reach of the river is more than an order of magnitude larger at 0.08 (422 ft/mi). This large gradient results from localized recharge from the river and the hydraulic properties of the shallow, near-river aquifer material.
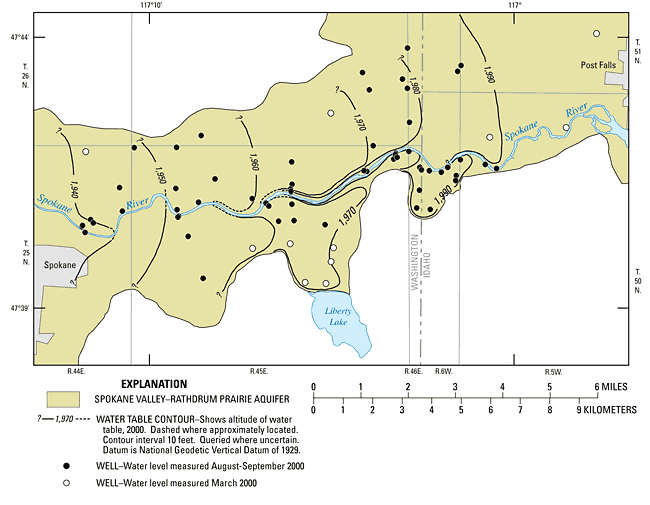
(Modified from Caldwell and Bowers, 2003.)
Spokane River mean annual flow measured at Post Falls over the period of record from 1913 through 2001 was about 6,200 ft3/s. Caldwell and Bowers (2003) calculated streamflow differences between the Post Falls and Otis Orchards gaging stations from water years 2000-01 to determine the leakage between Post Falls, Idaho, and the eastern city limits of Spokane, Washington. This section of the river potentially always loses water to the underlying aquifer because the water-table altitude in the area is below the river stage. Based on mean monthly streamflow values from the Post Falls and the Otis Orchards gaging stations from water years 2000-01, Caldwell and Bowers (2003) calculated net losses ranging from 69 to 810 ft3/s with a median of 255 ft3/s. Losses generally increased with increased streamflow. As stream levels increase with increased flows, leakage generally increases because of the increase in both the hydraulic gradient between the surface water and ground water and the amount of streambed area submerged by the stream. However, late summer warm water temperatures also appear to be a factor with increased losses due to lower viscosity as water temperatures increased. Losses determined from this study are similar to those calculated by Gearhart and Buchanan (2000) using riverbed areas and Darcy’s Law to calculate losses for the reach between the Washington−Idaho state line and the Sullivan Road Bridge (losses of 104 ft3/s during low flow conditions to 571 ft3/s during high flow conditions).
Golder Associates, Inc. (2004) constructed computer models of the Little Spokane and Middle Spokane watersheds, which includes the SVRP aquifer in Washington. Initial streambed leakage values were compiled from previous studies and adjusted during the calibration process. Model calibration included the attempted matching of measured weekly discharges at three gaging stations on the Spokane and Little Spokane Rivers. The final model matched the Spokane River streamflow values quite well, but not as well for the Little Spokane River. Average annual gains and losses were calculated for 1994-99 for 13 Spokane River reaches based on modeled base flows for those years.
Hortness and Covert (2005) examined streamflow data for 10 gaging stations on the Spokane River and its tributaries (fig. 8, table 14). Trend analyses were computed using streamflow data from 4 of the 10 gaging stations with complete records from 1968 through 2002 (a period most likely representing current conditions after ceasing operation of a canal system in the area). Only a few statistically significant trends in the July through December monthly mean streamflow data and annual 7-day low streamflows were observed. Statistically significant decreasing trends in the monthly mean streamflow were determined at the gaging stations: Spokane River near Post Falls, Idaho (August and September); Spokane River at Spokane, Washington (September); and Little Spokane River at Dartford, Washington (September and October). Decreasing annual 7-day low streamflows were detected at the Spokane River near Post Falls, Idaho, and Spokane River at Spokane, Washington, gaging stations.
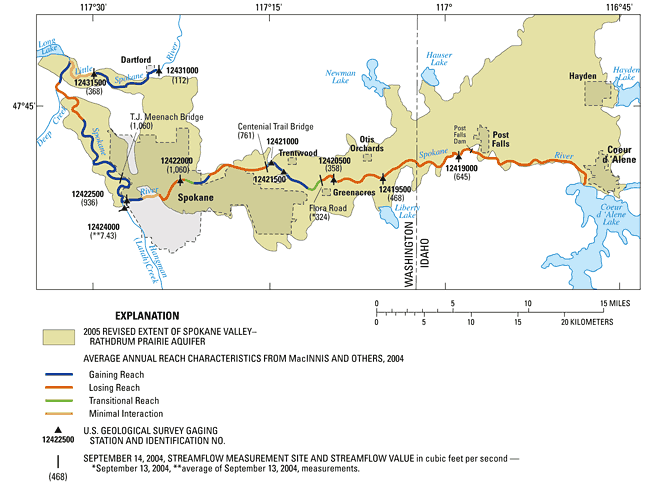
Hortness and Covert (2005) calculated ground-water/surface-water exchanges on the Spokane and Little Spokane Rivers based on July through December (1968-2002) monthly mean streamflow data from adjacent gaging stations (table 14). However, several analyses were based on data from gaging stations with limited periods of record. Median losses ranged from 37 to 78 ft3/s for the Spokane River reach between Post Falls, Idaho, and near Otis Orchards, Washington. Analysis of available data for the Spokane River reach between the Otis Orchards and Greenacres gaging stations indicated that no calculated gains or losses were outside the range of measurement error. Median gains between the Spokane River at Greenacres, Washington and the Spokane River below Trent Bridge gaging stations ranged from 330 ft3/s to 754 ft3/s and gains between the Trent Bridge and Greene Street gaging stations ranged from 259 ft3/s to 447 ft3/s. Differences in monthly mean streamflow values for the area between gaging stations on the Little Spokane River at Dartford and near Dartford (a distance of about 6 river miles) ranged from an average gain of 244 ft3/s in July to an average gain of 249 ft3/s in October and December.
Hortness and Covert (2005) also did trend analyses on the differences in monthly mean streamflow between the Spokane River near Post Falls, Idaho, and the Spokane River at Spokane, Washington, gaging stations for July through December, 1968-2002. While the upper portions of this reach are known to lose streamflow to the aquifer, the overall reach historically has a net gain in streamflow. However, the trend analysis indicated that streamflow gains significantly decreased over time during September, October, and November.
A seepage study of the Spokane and Little Spokane Rivers was completed by the USGS during September 2004 (table 15). Streamflow measurements from selected sites are included in figure 8. Streamflow measurements indicated that the upper reach of the Spokane River between the gaging station at Post Falls and downstream at Flora Road lost 321 ft3/s. A gain of 736 ft3/s was calculated between the Flora Road measurement site and downstream at the Greene Street Bridge. A loss of 124 ft3/s was calculated for the reach between the Greene Street Bridge and the Spokane River at Spokane gaging station. The river gained about 87 ft3/s (after subtracting inflow from Hangman Creek and springs above T.J. Meenach Bridge) between the Spokane River at Spokane gaging station and the T.J. Meenach Bridge. Overall, the Spokane River gained about 376 ft3/s between the Post Falls, Idaho, gaging station and just below the T.J. Meenach Bridge. Spokane River streamflow was not measured further downstream because of the effects of the Nine Mile and Long Lake Reservoirs. Estimated gains of 254 ft3/s (after measured inflow from springs and tributaries were subtracted) were calculated for the reach between the Little Spokane River gaging stations at Dartford and near Dartford (a distance of about 7 river miles). Differences in streamflow measured at the Little Spokane River near Dartford gaging station and on the Little Spokane River near the mouth were within the error of the measurements.
MacInnis and others (2004), included the September 2004 USGS seepage data and estimated low flow values based on historical data and computer modeling of additional sites to further delineate and quantify Spokane and Little Spokane Rivers reach characteristics (fig. 8). Their interpretation included the determination of gaining, losing, and transitional reaches of the Spokane River between Flora Road and the Spokane gaging station in addition to determinations made using the USGS seepage data. MacInnis and others (2004) also delineated gaining and losing reaches of the Spokane River from the T. J. Meenach Bridge (the most downstream site measured during the USGS seepage study) to its confluence with the Little Spokane River.
Zheng (1995), Marti and Garrigues (2001), and Caldwell and Bowers (2003) examined water quality aspects of the area. In 1994, Zheng (1995) investigated ground-water quality and Spokane River water quality. Zheng noted that trace metal concentrations in ground water generally were at low concentrations, but also noted consistently high zinc concentrations in the river. Zheng suggested that the river is unlikely to pose significant contamination to the aquifer. Marti and Garrigues (2001) and Caldwell and Bowers (2003) determined that water-chemistry data indicated that Spokane River does lose water to the aquifer along its upper reaches and that it does affect the aquifer’s water quality. Cadmium, lead, and zinc concentrations in the near-river aquifer were elevated and similar to the Spokane River, but all were well below drinking-water standards. Chemical data indicated that river recharge may influence ground-water chemistry as far as 3,000 ft from the river, but ground water is most affected within a few hundred feet of the river (Caldwell and Bowers, 2003). Major ions, stable isotopes, and temperature of the river and ground water from near-river wells were similar and exhibited similar temporal trends, whereas, ground water from wells farther from the river generally had higher major ion concentrations and more stable temperatures and chemistry.
[Modified from Kimbrough and others, 2005; Abbreviations: mi, mile; ft3/s, cubic foot per second; °C, degrees Celsius. –, no data]
| River mile | Stream | Location | Measured discharge (ft3/s) | Date | Gain or loss (ft3/s) | Water temperature (oC) |
|---|---|---|---|---|---|---|
| 100.7 | Spokane River | Gaging station near Post Falls (12419000) | 1645 | 09-14-04 | – | – |
| 93.9 | Spokane River | Gaging station above Liberty Bridge (12419500) | 1468 | 09-14-04 | -177 | – |
| 90.5 | Spokane River | Gaging station at Greenacres (12420500) | 1358 | 09-14-04 | -110 | – |
| 89.1 | Spokane River | At Flora Road NW¼SW¼ sec.7, T.25 N., R.44 E. | 324 | 09-13-04 | -34 | 16.2 |
| 84.2 | Spokane River | At Centennial Trail pedestrian bridge below Plantes Ferry Park, NW¼SE¼ sec.4, T.25 N., R.44 E. | 761 | 09-13-04 | +437 | – |
| 77.3 | Spokane River | 0.5 mi below Greene Street bridge, NW¼SE¼ sec.9, T.25 N., R.43 E. (0.5 mi below former gaging station 12422000) | 1,060 | 09-14-04 | +299 | 12.5 |
| 72.8 | Spokane River | Gaging station at Spokane (12422500) | 1936 | 09-14-04 | -124 | – |
| 73.2 | Hangman Creek | Gaging station at Spokane (12424000) | 27.43 | 09-13-04 | – | 13.8 |
| 72.2 | Confluence of Hangman Creek and Spokane River | |||||
| 70 | Springs | NW¼SW¼ sec.12, T.25 N., R.42 E., above T.J. Meenach Bridge | 1.88 | 09-16-04 | – | 11.4 |
| 69.6 | Spokane River | SE¼NW¼ sec.11, T.25 N., R.42 E., below T.J. Meenach Bridge | 1,030 | 09-14-04 | +85 | 13.2 |
| 69.7 | Little Spokane River | SE¼NW¼ sec.33, T.27 N., R.43 E., below Little Spokane Drive bridge, above Deadman Creek | 99.2 | 09-14-04 | – | 12.8 |
| 69.7 | Little Deep Creek | SW¼NE¼ sec.33, T.27 N., R.43 E., below Shady Slope Road bridge, near mouth | .67 | 09-14-04 | – | 10.7 |
| 69.8 | Deadman Creek | NW¼SE¼ sec.33, T.27 N., R.43 E., at Shady Slope Road bridge, near mouth (South tributary) | .14 | 09-14-04 | – | 11.1 |
| 69.8 | Deadman Creek | NW¼SE¼ sec.33, T.27 N., R.43 E., at Shady Slope Road bridge, near mouth | 10.3 | 09-14-04 | – | 10.5 |
| 67.7 | Little Spokane River | SE¼SW¼ sec.32, T.27 N., R.43 E., below foot bridge, at Pine River Park | 105 | 09-14-04 | -5.3 | 13.7 |
| 67.2 | Little Spokane River | Gaging station at Dartford (12431000) | 1112 | 09-15-04 | +7 | – |
| 66.8 | Dartford Creek | NW¼NE¼ sec.6, T.26 N., R.43 E., above Hazard Road bridge, near mouth | 2.37 | 09-14-04 | – | 11.3 |
| 63.9 | Little Spokane River | NE¼NE¼ sec.11, T.26 N., R.42 E., at Waikiki Road/Rutter Parkway bridge | 302 | 09-15-04 | +188 | – |
| 60.2 | Little Spokane River | Gaging station near Dartford (12431500) | 1368 | 09-15-04 | +66 | – |
| 57.4 | Little Spokane River | SE¼NW¼ sec.5, T.26 N., R.42 E., at State Route 291 bridge, near mouth | 349 | 09-15-04 | -19 | 11.4 |
| 56.3 | Confluence of Little Spokane River and Spokane River |
Although it is known that interaction occurs between the SVRP aquifer and the Spokane and Little Spokane Rivers, additional information still is needed for increased understanding of the hydrologic system and to enable more accurate construction and calibration of the ground-water flow model. Previous studies reported ground- and surface-water interaction, but several discrepancies exist among the studies regarding location, direction of flow (to or from rivers), and quantity of streamflow gains or losses.
For a computer model to most accurately represent a hydrologic system, the model needs to adequately match real-world water-level measurements in the aquifer and streamflow in the rivers. Not only is it important to match these measurements under assumed steady-state (approximate equilibrium) conditions, but also under transient conditions as the hydrologic system responds to changing stresses (examples: pumping increases, changing river stage, and varying precipitation). Several gaging stations are on the Spokane and Little Spokane Rivers and ground-water levels have been monitored at various locations, over a range of time periods, and at a variety of frequencies ranging from a few miscellaneous measurements to continuously recorded measurements. A significant amount of data currently are available from near-river monitoring wells between Post Falls and the Sullivan Road Bridge (fig. 1), but more data are needed elsewhere along the Spokane and Little Spokane Rivers.
For more information about USGS activities in Washington, visit the USGS Washington District home page .

![]() U.S. Department of the Interior |
U.S. Geological Survey
U.S. Department of the Interior |
U.S. Geological Survey
URL: https://pubsdata.usgs.gov/pubs/sir/2005/5227/section6.html
Page Contact Information:
Page Last Modified: Thursday, 01-Dec-2016 18:45:51 EST
