
Figure 2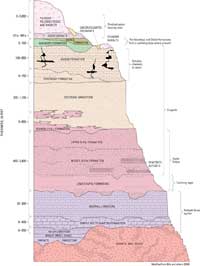
Generalized stratigraphic section of rock units in and adjacent to the C aquifer in the study area, northeastern Arizona.
Figure 3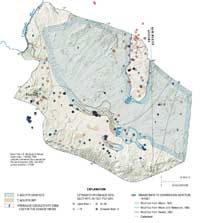
Estimated hydraulic conductivity values for the C aquifer, northeastern Arizona, compiled by Southwest Ground-water Consultants (2003), hydraulic conductivity zones, and contours of drawdown to conversion to unconfined conditions used in the change model.
Physiographic and Hydrogeologic Setting
The Little Colorado River Basin is in the southern part of the Colorado Plateau physiographic province (Fenneman, 1946). The Little Colorado River drains an area of about 27,000 mi2 of northeastern Arizona and northwestern New Mexico (fig. 1). Elevations in the basin range from about 2,700 ft near the mouth of the Little Colorado River to 12,633 ft near Flagstaff. Average annual precipitation ranges from less than 6 in. in the lower areas to more than 30 in. in the highest elevations. Total annual average precipitation within the basin is estimated to be approximately 17,000,000 acre-ft. Potential evapotranspiration is estimated to range from less than 30 in/yr to more than 60 in/yr (Hart and others, 2002).
Boundary of the C Aquifer
The southern and southwestern boundary of the C aquifer extends south of the Little Colorado River Basin into the Verde River and Salt River Basins where rocks of the C aquifer are exposed along the Mogollon Rim (fig. 1). The northeastern boundary of the aquifer extends into New Mexico where the aquifer thins substantially (Hart and others, 2002). Few water-level and geologic data are available; therefore, the boundary is uncertain in these locations. The western boundary of the C aquifer is west of the Little Colorado River where the aquifer is unsaturated. Rocks of the C aquifer crop out in the southern and southwestern areas along the Mogollon Rim, in the northeastern area near the Defiance Uplift, and in the western area near the Little Colorado River (fig. 1).
Geologic Structure
The dominant structural feature within the C-aquifer area is the Black Mesa Basin, located in the north central part of the study area. The C aquifer generally dips toward the center of the basin from its outcrops along the margins of the study area. In the center of the Black Mesa Basin the aquifer is buried beneath nearly 5,000 ft of overlying geologic units (Southwest Ground-water Consultants, Inc., 2003; fig. 2) The Defiance Uplift is near the eastern edge of the C aquifer. Monoclines on either side of the uplift plunge to the west and east in the Black Mesa and San Juan Basins. Several regional-scale normal faults exist in the area and generally have two principal strike directions: north-northeast and north-northwest (Bills and others, 2000).
Geologic Units of the C Aquifer
The C aquifer comprises a sequence of sedimentary rock units between the top of the Kaibab Formation, which may underlie the Shinarump Member of the Chinle Formation or Moenkopi Formation, and the middle to upper part of the Supai Group (fig. 2; Cooley and others, 1969). The primary aquifer unit is the Coconino Sandstone and its lateral equivalents (the DeChelly Sandstone and Glorieta Sandstone in New Mexico); however, the overlying Kaibab and Toroweap Formations and the underlying Schnebly Hill Formation and Upper and Middle Supai Formations of the Supai Group locally can be significant water producing units. In the western part of the C aquifer near Flagstaff, units above the Supai Group are dry; the water table of the C aquifer there is in the upper part of the Supai Group (Bills and others, 2000).
The Kaibab Formation is primarily a limestone with a thickness of as much as 650 ft. It is absent in the eastern and northern part of Little Colorado River Basin. The Toroweap Formation underlies the Kaibab Formation and comprises carbonate sandstone, red beds, silty sandstone, siltstone, limestone, and thin layers of gypsum. Similar to the Kaibab Formation, the Toroweap is absent in the eastern and northern parts of the Little Colorado River Basin.
The Coconino Sandstone is a white to tan to light brown, crossbedded, eolian, fine-grained quartz sandstone. This unit generally is 300 to 1,100 ft thick (Bills and others, 2000). It can be extensively fractured where faulted. These fractured zones are likely to be areas of high permeability.
The Schnebly Hill Formation comprises a sequence of reddish-brown to reddish-orange very fine to silty sandstone, mudstone, limestone, and dolomite (Blakey, 1990). The formation ranges in thickness from a few feet to as much as 800 ft and generally underlies the Coconino Sandstone; however, the contact between the two units can be gradational and intertonguing. Where saturated, the Schnebly Hill Formation is in hydraulic connection with the Coconino Sandstone.
The Supai Group was divided into the Upper, Middle, and Lower Supai Formations by Blakey (1990). The Upper Supai Formation is a complex series of horizontally bedded reddish to brown sedimentary units that are mostly fine-grained sandstone, siltstone, and mudstone. The Middle Supai Formation is a grayish-orange, calcareous, very fine grained sandstone to siltstone. The Lower Supai Formation is a red to purple sandstone and siltstone and gray limestone and dolomite. The Supai Group is typically 600 to 2,400 ft thick and is exposed in the southern and southwestern part of the study area. Where saturated, the Upper Supai Formation is the most permeable unit in the group. The Lower Supai Formation typically forms a confining unit that separates the C aquifer from underlying saturated units.
Aquifer Properties
Aquifer tests results reported for these sedimentary units in the vicinity of Flagstaff indicate a significant variability in rock fracturing leading to a range of transmissivities, hydraulic conductivities, and storage coefficients (Bills and others, 2000; Hoffmann and others, in press). Transmissivity and hydraulic conductivity values for the Coconino Sandstone generally were higher than the values for the Kaibab Formation, the Schnebly Hill Formation, and the Supai Group. Regardless of lithology, wells with the highest transmissivity and hydraulic conductivity values were coincident with the greatest degree of fracturing and the lowest values were coincident with areas of limited or no visible fracturing. Transmissivity values range from 10 to 4,700 ft2/d and hydraulic conductivity values range from 0.019 to 6.88 ft/d for the Flagstaff area. In addition to the values published by Bills and others (2000), Southwest Ground-water Consultants, Inc. (2003) compiled aquifer-parameter estimates of the C aquifer from multiple sources. These sources indicate a large variation in transmissivity estimates (1 to 13,000 ft2/d). The large variance is attributed to factors such as degree of fracturing and differences in the penetration depths of wells used for aquifer tests. Many of the wells were designed to meet small demands for water and therefore were drilled to a depth where the required yield could be obtained. In many cases these wells penetrate only a part of the total aquifer thickness, resulting in an underestimate of transmissivity. In addition to transmissivity, Southwest Ground-water Consultants, Inc. (2003) compiled estimates of hydraulic conductivity values from tests in the C aquifer (fig. 3).
In confined parts of the aquifer, the storage coefficient [dimensionless] is related to the compressibility of the rock matrix and water. In terms used by ground-water hydrologists, the storage coefficient, S, can be computed as 
(1)
where b [length] is aquifer thickness, and Ss [length-1] is total specific storage, which is the sum of Ssw and Ssk, the components of specific storage due to compressibility of water and the aquifer skeleton, respectively. Values of Ss can be estimated from well-designed aquifer tests and also from properties of water and rocks.
In unconfined parts of the area, the most important storage property is specific yield [dimensionless], which is a measure of the relative amount of water draining or filling pore spaces when the height of the water table changes. According to Bills and others (2000), the average of eight specific yield estimates derived from aquifer tests in the Flagstaff area was 0.077.
Several investigators (Mann, 1976; Daniel, 1981; Mann and Nemecek, 1983) have delineated areas where the C aquifer is confined and unconfined (fig. 3). For analyses of effects of withdrawal of water from the C aquifer, specific-yield values must be applied in areas where the aquifer is unconfined and storage coefficient values must be applied where the aquifer is confined. According to data compiled by Southwest Ground-water Consultants, Inc. (2003), the Coconino Sandstone responds to pumping as an unconfined or semiconfined aquifer, with storage properties of 0.07 for specific yield and 1 × 10⁻⁴ for the confined storage coefficient; however, there are few values of confined storage coefficient reported.
Ground-Water Flow and Discharge
Ground water flows from areas of recharge to areas of discharge. In the C aquifer, recharge occurs primarily in the southern part of the study area in the highlands north the Mogollon Rim, including the San Francisco volcanic field in the Flagstaff area, and on the Defiance Uplift in the eastern part of the area. From the recharge areas along the Mogollon Rim, some water flows to drainage basins south of the rim and some water flows northward, within the Little Colorado River drainage, ultimately toward the Blue Spring area. Ground water generally is unconfined in the southern and western parts of the aquifer (fig. 3) where the water table is below the elevation of the bottom of the Moenkopi Formation (fig. 2). The Moenkopi Formation comprises red to dark-red to reddish-brown siltstone, silty sandstone, fine- to very fine-grained sandstone, mudstone, and gypsum and is a confining layer in the north and east parts of the aquifer.
The primary discharge for the C aquifer in the Little Colorado River Basin is through a series of springs in the lower reaches of the Little Colorado River (Hart and others, 2002). The main spring is Blue Spring, which issues from solution channels in the Redwall-Muav aquifer in the lower reach of the Little Colorado River, about 13 mi upstream of the mouth of the river. The springs sometimes are collectively referred to as “Blue Springs.” Discharge from Blue Spring and other springs in the area is estimated to be approximately 164,000 acre-ft/yr (Hart and others, 2002). All this discharge is thought to be downward leakage from the C aquifer because the Redwall-Muav aquifer is deeply buried and does not crop out within the Little Colorado River Basin. An interpretation of the flow system is that water moves downward through the Supai Group through a series of normal faults (Cooley and others, 1969; Hart and others, 2002).
The Redwall-Muav aquifer comprises the Redwall and Muav Limestones, the Martin Formation, and other Devonian rock units, where present. The Redwall Limestone is a light-gray to gray aphanitic to coarsely crystalline bedded limestone. Some beds within the formation are fractured, and the limestone typically contains solution cavities and caverns, some of which have collapsed. The Muav Limestone is a dolomitic limestone. Thickness of the Redwall-Muav aquifer ranges from about 200 to more than 500 ft in the study area.
Ground water from the C aquifer also has historically discharged along or adjacent to various reaches of the Little Colorado River and its tributaries. The two tributary reaches of greatest interest for this study are the lower reaches of Clear and Chevelon Creeks. USGS streamflow-gaging stations were operated from 1906 to 1982 at Clear Creek near Winslow and from 1906 to 1972 at Chevelon Creek near Winslow. Few recent base-flow measurements exist along these creeks; however, measurements made in the summer of 2005 indicate base-flow values of about 5.6 and 2.7 ft3/s (a combined total of about 6,000 acre-ft/yr) in the lower reaches of Clear and Chevelon Creeks, respectively.

