Scientific Investigations Report 2006-5005
U.S. GEOLOGICAL SURVEY
Scientific Investigations Report 2006-5005
The National Marine Fisheries Service’s (NMFS) 2000 Biological Opinion on the operation of the Federal Columbia River Power System (National Marine Fisheries Service, 2000) includes a recommendation to the Bureau of Reclamation to monitor water-quality characteristics of surface-water irrigation return flows to the Columbia River at various points in the Columbia Basin Project (CBP) in central Washington State. The presence of selected pesticides in these return flows at levels that may harm or adversely affect salmon and steelhead species listed for protection under the Endangered Species Act was of specific interest to NMFS.
In cooperation with the Bureau of Reclamation, the U.S. Geological Survey (USGS) included the sampling of surface water in four irrigation return-flow drainage basins in the CBP as an ancillary project to the second phase of the Central Columbia Plateau-Yakima (CCYK) National Water-Quality Assessment (NAWQA) Program. The NAWQA program uses procedures for sampling and analyzing pesticides and other analytes of interest in surface water that assures high-quality, representative data for many commonly used pesticides, and using these same methods for additional CBP sites is beneficial to assure data comparability.
Water-quality samples collected from streamflow-gaging station sites in the Crab Creek, Sand Hollow, Red Rock Coulee, and Lind Coulee drainage basins from July 2002 through October 2004 were analyzed for a suite of 107 pesticides and pesticide metabolites (pesticide transformation products), as well as concentrations of major ions, trace elements, and nutrients. The data were used to describe the occurrence, distribution, and transport of pesticides in agricultural irrigation return-flow water in the four irrigation-return flow drainage basins. Pesticide concentrations were compared with drinking-water standards and aquatic-life benchmarks, and pesticide detections in samples from the irrigation-return flows was compared with historical data and related to current pesticide use, land use, and other environmental factors.
The purposes of this report are to (1) describe the occurrence, distribution, and transport of pesticides and pesticide metabolites in agricultural irrigation return-flow water in four drainage basins in the CBP; (2) describe the relation between pesticides detected in irrigation-return flows and current and historical pesticide use, land use, other environmental factors, and chemical properties of the pesticides; (3) discuss how measured pesticide concentrations compare with drinking-water standards and aquatic-life benchmarks; and (4) compare the results of this study with those from historical studies in the 1970s, 1990s, and the national NAWQA database. Four irrigation-return flow sites were sampled for pesticides 12 times from July 2002 through October 2004. Ten samples were collected throughout the irrigation season (generally April through October) and two samples were collected during the non-irrigation season.
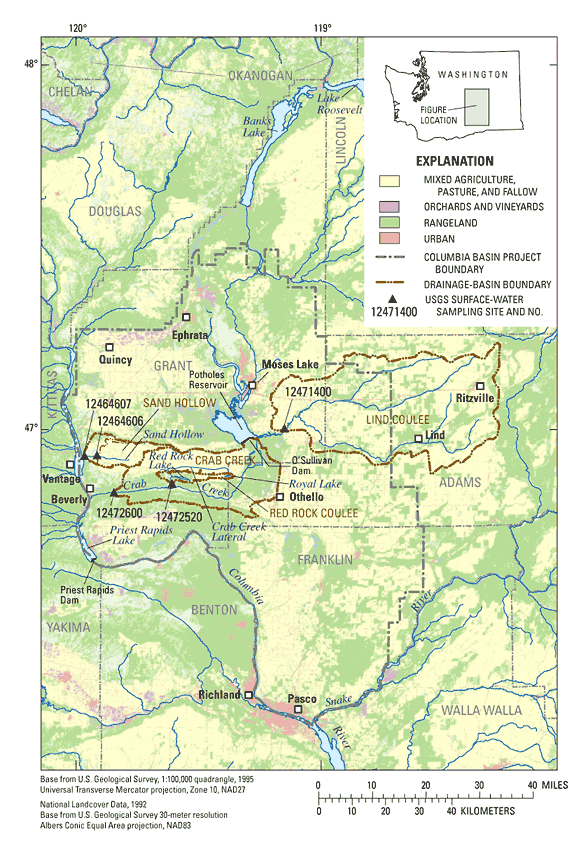
The CBP is a multi-purpose project providing irrigation water to agricultural land in the Columbia River basin in central Washington (fig. 1). The CBP drainage area is more than 4,000 mi2 and is bounded on the west by the Columbia River and on the south by the Snake River, and it extends east and north to include all lands considered economically irrigable from the project canal system (Bureau of Reclamation, 1982). Main geohydrologic units in the CBP are the Columbia Plateau River Basalt Group, extrusions of basalt lava that formed the Columbia Plateau between 6 and 16.5 million years ago, and the overlying deposits of unconsolidated sediment (Drost and others, 1990). Columbia Plateau River Basalt Group flows are estimated to be more than 14,000 ft thick near Pasco, Washington. Parts of the CBP also contain loess, a wind-deposited silt, and sand dunes typified by those at Potholes Reservoir.
Major land use and economy in the CBP is agriculture, followed by livestock production and food processing. The land is primarily rural, but five towns in the CBP area have populations greater than 5,000: Pasco, Othello, Moses Lake, Ephrata, and Quincy. Pasco is the largest town, with a population of about 32,000 (U.S. Census Bureau, 2004). Climate in the CBP is semiarid, with about 6 to 10 in. of annual precipitation, and air temperatures range from below freezing in winter to more than 38°C at times during summer.
The CBP has few natural perennial streams, and streamflow in the project area is augmented and indirectly regulated by seasonal delivery of irrigation water (generally April to October) to the area. Irrigation water is pumped from Lake Roosevelt, stored in Banks Lake, and distributed throughout the CBP by a network of re-regulation reservoirs and conveyance canals to irrigated lands. Surface-water drainages from irrigated lands lead to wasteway returns that create irrigation-return flows to major streams and rivers. The large quantities of irrigation water delivered to farm units in the CBP indirectly control the irrigation-return flow in the four drainage basins studied in the project area during the irrigation season (table 1). Water samples were collected at USGS streamflow-gaging stations in the study basins, and continuous streamflow data were available only for Crab Creek and Lind Coulee.
[USGS, U.S. Geological Survey; ft3/s, cubic feet per second; mi2, square mile; S, south; Rd, Road; SW, Southwest; SR, State Route; >, greater than]
| Irrigation return-flow basin | Sampling site | Short name | Number of samples | Streamflow at time of sampling (ft3/s) | Drainage area (mi2) | Harvested cropland area(mi2) | Percentage of harvested cropland | Percentage of irrigated cropland | |||
|---|---|---|---|---|---|---|---|---|---|---|---|
| USGS gaging station No. and name | Median | Minimum | Maximum | ||||||||
| Crab Creek | 12472600 | Crab Creek near Beverly | Crab Creek | 12 | 214 | 129 | 331 | 1296 | 103 | 35 | >95 |
| Lind Coulee | 12471400 | Lind Coulee Wasteway at SR 17, near Warden | Lind Coulee | 12 | 255 | 58 | 355 | 710 | 533 | 75 | 30 |
| Red Rock Coulee | 12472520 | Red Rock Coulee near Smyrna | Red Rock Coulee | 12 | 71.5 | 43 | 114 | 19 | 9 | 47 | >95 |
| Sand Hollow | 12464606 | Sand Hollow at S Rd SW, near Vantage | Sand Hollow at S Rd | 1 | 79 | 79 | 79 | 43 | 36 | 70 | >95 |
| 12464607 | Sand Hollow at mouth, near Vantage | Sand Hollow | 11 | 94 | 23 | 141 | 60 | 42 | 84 | >95 | |
1Drainage area is for Lower Crab Creek; the entire Crab Creek drainage area is 4,840 mi2.
Crab Creek irrigation-return drainage basin covers 296 mi2, and water samples were collected at gaging station 12472600, near Beverly (fig. 1). Before water was diverted from Lake Roosevelt for irrigation, Crab Creek was one of the few perennial streams in the CBP and flowed from the northeastern Columbia Plateau, about 3 mi east of Reardan, southwest to where it empties into the Columbia River near Beverly, Washington. Drifting sand dunes impounded Crab Creek and created Moses Lake, the largest natural lake in the CBP (Walters and Grolier, 1960). Construction of O’Sullivan Dam formed Potholes Reservoir, creating a central point in the CBP for storage of excess canal water, natural runoff, and irrigation-return flow and redistribution of water for irrigation reuse in the southern part of the CBP. The entire length of Crab Creek drains 4,840 mi2, but Moses Lake and Potholes Reservoir hydrologically separate the stream into Upper Crab Creek, the stretch from the headwaters to Moses Lake, and Lower Crab Creek, the stretch from O’Sullivan Dam to the mouth that includes the Crab Creek study basin. Potholes Reservoir has no perennial outlet to Lower Crab Creek, and most water in Lower Crab Creek comes from Goose Lake Wasteway. Hansen and others (1994) calculated average ground-water discharge to Lower Crab Creek as 76.3 ft3/s prior to irrigation development and 145.1 ft3/s for 1983–85. Therefore, water at the Crab Creek site near Beverly is directly affected by ground-water seepage from Potholes Reservoir and from tributary inflow downstream of O’Sullivan Dam.
Sand Hollow drains the western flanks of Royal Slope and flows west, emptying into the Columbia River across from Vantage, Washington. Sand Hollow irrigation-return drainage basin covers 60 mi2 and represents a drainage basin of varied agricultural land uses that is irrigated primarily by surface water. The first water sample from Sand Hollow during this study was collected at S Road SW at gaging station 12464606 (fig. 1). Historical data were collected at this site by NAWQA during the 1990s. The drainage area at this site is 43 mi2. All subsequent samples for this study were collected at the mouth at gaging station 12464607 (fig. 1), where one water sample was collected by the USGS in 1991 and sediment samples were collected in 1992. Although a minor tributary flows into Sand Hollow in the 3 mi between S Road SW and the mouth, land use is the same for the entire basin and data from both sampling sites are treated as one for data analysis in this study.
Red Rock Coulee drains about 19 mi2 of irrigated agricultural land, beginning near the eastern boundary of Grant County, just north of Royal Lake, and flowing west to Red Rock Lake (fig. 1). Red Rock Coulee flows out of Red Rock Lake, passes through a culvert beneath county road E SW, flows south about 2.5 mi before crossing beneath county road E SW again, and continues another mile before emptying into Crab Creek. During this study, samples were collected from Red Rock Coulee downstream of the second culvert at gaging station 12472520, but during the NAWQA program, in 1994, one sample was collected about 1 mi upstream.
The headwaters of Lind Coulee combine with the flow of several smaller coulees south of Ritzville, and the main branch flows east through the town of Lind before joining with Weber Coulee and flowing another 5 mi to empty into Potholes Reservoir. Weber Coulee combines the flow from Bauer Coulee and Farrier Coulee, and the entire Lind Coulee basin drains about 710 mi2. Samples from Lind Coulee were collected at gaging station 12471400, about 1 mi downstream of the State Highway 17 crossing.
Agriculture crop acreage in the four irrigation-return flow drainage basins varies from year to year. Orchards usually are a long-term crop, but many field crops are rotated frequently. One primary rotation in the CBP is between alfalfa, corn, and potatoes. Estimates of agricultural acreage for 2003 in the four irrigation-return flow basins were used to describe the agricultural land use during this study (table 2; Patricia Daly, Franklin County Conservation District, written commun., 2004). Percentage of agricultural harvested cropland varies from year to year, but ranged from 35 percent in Crab Creek basin to a maximum of 75 percent in Lind Coulee basin during this study. Harvested cropland was 47 percent in Red Rock Coulee basin and 70 percent in Sand Hollow basin during the current study. Most agricultural cropland in Red Rock Coulee, Sand Hollow, and Crab Creek drainage basins is irrigated, but only 30 percent of the crop acreage in Lind Coulee is irrigated (table 1). Alfalfa is the largest percentage of crop acreage in Crab Creek drainage basin, followed by orchards and irrigated wheat. Peas, corn, and potatoes are nearly 20 percent of crop acreage in the Crab Creek drainage basin (table 2). Nearly one-third of the crop acreage in Lind Coulee is in dryland wheat, and more than one-third of the acreage is fallow land. Minor percentages of the acreage in Lind Coulee drainage basin are in alfalfa, potatoes, and peas. The largest percentage of crop acreage in Red Rock Coulee drainage basin is alfalfa, followed by onions and orchards. Peas and irrigated wheat make up about 15 percent of the total agricultural acreage. The largest percentage of crop acreage in Sand Hollow also is alfalfa, followed by orchards. Peas and irrigated wheat make up about 30 percent of the total agricultural acreage, followed by minor percentages of grass, potatoes, and mint.
[Data for crop-acreage estimates provided by Franklin County Conservation District (Patricia Daly, written commun., 2004). Percentage of crop acreage: may not add to 100 percent due to rounding. <, less than]
| Crop | Acres | Percentage of crop acreage |
|---|---|---|
| Crab Creek | ||
| Alfalfa | 24,292 | 37 |
| Orchard | 13,999 | 21 |
| Wheat (irrigated) | 6,662 | 10 |
| Pea | 5,172 | 8 |
| Corn | 3,666 | 6 |
| Potato | 3,600 | 5 |
| Unclassified | 2,598 | 4 |
| Grass | 1,814 | 3 |
| Onion | 1,603 | 2 |
| Wheat (dryland) | 1,189 | 2 |
| Mint | 983 | 1 |
| Timothy | 162 | <1 |
| Fallow | 98 | <1 |
| Lind Coulee | ||
| Fallow | 119,929 | 35 |
| Wheat (dryland) | 116,713 | 34 |
| Wheat (irrigated) | 33,835 | 10 |
| Alfalfa | 17,899 | 5 |
| Potato | 15,238 | 4 |
| Unclassified | 13,646 | 4 |
| Corn | 9,667 | 3 |
| Pea | 8,074 | 2 |
| Orchard | 4,206 | 1 |
| Onion | 1,183 | <1 |
| Grass | 686 | <1 |
| Red Rock Coulee | ||
| Alfalfa | 3,345 | 57 |
| Onion | 682 | 12 |
| Orchard | 536 | 9 |
| Wheat (irrigated) | 449 | 8 |
| Pea | 428 | 7 |
| Potato | 129 | 2 |
| Corn | 122 | 2 |
| Unclassified | 116 | 2 |
| Grass | 105 | 2 |
| Sand Hollow | ||
| Alfalfa | 7,610 | 28 |
| Orchard | 4,746 | 18 |
| Pea | 4,091 | 15 |
| Wheat (irrigated) | 4,001 | 15 |
| Grass | 2,378 | 9 |
| Potato | 1,216 | 5 |
| Mint | 1,070 | 4 |
| Corn | 602 | 2 |
| Unclassified | 601 | 2 |
| Fallow | 181 | 1 |
| Wheat (dryland) | 164 | 1 |
| Onion | 125 | <1 |
The authors are grateful for the technical reviews by Frank Rinella (USGS, Portland, Oreg.), Angela Crain (USGS, Louisville, Ky.), and Bryan Horsburgh (Bureau of Reclamation, Boise, Idaho). We are grateful for the technical advice on aquatic toxicity from Patrick Moran (USGS, Tacoma, Wash.), Lisa Nowell (USGS, Sacramento, Calif.), and Mark Schneider (National Oceanographic and Atmospheric Administration Fisheries, Portland, Oreg.); for the agricultural crop acreages data provided by Patricia Daly (Franklin County Conservation District); and to Gina Hoff (Bureau of Reclamation, Ephrata, Wash.), Elizabeth Jordan (Quincy Basin Irrigation District, Quincy, Wash.), and Elaine Fuller (East Columbia Basin Irrigation District, Othello, Wash.), for non-agricultural aquatic herbicide application data. The contribution by Theresa Olsen (USGS, Tacoma, Wash.) to GIS illustrations and to analysis of crop pesticide-application data was invaluable. We are grateful to Dwight Copeland and Douglas Call (USGS, Pasco, Wash.), Brett Smith and Galen Schuster (USGS, Spokane, Wash.), and Richard Cornet (Bureau of Reclamation, Ephrata, Wash.) for their assistance in collecting samples for this study.
For more information about USGS activities in Washington, visit the USGS Washington Water Science Center home page .

![]() U.S. Department of the Interior |
U.S. Geological Survey
U.S. Department of the Interior |
U.S. Geological Survey
Persistent URL: https://pubs.water.usgs.gov/sir20065005
Page Contact Information: Publications Team
Page Last Modified: Thursday, 01-Dec-2016 18:54:02 EST
