Scientific Investigations Report 2006-5005
U.S. GEOLOGICAL SURVEY
Scientific Investigations Report 2006-5005
All samples were analyzed for concentrations of pesticides, major ions, iron, manganese, and nutrients. Summaries of results for inorganic constituents and pesticides are presented. Estimates of pesticide use are discussed and compared in relation to detected and non-detected pesticides, and a comparison is made between pesticides detected in this study and pesticides detected in earlier studies.
Water temperature, pH, DO concentrations, specific conductance and concentrations of major ions, trace elements, and nutrients data were measured at all sampling sites where pesticide data were collected (table 5). Water-temperature measurements are subject to the water-temperature criteria for core and non-core designated use by fish in the Washington 2003 water-quality standards (State of Washington, 2003). (The term “non-core” to refers to “salmon and trout spawning, non-core rearing, and migration” designated use and “core” refers to the “salmon and trout spawning, core rearing, and migration” designated use.) The criteria specify that water temperature be measured by the 7-day average of daily maximum temperatures (7DADMax; State of Washington, 2003), but extended deployment of temperature sensors and calculation of a 7-day average of maximum temperatures were beyond the scope of this study. Water temperatures measured during this study are only an indication of instantaneous temperatures at time of sampling and indicate that the temperature criterion may have been exceeded.
[Dissolved solids, residue on evaporation, dried at 180 degrees Celsius. Abbreviations: ft3/s, cubic foot per second; ºC; degrees Celsius; µS/cm, microsiemens per centimeter; mg/L, milligram per liter; CaCO3, calcium carbonate; µg/L, microgram per liter; E, estimated (below laboratory reporting level); <, less than]
| Constituent or property | Number of samples | Value | ||
|---|---|---|---|---|
| Minimum | Maximum | Median | ||
| Crab Creek | ||||
| Field measurements | ||||
| Streamflow (ft3/s) | 12 | 129 | 331 | 214.5 |
| Temperature (ºC) | 12 | 4.9 | 22.4 | 15.05 |
| pH (standard units) | 12 | 8.1 | 8.6 | 8.4 |
| Specific conductance (µS/cm) | 12 | 492 | 885 | 540 |
| Dissolved oxygen (mg/L) | 12 | 8.6 | 12.6 | 10.45 |
| Major ions | ||||
| Calcium (mg/L) | 12 | 33.1 | 52.6 | 37.95 |
| Magnesium (mg/L) | 12 | 20.4 | 32.6 | 21.45 |
| Sodium, (mg/L) | 12 | 38.2 | 84.9 | 46.4 |
| Potassium, (mg/L) | 12 | 5.97 | 12.1 | 7.22 |
| Chloride (mg/L) | 12 | 12.8 | 29.6 | 14.9 |
| Sulfate (mg/L) | 12 | 46.8 | 100 | 51.95 |
| Fluoride (mg/L) | 12 | .48 | .83 | .50 |
| Silica (mg/L) | 12 | 15.6 | 35.0 | 22.55 |
| Alkalinity (mg/L as CaCO3) | 8 | 182 | 307 | 209 |
| Dissolved solids (mg/L) | 12 | 305 | 560 | 333.5 |
| Trace elements | ||||
| Iron (µg/L) | 12 | 5.0 | 27 | 8.5 |
| Manganese (µg/L) | 12 | 2.3 | 8.3 | 3.6 |
| Nutrients | ||||
| Ammonia (mg/L as N) | 12 | <.010 | .03 | .010 |
| Ammonia plus organic nitrogen (mg/L as N) | 12 | .04 | .88 | .355 |
| Nitrite plus nitrate (mg/L as N) | 12 | 1.05 | 2.5 | 1.56 |
| Phosphorus (mg/L as P) | 12 | .024 | .099 | .034 |
| Orthophosphate (mg/L as P) | 12 | <.003 | .071 | .016 |
| Lind Coulee | ||||
| Field measurements | ||||
| Streamflow (ft3/s) | 12 | 58 | 355 | 255 |
| Temperature (ºC) | 12 | 8.1 | 19.8 | 14.85 |
| pH (standard units) | 12 | 8.1 | 8.8 | 8.4 |
| Specific conductance (µS/cm) | 12 | 203 | 573 | 292 |
| Dissolved oxygen (mg/L) | 11 | 10.6 | 14.5 | 11.4 |
| Major ions | ||||
| Calcium (mg/L) | 12 | 22.5 | 46.9 | 28.45 |
| Magnesium (mg/L) | 12 | 6.56 | 19.6 | 9.69 |
| Sodium, (mg/L) | 12 | 9.36 | 51.8 | 16.4 |
| Potassium, (mg/L) | 12 | 1.62 | 6.18 | 2.575 |
| Chloride (mg/L) | 12 | 2.95 | 15.7 | 5.4 |
| Sulfate (mg/L) | 12 | 15.0 | 65.9 | 22.25 |
| Fluoride (mg/L) | 12 | <.2 | .7 | .29 |
| Silica (mg/L) | 12 | 9.49 | 42.6 | 13.4 |
| Alkalinity (mg/L as CaCO3) | 8 | 81 | 204 | 105.5 |
| Dissolved solids (mg/L) | 12 | 124 | 391 | 186 |
| Trace elements | ||||
| Iron (µg/L) | 12 | <10 | 16 | 9.0 |
| Manganese (µg/L) | 12 | 5.90 | 21.5 | 14.2 |
| Nutrients | ||||
| Ammonia (mg/L as N) | 12 | <.01 | .02 | .02 |
| Ammonia plus organic (mg/L as N) | 12 | .15 | .28 | .205 |
| Nitrite plus nitrate (mg/L as N) | 12 | .56 | 5.02 | 1.735 |
| Phosphorus (mg/L as P) | 12 | .027 | .079 | .050 |
| Orthophosphate (mg/L as P) | 12 | .017 | .057 | .030 |
| Red Rock Coulee | ||||
| Field measurements | ||||
| Streamflow (ft3/s) | 12 | 43 | 114 | 71.5 |
| Temperature (ºC) | 12 | 4.6 | 23.1 | 16.55 |
| pH (standard units) | 12 | 8.2 | 8.9 | 8.55 |
| Specific conductance (µS/cm) | 12 | 374 | 660 | 420 |
| Dissolved oxygen (mg/L) | 12 | 8.3 | 12.7 | 9.85 |
| Major ions | ||||
| Calcium (mg/L) | 12 | 21.3 | 53.8 | 37.05 |
| Magnesium (mg/L) | 12 | 16.6 | 29.8 | 18.45 |
| Sodium, (mg/L) | 12 | 17.8 | 38.6 | 22.1 |
| Potassium, (mg/L) | 12 | 2.02 | 3.55 | 2.705 |
| Chloride (mg/L) | 12 | 9.03 | 19.3 | 11.0 |
| Sulfate (mg/L) | 12 | 31.5 | 63.9 | 36.4 |
| Fluoride (mg/L) | 12 | .3 | .6 | .4 |
| Silica (mg/L) | 12 | 19.3 | 40.8 | 23.5 |
| Alkalinity (mg/L as CaCO3) | 8 | 137 | 224 | 155.5 |
| Dissolved solids (mg/L) | 12 | 230 | 411 | 266 |
| Trace elements | ||||
| Iron (µg/L) | 12 | <6.0 | 6.0 | 5.0 |
| Manganese (µg/L) | 12 | <2.0 | 3.4 | 1.8 |
| Nutrients | ||||
| Ammonia (mg/L as N) | 12 | <.01 | .05 | .02 |
| Ammonia plus organic (mg/L as N) | 12 | .20 | .36 | .285 |
| Nitrite plus nitrate (mg/L as N) | 12 | 1.72 | 5.5 | 2.195 |
| Phosphorus (mg/L as P) | 12 | .019 | .036 | .023 |
| Orthophosphate (mg/L as P) | 12 | <.003 | .016 | .006 |
| Sand Hollow | ||||
| Field measurements | ||||
| Streamflow (ft3/s) | 12 | 23 | 141 | 92 |
| Temperature (ºC) | 12 | 8.1 | 22.0 | 13.7 |
| pH (standard units) | 12 | 8.1 | 8.6 | 8.45 |
| Specific conductance (µS/cm) | 12 | 141 | 719 | 336.5 |
| Dissolved oxygen (mg/L) | 12 | 8.4 | 12.0 | 10.55 |
| Major ions | ||||
| Calcium (mg/L) | 12 | 27.6 | 76.3 | 35.8 |
| Magnesium (mg/L) | 12 | 9.79 | 36.1 | 14.1 |
| Sodium, (mg/L) | 12 | 9.0 | 29.1 | 12.65 |
| Potassium, (mg/L) | 12 | 1.18 | 2.51 | 1.57 |
| Chloride (mg/L) | 12 | 5.04 | 27.9 | 9.32 |
| Sulfate (mg/L) | 12 | 16.9 | 66.1 | 25.05 |
| Fluoride (mg/L) | 12 | .17 | .50 | .23 |
| Silica (mg/L) | 12 | 9.8 | 43.9 | 17.35 |
| Alkalinity (mg/L as CaCO3) | 8 | 89 | 106 | 124.5 |
| Dissolved solids (mg/L) | 12 | 167 | 491 | 213.5 |
| Trace elements | ||||
| Iron (µg/L) | 12 | E4 | <10 | <6 |
| Manganese (µg/L) | 12 | E.70 | E2.5 | 1.15 |
| Nutrients | ||||
| Ammonia (mg/L as N) | 12 | <.01 | .07 | .02 |
| Ammonia plus organic (mg/L as N) | 12 | .06 | .45 | .235 |
| Nitrite plus nitrate (mg/L as N) | 12 | 2.46 | 17.9 | 4.515 |
| Phosphorus (mg/L as P) | 12 | <.010 | .052 | .023 |
| Orthophosphate (mg/L as P) | 12 | <.003 | .027 | .006 |
Measured water temperature was greater than the State of Washington criterion of 16ºC for core rearing, salmon and trout spawning, and migration in 18 instances. These exceedances occurred 7 times at Red Rock Coulee, 5 times at Crab Creek, 4 times at Lind Coulee, and 2 times at Sand Hollow. In 11 of these 18 instances, measured temperature also was greater than the criterion of 17.5ºC for non-core rearing, salmon and trout spawning, migration, and salmon and trout rearing and migration only.
The State of Washington aquatic-life criteria for DO are listed as 1-day minimum. The criterion of 9.5 mg/L for salmon and trout spawning, core rearing, and migration was exceeded eight times at three sites during this study from June to early October: two times at Sand Hollow, three times at Red Rock Coulee, and three times at Crab Creek. State of Washington aquatic-life criterion for pH of 8.5 for fresh water was exceeded 12 times: 6 times at Red Rock Coulee, 3 times at Sand Hollow, 2 times at Lind Coulee, and 1 time at Crab Creek.
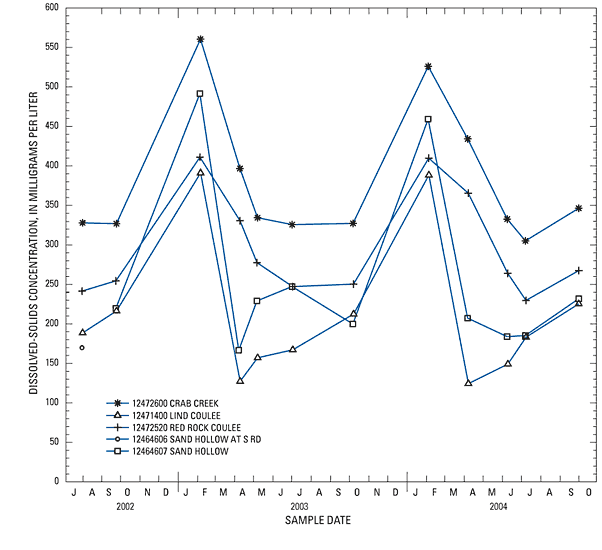
Dissolved-solids concentrations varied spatially and seasonally. Dissolved-solids concentrations increased during the non-irrigation season and concentrations between sites generally increased as water moved through the CBP, from Lind Coulee down to Crab Creek (fig. 2). Average concentration of dissolved solids at Lind Coulee during this study was 211 mg/L, increasing to an average of 379 mg/L in samples from Crab Creek. Average concentrations from intermediate sites at Sand Hollow and Red Rock Coulee were 250 and 296 mg/L, respectively. Dissolved-solids concentrations increased during the non-irrigation season, reflecting a larger ground-water contribution to base flow. Average dissolved-solids concentration at all sites was 249 mg/L during irrigation season and 454 mg/L during non‑irrigation season.
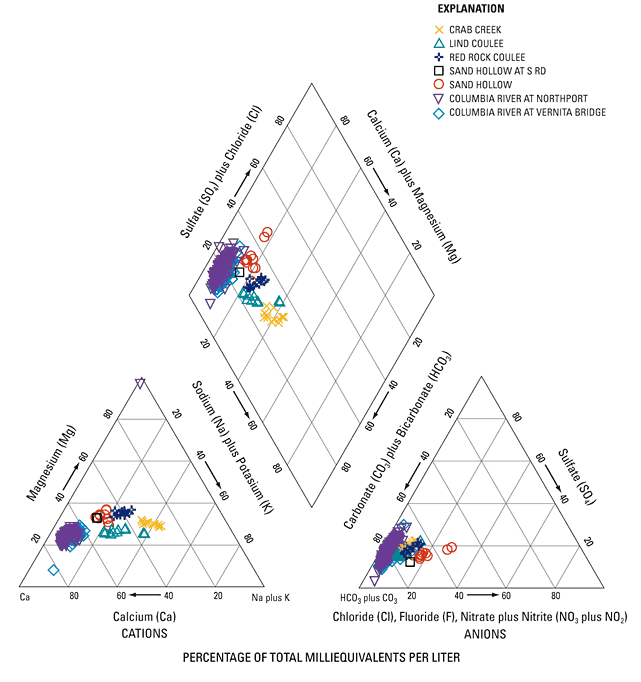
The predominant major ions from all sites generally were from calcium, magnesium, and bicarbonate (fig. 3). Although some overlap was present between the major-ion characteristics of the four sites, each site generally was grouped differently on a major-ion diagram and all were uniquely different from the irrigation source water, represented by the Columbia River. Additionally, samples from Sand Hollow and Lind Coulee during the non-irrigation season were clearly differentiated from samples collected during the irrigation season. Anions for all samples were predominantly from bicarbonate and cations were predominantly from calcium. During the irrigation season, calcium was the predominant cation for both sites. However, during the non‑irrigation, concentrations of chloride and nitrate increased in samples from Sand Hollow and reflect a shift in the percentage of chloride, fluoride, and nitrite plus nitrate. Similarly, the percentage of sulfate plus chloride for Sand Hollow also increased during the non-irrigation season. Samples from Lind Coulee during the non-irrigation season also are readily differentiated from irrigation season samples because of an increase in sodium plus potassium during the non-irrigation season. However, the percentage of nitrite plus nitrate for samples from Sand Hollow nearly doubled during the non-irrigation season and the percentages of sulfate and chloride increased. Similarly, samples from Lind Coulee during the non-irrigation season were clearly differentiated from samples collected during the irrigation season because of a shift in the cation percentages, with less calcium and more sodium.
Site 12464606 was sampled only once in July 2002, and all other samples for Sand Hollow drainage basin were from site 12464607.
Generally, the ratio of dissolved solids divided by specific conductance is a well-defined relation (Hem, 1985) for many rivers and streams. Because no long-term data for irrigation source water (from Lake Roosevelt or Banks Lake) are publicly available, historical information for the Columbia River above Lake Roosevelt (at Northport, Wash.) and downstream of Lake Roosevelt (near Priest Rapids Dam) can be used to approximate the quality of irrigation source water. The median ratio of dissolved solids to specific conductance ranges from 0.58 to 0.64 for the sites in the four irrigation return-flow basins and the Columbia River sites (table 6). However, the relation between silica and calcium provides an even better “signature” of major ions in the irrigation return flow (table 17). The long-term median silica-calcium ratios for the sites at Columbia River at Northport and Priest Rapids Dam are 0.23 and 0.26, respectively. As the irrigation water flows through the CBP, the ratio in samples increases, reflected by the higher ratios. Although ranges of the ratio overlap, each individual sample ratio was uniquely different from the others during that sampling period. Major-ion, trace-element, and nutrient concentrations generally were within State and Federal criteria. Concentrations of nitrite plus nitrate in two samples collected from Sand Hollow during the non‑irrigation season exceeded the U.S. Environmental Protection Agency (USEPA) Maximum Contaminant Level (MCL) for drinking water of 10 mg/L.
[Columbia River data are from 1960–2000. The Sand Hollow sites were combined for analysis. Abbreviations: SiO2/Ca: ratio of silica and calcium; Dissolved solids/SC, ratio of dissolved solids and specific conductance in microsiemens per centimeter at 25 degrees Celsius]
| Sampling site | SiO2/Ca | Dissolved solids/SC | |||||
|---|---|---|---|---|---|---|---|
| Minimum | Maximum | Median | Minimum | Maximum | Median | ||
| Crab Creek | 0.44 | 0.69 | 0.59 | 0.60 | 0.66 | 0.62 | |
| Lind Coulee | .40 | .91 | .70 | .59 | .77 | .64 | |
| Red Rock Coulee | .53 | .76 | .64 | .57 | .68 | .62 | |
| Sand Hollow | .36 | .58 | .49 | .57 | .70 | .62 | |
| Columbia River at Northport | .15 | .67 | .23 | .33 | .89 | .58 | |
| Columbia River at Vernita Bridge, near Priest Rapids Dam | .19 | .57 | .26 | .46 | .80 | .58 | |
Forty-two pesticides and five metabolites were detected in samples from the four irrigation return-flow drainage basins in the CBP from July 2002 to October 2004 (table 7). The greatest number of compounds, 37, was detected at Sand Hollow, followed by 33 at Lind Coulee, 30 at Red Rock Coulee, and 28 at Crab Creek. Herbicides were the most frequently detected pesticides, followed by insecticides, metabolites, and fungicides. Atrazine, bentazon, diuron, and 2,4-D were the most frequently detected herbicides, and chlorpyrifos and azinphos-methyl were the most frequently detected insecticides. Of the five metabolites detected, four were degradation products of triazine herbicides and one was the degradation product of DCPA (dacthal monoacid). CIAT (commonly referred to as deethylatrazine), CEAT, CAAT, and OIET were the most frequently detected metabolites.
Pesticide concentrations in samples from the CBP did not exceed any drinking-water standards or guidelines, but concentrations of three insecticides and one herbicide did exceed USEPA or Canadian freshwater aquatic-life benchmarks (table 8). Concentrations of the insecticide azinphos-methyl exceeded USEPA recommended chronic water-quality criterion for the protection of freshwater aquatic life of 0.01 µg/L at least once at each of the four sites. Concentrations in samples from Sand Hollow also exceeded USEPA recommended freshwater chronic criterion for the protection of freshwater aquatic life for chlorpyrifos (0.041), and Canadian guidelines for the protection of freshwater aquatic life for lindane and dinoseb (0.01, and 0.05 µg/L, respectively). Water-quality aquatic-life benchmarks generally were exceeded in June and July, during the middle of the irrigation season, except the criterion for dinoseb, which was exceeded in one sample during non-irrigation season in February 2003, at a concentration of 0.14 µg/L.
Pesticides can be toxic to aquatic life in streams, and the ECOTOX (ECOTOXicology) database (U.S. Environmental Protection Agency, 2005a) provides single-chemical toxicity information for aquatic freshwater life (table 9). Data retrieved from ECOTOX contained a substantial number of apparent duplicate entries (Munn and Gilliom, 2001, and Patrick Moran, U.S. Geological Survey, oral commun., November 2005), and these were removed. Because of the complex mixtures and seasonal patterns of pesticides, it is difficult to link chemical conditions in streams to effects on aquatic biota (Munn and Gilliom, 2001). The endpoint concentration for comparison of aquatic toxicity to fish used in this study is median lethal concentrations (LC50), which is a statistically estimated concentration that is expected to be lethal to 50 percent of a group of organisms tested. LC50 for all pesticides analyzed during this study are far greater than concentrations detected in samples collected from irrigation-return flows during this study. However, data are not available for all pesticides, and additive or possible synergistic effects of multiple chemicals are not accounted for by this measure of aquatic toxicity. The most toxic insecticides analyzed during this study are azinphos-methyl, chlorpyrifos, lindane, and malathion, with LC50 values that range from 1.3 to 2.4 µg/L. Concentrations of pesticides analyzed during this study are far less than these LC50 concentrations. The most toxic herbicides were trifluralin, pendimethalin, ethalfluvalin, and diacamba, with LC50 values that range from 8.4 to 138 µg/L. LC50 values for specific pesticides are a factor of 110 greater than maximum concentrations of pesticides detected in samples from the four drainage basins during this study. Munn and Gilliom (2001) suggest use of a pesticide toxicity index (PTI), which is the sum of toxicity quotients for each compound measured in a stream. This approach may be useful in relating pesticide toxicity between drainage basins and over time, but it is beyond the scope of this study.
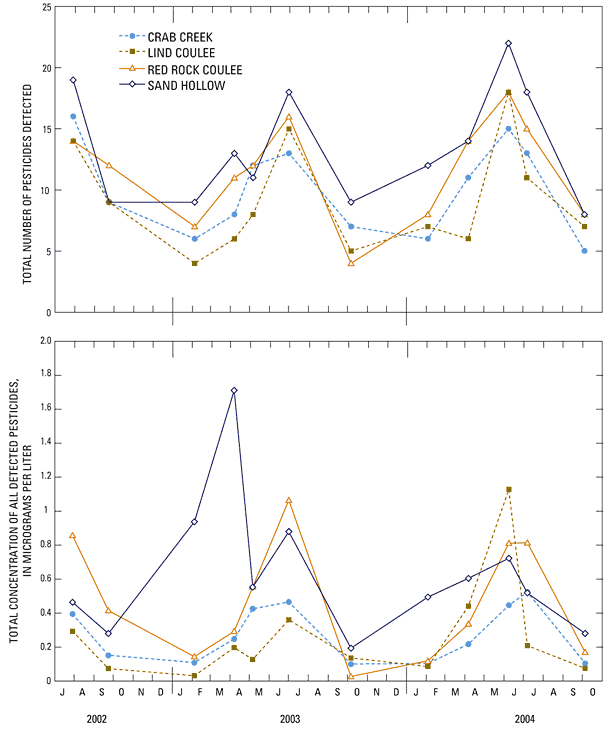
Total number of pesticide detections and total concentrations of those detections show a distinct seasonal pattern at the four sites, with the highest number of detections and total concentrations during the middle of the irrigation season, April to October (fig. 4). Samples from Sand Hollow basin generally had the greatest number of pesticides per sample, ranging from about 8 pesticides detected in a sample during the end of irrigation season to more than 20 pesticides detected in samples collected during the middle of irrigation season. Samples from Lind Coulee basin had the fewest number of pesticides per sample, ranging from 4 to 18 pesticides with the highest number also occurring during the middle of irrigation season.
The pattern for total pesticides concentrations for Sand Hollow basin was slightly different than those for the other three basins, with a substantially higher total concentration in the sample collected during the 2003 non-irrigation season. This may be an aberration that occurred only in 2003, but it likely is due to the increase in concentrations of atrazine, CIAT, bentazon, and bromacil during base-flow conditions in the non-irrigation season. Total pesticide concentrations in the sample collected during the 2004 non-irrigation season were higher than those in late-irrigation season samples, but it is not clear why the 2003 non-irrigation sample was substantially higher. The increase in concentration of these compounds during base flow indicates that ground water contributes a substantial part of the pesticide load for these compounds. Further study of pesticides in the irrigation return-flow drainage basins during the non-irrigation season would be helpful.
[All concentrations are in micrograms per liter. Concentrations in bold represent values that exceed freshwater aquatic-life benchmarks (see table 4). Pesticide: CIAT, 2-chloro-4-isopropylamino-6-amino-s-triazine; CEAT, 2-chloro-6-ethylamino-4-amino-s-tirazine; CAAT, chlorodiamino-s-triazine; OIET, 2-hydroxy-4-isopropylamino-t-ethylamino-s-triazine. Type of pesticide: F, fungicide; H, herbicide; I, insecticide; S, stimulant; T, transformation product. Number of detections: All, sum of all detections at all surface-water sites. Abbreviations: LRL, laboratory reporting level; SH, Sand Hollow; LCWA, Lind Coulee; CRCR, Crab Creek; RRCU, Red Rock Coulee; M, presence of material verified but not quantified; E, because recovery or variation in recovery was outside the acceptable range, compound is qualified with an E-code (estimated) or concentration reported is less than laboratory reporting level and is qualified as estimated; –, not detected]
| Pesticide | Type of pesticide | LRL | Maximum concentration | Number of detections | All | |||||||
|---|---|---|---|---|---|---|---|---|---|---|---|---|
| SH | LCWA | CRCR | RRCU | SH | LCWA | CRCR | RRCU | |||||
| Atrazine1 | H | 0.007 | 0.029 | 0.012 | 0.026 | 0.032 | 11 | 10 | 12 | 12 | 45 | |
| CIAT1 | T | .006 | E.036 | E.009 | E.019 | E.015 | 11 | 9 | 12 | 12 | 44 | |
| Bentazon | H | .012 | E.25 | E.01 | E.04 | E.07 | 12 | 6 | 12 | 11 | 41 | |
| Diuron | H | .014 | E.22 | .26 | .10 | .11 | 10 | 10 | 10 | 10 | 40 | |
| 2,4-D | H | .038 | .23 | .44 | .36 | .77 | 10 | 8 | 11 | 10 | 39 | |
| Simazine | H | .005 | .213 | .024 | .017 | .022 | 7 | 1 | 9 | 10 | 27 | |
| Terbacil1 | H | .034 | E1.01 | – | E.061 | E.075 | 12 | 0 | 6 | 7 | 25 | |
| DCPA | H | .003 | .011 | .044 | .05 | .169 | 4 | 7 | 6 | 7 | 24 | |
| EPTC | H | .004 | .085 | .12 | .075 | .1 | 4 | 4 | 7 | 8 | 23 | |
| Bromacil | H | .018 | E.12 | E.13 | E.01 | E.03 | 8 | 5 | 2 | 5 | 20 | |
| Metolachlor | H | .006 | E.008 | .134 | E.010 | E.011 | 4 | 7 | 4 | 5 | 20 | |
| Terbacil2 | H | .016 | E1.35 | – | E.031 | E.090 | 10 | 0 | 3 | 5 | 18 | |
| Metribuzin | H | .006 | .052 | .016 | E.005 | .008 | 7 | 4 | 1 | 4 | 16 | |
| Alachlor | H | .005 | .012 | – | .017 | .013 | 6 | 0 | 3 | 4 | 13 | |
| 2,4-D methyl ester | H | .016 | .013 | .017 | .041 | E.080 | 2 | 1 | 4 | 4 | 13 | |
| Chlorpyrifos | I | .005 | .053 | .006 | .011 | .027 | 5 | 2 | 3 | 3 | 13 | |
| Pendimethalin | H | .022 | .388 | .033 | – | – | 7 | 5 | 0 | 0 | 12 | |
| Azinphos-methyl | I | .05 | E .034 | E .026 | E .019 | E .018 | 4 | 3 | 2 | 2 | 11 | |
| Dicamba | H | .036 | E.03 | E.19 | E.06 | E.13 | 2 | 3 | 3 | 3 | 11 | |
| Dinoseb | H | .038 | .14 | – | – | – | 10 | 0 | 0 | 0 | 10 | |
| CEAT | T | .08 | M | – | E.01 | E.01 | 1 | 0 | 2 | 4 | 7 | |
| CAAT | T | .040 | E.01 | E.01 | E.01 | E.01 | 3 | 2 | 1 | 1 | 7 | |
| OIET | T | .032 | E.007 | E.006 | E.007 | E.006 | 2 | 2 | 2 | 1 | 7 | |
| Carbaryl1 | I | .041 | E.070 | – | E.009 | – | 4 | 0 | 2 | 0 | 6 | |
| Linuron1 | H | .035 | E.007 | E.013 | E.013 | E.014 | 1 | 2 | 1 | 1 | 5 | |
| Benomyl | F | .022 | – | .082 | E.006 | E.017 | 0 | 1 | 1 | 2 | 4 | |
| Caffeine | S | .018 | .0331 | E.0052 | – | E.0089 | 2 | 1 | 0 | 1 | 4 | |
| Diazinon | I | .005 | .007 | – | .008 | .03 | 1 | 0 | 1 | 2 | 4 | |
| Diphenamid | H | .010 | E.02 | – | E.01 | E.03 | 1 | 0 | 1 | 2 | 4 | |
| Carbaryl2 | I | .018 | E.01 | – | – | – | 3 | 0 | 0 | 0 | 3 | |
| Bromoxynil | H | .028 | E.01 | M | – | – | 2 | 1 | 0 | 0 | 3 | |
| Malathion | I | .027 | E.015 | E.017 | – | .03 | 1 | 1 | 0 | 1 | 3 | |
| Metalaxyl | F | .012 | E.01 | .04 | – | – | 1 | 2 | 0 | 0 | 3 | |
| Methomyl | I | .020 | E.016 | E.011 | – | – | 1 | 2 | 0 | 0 | 3 | |
| Norflurazon | H | .020 | E.01 | – | – | M | 1 | 0 | 0 | 2 | 3 | |
| Trifluralin | H | .009 | – | E.004 | – | – | 0 | 2 | 0 | 0 | 3 | |
| Linuron2 | H | .014 | E.01 | – | – | E.01 | 1 | 0 | 0 | 1 | 2 | |
| 2,4-DB | H | .020 | – | E.06 | – | – | 0 | 2 | 0 | 0 | 2 | |
| Dacthal monoacid | T | .028 | – | – | .02 | .02 | 0 | 0 | 1 | 1 | 2 | |
| Ethalfluralin | H | .009 | – | E.009 | – | – | 0 | 2 | 0 | 0 | 2 | |
| Ethoprophos | I | .005 | .016 | – | – | .009 | 1 | 0 | 0 | 1 | 2 | |
| MCPA | H | .030 | E.03 | M | – | – | 1 | 1 | 0 | 0 | 2 | |
| Prometon | H | .010 | M | – | – | E.01 | 1 | 0 | 0 | 1 | 2 | |
| Chlorothalonil | F | 0.035 | – | E0.06 | – | – | 0 | 1 | 0 | 0 | 1 | |
| Clopyralid | H | .024 | – | – | E0.01 | – | 0 | 0 | 1 | 0 | 1 | |
| Lindane | I | .004 | 0.018 | – | – | – | 1 | 0 | 0 | 0 | 1 | |
| Nicosulfuron | H | .04 | – | – | E.01 | – | 0 | 0 | 1 | 0 | 1 | |
| Oxamyl | I | .030 | – | .03 | – | – | 0 | 1 | 0 | 0 | 1 | |
| Propiconazole | F | .010 | – | E.01 | – | – | 0 | 1 | 0 | 0 | 1 | |
| Triallate | H | .006 | – | .004 | – | – | 0 | 1 | 0 | 0 | 1 | |
| Triclopyr | I | .026 | E.01 | – | – | – | 1 | 0 | 0 | 0 | 1 | |
| Number of samples analyzed | 12 | 12 | 12 | 12 | 48 | |||||||
1Analysis by gas chromatography/mass spectrometry (GC/MS).
2Analysis by high-performance liquid chromatography/mass spectrometry (HPLC/MS).
[All concentrations are in micrograms per liter. Concentrations of pesticides in bold represent values that exceed freshwater aquatic-life benchmarks (see table 4). Pesticide: CIAT, 2-chloro-4-isopropylamino-6-amino-s-triazine; CAAT, chlorodiamino-s-triazine; OIET, 2-hydroxy-4-isoprobylamino-6-ethylamino-s-triazine; CEAT, 2-chloro-6-ethylamino-4-amino-s-triazine. Type of pesticide: F, fungicide; H, herbicide; I, insecticide; S, stimulant; T, transformation product. Drinking-water standards: Maximum contaminant levels for drinking water from U.S. Environmental Protection Agency (2004a). Freshwater aquatic-life benchmarks: Standards from U.S. Environmental Protection Agency (2004b), unless otherwise footnoted. Abbreviations: LRL, laboratory reporting limit; M, presence of material verified, but not quantified; n, number of samples; E, because recovery or variation in recovery was outside the acceptable range, compound is qualified with an E-code (estimated) or concentration reported is less than laboratory reporting level and is qualified as estimated; <, less than; –, no data or not available; *, interim values (Canadian Council of Resources and Environment Ministers, 1997)]
| Pesticide | Type of pesticide | LRL | Median | Maximum | Percentage of detections(n=12) | Number of detections that exceed aquatic-life benchmarks | Number of detections that exceed drinking water standards |
|---|---|---|---|---|---|---|---|
| Crab Creek | |||||||
| CIAT | T | 0.006 | E0.011 | E0.019 | 100 | – | – |
| Atrazine | H | .007 | .018 | .026 | 100 | 0 | 0 |
| Bentazon | H | .012 | E.02 | E.04 | 100 | – | – |
| 2,4-D | H | .038 | .06 | .36 | 92 | 0 | – |
| Diuron | H | .014 | .02 | .1 | 83 | – | – |
| Simazine | H | .005 | .007 | .017 | 75 | – | 0 |
| EPTC | H | .004 | E.002 | .075 | 58 | – | – |
| DCPA | H | .003 | <.003 | .05 | 50 | – | 0 |
| Terbacil1 | H | .034 | <.025 | E.061 | 50 | – | 0 |
| 2,4-D methyl ester | H | .016 | <.009 | .041 | 50 | 0 | – |
| Metolachlor | H | .006 | <.013 | E.010 | 50 | 0 | 0 |
| Alachlor | H | .006 | <.004 | .017 | 25 | – | 0 |
| Chlorpyrifos | I | .005 | <.005 | .011 | 25 | 0 | 0 |
| Dicamba | H | .036 | <.01 | E.06 | 25 | 0 | 0 |
| Terbacil2 | H | .016 | <.010 | E.031 | 25 | – | 0 |
| CEAT1 | T | 0.08 | <0.04 | E0.01 | 17 | – | – |
| OIET | T | .032 | <.008 | E.007 | 17 | – | – |
| Azinphos-methyl | I | .05 | <.050 | E .019 | 17 | 1 | – |
| Bromacil | H | .018 | <.03 | E.01 | 17 | 0 | – |
| Carbaryl1 | I | .041 | <.041 | E.009 | 17 | 0 | – |
| Benomyl | H | .022 | <.004 | E.006 | 8 | – | – |
| Chlorodiamino-s-triazine | T | .040 | <.01 | E.01 | 8 | – | – |
| Clopyralid | H | .024 | <.01 | E.01 | 8 | – | – |
| Dacthal monoacid | T | .028 | <.01 | .02 | 8 | – | – |
| Diazinon | I | .005 | <.005 | .008 | 8 | 0 | 0 |
| Diphenamid | H | .010 | <.03 | E.01 | 8 | – | – |
| Linuron1 | H | .035 | <.035 | E.013 | 8 | – | – |
| Metribuzin | H | .006 | <.006 | E.005 | 8 | 0 | 0 |
| Nicosulfuron | H | .04 | <.01 | E.01 | 8 | – | – |
| Lind Coulee | |||||||
| Atrazine | H | 0.007 | 0.010 | 0.012 | 83 | 0 | 0 |
| Diuron | H | .014 | .02 | .26 | 83 | – | 0 |
| CIAT | T | .006 | E.004 | E.009 | 75 | – | – |
| 2,4-D | H | .038 | E.02 | .44 | 67 | 0 | 0 |
| DCPA | H | .003 | .004 | .044 | 58 | – | 0 |
| Metolachlor | H | .006 | E.005 | .134 | 58 | 0 | 0 |
| Bentazon | H | .012 | <.01 | E.01 | 50 | – | 0 |
| Bromacil | H | .018 | <.03 | E.13 | 42 | 0 | 0 |
| Pendimethalin | H | .022 | <.022 | .033 | 42 | – | – |
| EPTC | H | .004 | <.004 | .12 | 33 | – | – |
| Metribuzin | H | .006 | <.006 | .016 | 33 | 0 | 0 |
| Azinphos-methyl | I | .05 | <.050 | E .026 | 25 | 2 | – |
| Dicamba | H | .036 | <.01 | E.19 | 25 | 0 | 0 |
| 2,4-DB | H | .020 | <.02 | E.06 | 17 | 0 | – |
| OIET | T | .032 | <.008 | E.006 | 17 | – | – |
| Chlorodiamino-s-triazine | T | .040 | <.01 | E.01 | 17 | – | – |
| Chlorpyrifos | I | .005 | <.005 | .006 | 17 | 0 | 0 |
| Ethalfluralin | H | .009 | <.009 | E.009 | 17 | – | – |
| Linuron1 | H | .035 | <.035 | E.013 | 17 | 0 | – |
| Metalaxyl | F | .012 | <.02 | .04 | 17 | – | – |
| Methomyl | I | .020 | <.004 | E.011 | 17 | – | 0 |
| Trifluralin | H | .009 | <.009 | E.004 | 17 | – | 0 |
| 2,4-D methyl ester | H | .016 | <.009 | .017 | 8 | 0 | – |
| Benomyl | H | .022 | <.004 | .082 | 8 | – | – |
| Bromoxynil | H | <.02 | M | 8 | 0 | – | |
| Caffeine | S | .018 | <.0096 | E.0052 | 8 | – | – |
| Chlorothalonil | F | 0.035 | <0.04 | E0.06 | 8 | 0 | 0 |
| Malathion | I | .027 | <.027 | E.017 | 8 | 0 | 0 |
| MCPA | H | .030 | <.02 | M | 8 | 0 | 0 |
| Oxamyl | I | .030 | <.01 | .03 | 8 | – | – |
| Propiconazole | F | .010 | <.02 | E.01 | 8 | – | – |
| Simazine | H | .005 | <.005 | .024 | 8 | – | 0 |
| Triallate | H | .002 | <.002 | .004 | 8 | – | – |
| Red Rock Coulee | |||||||
| CIAT | T | 0.006 | E0.011 | E0.015 | 100 | – | – |
| Atrazine | H | .007 | .019 | .032 | 100 | 0 | 0 |
| Bentazon | H | .012 | E.04 | E.07 | 92 | – | 0 |
| 2,4-D | H | .038 | .09 | .77 | 83 | 0 | 0 |
| Diuron | H | .014 | .02 | .11 | 83 | – | 0 |
| Simazine | H | .005 | .011 | .022 | 83 | – | 0 |
| EPTC | H | .004 | E.003 | .1 | 67 | – | – |
| DCPA | H | .003 | E.003 | .169 | 58 | – | – |
| Terbacil1 | H | .034 | E.012 | E.075 | 58 | – | 0 |
| 2,4-D methyl ester | H | .016 | .014 | E.080 | 50 | 0 | – |
| Bromacil | H | .018 | <.03 | E.03 | 42 | 0 | – |
| Metolachlor | H | .006 | <.013 | E.011 | 42 | 0 | 0 |
| Terbacil2 | H | .016 | <.027 | E.090 | 42 | – | 0 |
| CEAT | T | .08 | <.04 | E.01 | 33 | – | – |
| Alachlor | H | .006 | <.005 | .013 | 33 | – | – |
| Metribuzin | H | .006 | <.006 | .008 | 33 | 0 | 0 |
| Chlorpyrifos | I | .005 | <.005 | .027 | 25 | 0 | 0 |
| Dicamba | H | .036 | <.01 | E.13 | 25 | 0 | 0 |
| Azinphos-methyl | I | .05 | <.050 | E .018 | 17 | 1 | – |
| Benomyl | H | .022 | <.004 | E.017 | 17 | – | – |
| Diazinon | I | .005 | <.005 | .03 | 17 | 0 | 0 |
| Diphenamid | H | .010 | <.03 | E.03 | 17 | – | 0 |
| Norflurazon | H | .020 | <.02 | M | 17 | – | – |
| OIET | T | .032 | <.008 | E.006 | 8 | – | – |
| Caffeine | S | .018 | <.0096 | E.0089 | 8 | – | – |
| Chlorodiamino-s-triazine | T | .040 | <.01 | E.01 | 8 | – | – |
| Dacthal monoacid | T | 0.028 | <0.01 | 0.02 | 8 | – | – |
| Ethoprophos | I | .005 | <.005 | .009 | 8 | – | – |
| Linuron2 | H | .014 | <.01 | E.01 | 8 | 0 | – |
| Linuron1 | H | .035 | <.035 | E.014 | 8 | 0 | – |
| Malathion | I | .027 | <.027 | .03 | 8 | 0 | 0 |
| Prometon | H | .010 | <.01 | E.01 | 8 | – | 0 |
| Sand Hollow | |||||||
| Bentazon | H | 0.012 | E0.10 | E0.25 | 100 | – | – |
| Terbacil1 | H | .034 | E.082 | E1.01 | 100 | – | 0 |
| CIAT | T | .006 | E.008 | E.036 | 92 | – | – |
| Atrazine1 | H | .007 | .012 | .029 | 92 | 0 | 0 |
| 2,4-D | H | .038 | .04 | .23 | 83 | 0 | 0 |
| Dinoseb | H | .038 | E.01 | .14 | 83 | 3 1 | 0 |
| Diuron | H | .014 | .02 | E.22 | 83 | – | 0 |
| Terbacil2 | H | .016 | E.056 | E1.35 | 83 | – | 0 |
| Bromacil | H | .018 | E.01 | E .12 | 67 | 0 | 0 |
| Metribuzin | H | .006 | E.0055 | .052 | 58 | 0 | 0 |
| Pendimethalin | H | .022 | E.006 | .388 | 58 | – | – |
| Simazine | H | .005 | E.004 | .213 | 58 | – | 0 |
| Alachlor | H | .005 | <.005 | .012 | 50 | – | 0 |
| Chloropyrifos | I | .005 | <.005 | .053 | 42 | 1 | 0 |
| Azinphos-methyl | I | .05 | <.050 | E .034 | 33 | 4 | – |
| Carbaryl1 | I | .041 | <.041 | E.070 | 33 | 0 | 0 |
| DCPA | H | .003 | <.003 | .011 | 33 | – | 0 |
| EPTC | H | .004 | <.004 | .085 | 33 | – | – |
| Metolachlor | H | .006 | <.013 | E.008 | 33 | 0 | 0 |
| Carbaryl2 | I | .018 | <.03 | E.01 | 25 | 0 | 0 |
| CAAT | T | .040 | <.03 | E.01 | 25 | – | – |
| 2,4-D methyl ester | H | .016 | <.009 | .013 | 17 | 0 | – |
| OIET | T | .032 | <.0018 | E.007 | 17 | – | – |
| Bromoxynil | H | .028 | <.02 | E.01 | 17 | 0 | – |
| Caffeine | S | .018 | <.0096 | .0331 | 17 | – | – |
| Dicamba | H | .036 | <.01 | E.03 | 17 | 0 | 0 |
| CEAT | T | .08 | <.04 | M | 8 | – | – |
| Diazinon | I | .005 | <.005 | .007 | 8 | – | 0 |
| Diphenamid | H | .010 | <.03 | E.02 | 8 | – | 0 |
| Ethoprophos | I | .005 | <.005 | .016 | 8 | – | – |
| Lindane | I | .004 | <.004 | .018 | 8 | 3 1 | 0 |
| Linuron2 | H | .014 | <.01 | E.01 | 8 | 0 | – |
| Linuron1 | H | .035 | <.035 | E.007 | 8 | 0 | – |
| Malathion | I | .027 | <.027 | E.015 | 8 | 0 | 0 |
| MCPA | H | .030 | <.02 | E.03 | 8 | 0 | 0 |
| Metalaxyl | F | .012 | <.02 | E.01 | 8 | – | – |
| Methomyl | I | .020 | <.004 | E.016 | 8 | – | 0 |
| Norflurazon | H | .020 | <.02 | E.01 | 8 | – | – |
| Prometon | H | .010 | <.01 | M | 8 | – | 0 |
| Triclopyr | I | .026 | <.02 | E.01 | 8 | – | – |
1Analysis by gas chromatography/mass spectrometry (GC/MS).
2Analysis by high-performance liquid chromatography/mass spectrometry (HPLC/MS).
3Canadian water-quality guidelines for the protection of freshwater aquatic life (Canadian Council of Ministers of the Environment, 2003).
[All concentrations are lethal concentrations for 50 percent of the target species (LC50) at 96 hours, in micrograms per liter. All data are compiled from the U.S. Environmental Protection Agency ECOTOX database (U.S. Environmental Protection Agency, 2005a). Abbreviations: N, number of references for specific studies; CAS, Chemical Abstract Services; –. not available]
| Compound | CAS registry No. | Name | Species | N | Minimum | Median | Maximum |
|---|---|---|---|---|---|---|---|
| 2,4-D | 94-75-7 | Carp | Cyprinus carpio | 9 | 5,100 | 21,450 | 270,000 |
| Pumpkinseed | Lepomis gibbosus | 1 | – | 94,600 | – | ||
| Bluegill | Lepomis macrochirus | 4 | 7,400 | 221,500 | 263,000 | ||
| Smallmouth bass | Micropterus dolomieui | 1 | – | 3,100 | – | ||
| Cutthroat trout | Oncorhynchus clarki | 2 | 24,500 | 44,250 | 64,000 | ||
| Rainbow trout | Oncorhynchus mykiss | 8 | 1,400 | 27,300 | 358,000 | ||
| Chinook salmon | Oncorhynchus tshawytscha | 1 | – | 4800 | – | ||
| Lake trout | Salvelinus namaycush | 2 | 44,500 | 44,750 | 45,000 | ||
| 2,4-DB | 94-82-6 | Bluegill | Lepomis macrochirus | 3 | 7,500 | 7,500 | 16,800 |
| Rainbow trout | Oncorhynchus mykiss | 4 | 2,000 | 3,700 | 14,300 | ||
| Acrolein | 107-02-8 | Bluegill | Lepomis macrochirus | 5 | 22 | 70 | 100 |
| Largemouth bass | Micropterus salmoides | 1 | – | 160 | – | ||
| Coho salmon, silver salmon | Oncorhynchus kisutch | 1 | – | 68 | – | ||
| Rainbow trout, Donaldson trout | Oncorhynchus mykiss | 7 | 16 | 74 | 187 | ||
| Alachlor | 15972-60-8 | Carp | Cyprinus carpio | 1 | – | 4,600 | – |
| Channel catfish | Ictalurus punctatus | 1 | – | 6,500 | – | ||
| Bluegill | Lepomis macrochirus | 10 | 2,800 | 4,950 | 12,400 | ||
| Rainbow trout | Oncorhynchus mykiss | 10 | 240 | 2,100 | 4,200 | ||
| Atrazine | 1912-24-9 | Black bullhead | Ameiurus melas | 1 | – | 35,000 | – |
| Whitefish | Coregonus lavaretus | 2 | 11,200 | 18,750 | 26,300 | ||
| Carp | Cyprinus carpio | 1 | – | 18,800 | – | ||
| Bluegill | Lepomis macrochirus | 7 | 6,700 | 42,000 | 69,000 | ||
| Rainbow trout | Oncorhynchus mykiss | 6 | 4,500 | 11,750 | 24,000 | ||
| Yellow perch | Perca flavescens | 1 | – | 50,000 | – | ||
| Brook trout | Salvelinus fontinalis | 3 | 4,900 | 4,900 | 6,300 | ||
| Azinphos-methyl | 86-50-0 | Black bullhead | Ameiurus melas | 3 | 3,500 | 3,500 | 3,500 |
| Carp | Cyprinus carpio | 3 | 695 | 695 | 695 | ||
| Threespine stickleback | Gasterosteus aculeatus | 2 | 4.8 | 8.45 | 12.1 | ||
| Channel catfish | Ictalurus punctatus | 4 | 3,220 | 3,290 | 3,290 | ||
| Bluegill | Lepomis macrochirus | 17 | 4.1 | 7.4 | 120 | ||
| Largemouth bass | Micropterus salmoides | 3 | 4.8 | 4.8 | 5 | ||
| Coho salmon | Oncorhynchus kisutch | 4 | 4.2 | 6.1 | 17 | ||
| Rainbow trout | Oncorhynchus mykiss | 10 | 3.2 | 6.95 | 28 | ||
| Chinook salmon | Oncorhynchus tshawytscha | 1 | – | 4.3 | – | ||
| Yellow perch | Perca flavescens | 5 | 2.4 | 13 | 40 | ||
| Black crappie | Pomoxis nigromaculatus | 2 | 3 | 3 | 3 | ||
| Brown trout | Salmo trutta | 3 | 3.5 | 4 | 4.6 | ||
| Brook trout | Salvelinus fontinalis | 1 | – | 1.2 | – | ||
| Bentazon | 25057-89-0 | Carp | Cyprinus carpio | 1 | – | 978,000 | – |
| Bromacil | 314-40-9 | Bluegill | Lepomis macrochirus | 1 | – | 127,000 | – |
| Rainbow trout | Oncorhynchus mykiss | 2 | 36,000 | 50,500 | 65,000 | ||
| Bromoxynil | 1689-84-5 | Bluegill | Lepomis macrochirus | 2 | 4,000 | 13,500 | 23,000 |
| Rainbow trout | Oncorhynchus mykiss | 2 | 2,090 | 10,045 | 18,000 | ||
| Carbaryl | 63-25-2 | Black bullhead | Ameiurus melas | 3 | 20,000 | 20,000 | 20,000 |
| Red shiner | Cyprinella lutrensis | 1 | – | 9,200 | – | ||
| Carp | Cyprinus carpio | 11 | 1,190 | 3,300 | 5,280 | ||
| Threespine stickleback | Gasterosteus aculeatus | 2 | 399 | 2,194.5 | 3,990 | ||
| Channel catfish | Ictalurus punctatus | 8 | 140 | 10,095 | 15,800 | ||
| Bluegill | Lepomis macrochirus | 26 | 760 | 6,760 | 290,000 | ||
| Largemouth bass | Micropterus salmoides | 3 | 6,400 | 6,400 | 6,400 | ||
| Cutthroat trout | Oncorhynchus clarki | 9 | 970 | 3,950 | 7,100 | ||
| Coho salmon | Oncorhynchus kisutch | 5 | 764 | 1,300 | 4,340 | ||
| Rainbow trout | Oncorhynchus mykiss | 25 | 800 | 1,470 | 5,400 | ||
| Chinook salmon | Oncorhynchus tshawytscha | 2 | 2,400 | 2,400 | 2,400 | ||
| Yellow perch | Perca flavescens | 3 | 350 | 745 | 5,100 | ||
| Black crappie | Pomoxis nigromaculatus | 2 | 2,600 | 2,600 | 2,600 | ||
| Brown trout | Salmo trutta | 4 | 700 | 4,125 | 6,300 | ||
| Brook trout | Salvelinus fontinalis | 13 | 900 | 2,500 | 5,400 | ||
| Lake trout | Salvelinus namaycush | 2 | 690 | 690 | 690 | ||
| Chlorothalonil | 1897-45-6 | Threespine stickleback | Gasterosteus aculeatus | 1 | – | 69 | – |
| Channel catfish | Ictalurus punctatus | 3 | 43 | 52 | 430 | ||
| Bluegill | Lepomis macrochirus | 5 | 26.3 | 62 | 386 | ||
| Rainbow trout | Oncorhynchus mykiss | 14 | 7.6 | 17.55 | 250 | ||
| Chlorpyrifos | 2921-88-2 | Threespine stickleback | Gasterosteus aculeatus | 1 | – | 8.54 | – |
| Channel catfish | Ictalurus punctatus | 3 | 280 | 280 | 806 | ||
| Bluegill | Lepomis macrochirus | 10 | 1.3 | 6.52 | 108 | ||
| Cutthroat trout | Oncorhynchus clarki | 2 | 5.4 | 11.7 | 18 | ||
| Rainbow trout | Oncorhynchus mykiss | 9 | 7.1 | 8 | 51 | ||
| Lake trout | Salvelinus namaycush | 2 | 73 | 85.5 | 98 | ||
| DCPA (Dacthal) | 1861-32-1 | Rainbow trout | Oncorhynchus mykiss | 2 | 6,600 | 18,300 | 30,000 |
| Diazinon | 333-41-5 | Black bullhead | Ameiurus melas | 1 | – | 8,000 | – |
| Carp | Cyprinus carpio | 2 | 3,430 | 4,200 | 4,970 | ||
| Bluegill | Lepomis macrochirus | 21 | 22 | 170 | 530 | ||
| Cutthroat trout | Oncorhynchus clarki | 4 | 1,700 | 2,230 | 3,850 | ||
| Rainbow trout | Oncorhynchus mykiss | 11 | 90 | 400 | 3,200 | ||
| Brown trout | Salmo trutta | 1 | – | 602 | – | ||
| Trout family | Salmonidae | 1 | – | 8,000 | – | ||
| Brook trout | Salvelinus fontinalis | 4 | 450 | 785 | 1,050 | ||
| Lake trout | Salvelinus namaycush | 2 | 600 | 601 | 602 | ||
| Dicamba | 1918-00-9 | Bluegill | Lepomis macrochirus | 2 | 135,300 | 157,650 | 180,000 |
| Rainbow trout | Oncorhynchus mykiss | 5 | 28,000 | 130,000 | 153,000 | ||
| Channel catfish | Ictalurus punctatus | 6 | 28 | 53.5 | 118 | ||
| Cutthroat trout | Oncorhynchus clarki | 13 | 41 | 87 | 1,350 | ||
| Fathead minnow | Pimephales promelas | 12 | 88 | 155 | 700 | ||
| Lake trout | Salvelinus namaycush | 11 | 32 | 79 | 1,400 | ||
| Diphenamid | 957-51-7 | Bluegill | Lepomis macrochirus | 3 | 32,000 | 65,000 | 75,000 |
| Rainbow trout, Donaldson trout | Oncorhynchus mykiss | 2 | 97,000 | 97,000 | 97,000 | ||
| Diuron | 330-54-1 | Carp | Cyprinus carpio | 1 | – | 2,900 | – |
| Bluegill | Lepomis macrochirus | 8 | 2,800 | 6,750 | 84,000 | ||
| Cutthroat trout | Oncorhynchus clarki | 3 | 710 | 1,400 | 1,400 | ||
| Rainbow trout | Oncorhynchus mykiss | 6 | 1,950 | 16,000 | 23,800 | ||
| Trout family | Salmonidae | 1 | – | 1,100 | – | ||
| Lake trout | Salvelinus namaycush | 3 | 1,200 | 2,700 | 2,700 | ||
| Tench | Tinca tinca | 1 | – | 15,500 | – | ||
| EPTC | 759-94-4 | Bluegill | Lepomis macrochirus | 3 | 22,400 | 24,800 | – |
| Cutthroat trout | Oncorhynchus clarki | 3 | 12,500 | 17,000 | – | ||
| Rainbow trout | Oncorhynchus mykiss | 3 | 19,960 | 20,720 | 26,700 | ||
| Lake trout | Salvelinus namaycush | 2 | 11,500 | 13,850 | 23,300 | ||
| Ethalfluralin | 55283-68-6 | Bluegill | Lepomis macrochirus | 2 | 32 | 67 | 102 |
| Rainbow trout | Oncorhynchus mykiss | 2 | 37 | 86.5 | 136 | ||
| Ethoprophos | 13194-48-4 | Carp | Cyprinus carpio | 1 | – | 640 | – |
| Bluegill | Lepomis macrochirus | 3 | 300 | 2,070 | 8,900 | ||
| Rainbow trout | Oncorhynchus mykiss | 5 | 1,100 | 7,800 | 13,800 | ||
| Glyphosate | 1071-83-6 | Carp | Cyprinus carpio | 2 | 11,000 | 315,500 | 620,000 |
| Channel catfish | Ictalurus punctatus | 6 | 3,300 | 8,700 | 130,000 | ||
| Bluegill | Lepomis macrochirus | 17 | 1,800 | 5,600 | 220,000 | ||
| Chum salmon | Oncorhynchus keta | 4 | 10,000 | 60,500 | 148,000 | ||
| Coho salmon, silver salmon | Oncorhynchus kisutch | 5 | 27,000 | 111,000 | 174,000 | ||
| Rainbow trout, Donaldson trout | Oncorhynchus mykiss | 26 | 1,300 | 8,650 | 7,815,670 | ||
| Sockeye salmon | Oncorhynchus nerka | 1 | – | 26,700 | – | ||
| Chinook salmon | Oncorhynchus tshawytscha | 5 | 19,000 | 102,000 | 211,000 | ||
| Brown trout | Salmo trutta | 1 | – | 5,400 | – | ||
| Imazypyr | 81334-34-1 | Channel catfish | Ictalurus punctatus | 1 | – | 100,000 | – |
| Bluegill | Lepomis macrochirus | 1 | – | 100,000 | – | ||
| Rainbow trout, Donaldson trout | Oncorhynchus mykiss | 1 | – | 100,000 | – | ||
| Lindane (gamma-HCH) | 58-89-9 | Black bullhead | Ameiurus melas | 3 | 64 | 64 | 64 |
| Carp | Cyprinus carpio | 6 | 90 | 145 | 13,000 | ||
| Threespine stickleback | Gasterosteus aculeatus | 2 | 44 | 47 | 50 | ||
| Channel catfish | Ictalurus punctatus | 4 | 44 | 44 | 450 | ||
| Bluegill | Lepomis macrochirus | 22 | 25 | 66.5 | 810 | ||
| Largemouth bass | Micropterus salmoides | 3 | 32 | 32 | 32 | ||
| Coho salmon | Oncorhynchus kisutch | 4 | 23 | 32 | 50 | ||
| Rainbow trout | Oncorhynchus mykiss | 11 | 18 | 30 | 120 | ||
| Chinook salmon | Oncorhynchus tshawytscha | 1 | – | 42 | – | ||
| Yellow perch | Perca flavescens | 4 | 23 | 68 | 68 | ||
| Brown trout | Salmo trutta | 4 | 1.7 | 1.85 | 22 | ||
| Brook trout | Salvelinus fontinalis | 1 | – | 44.3 | – | ||
| Lake trout | Salvelinus namaycush | 3 | 24 | 32 | 32 | ||
| Linuron | 330-55-2 | Channel catfish | Ictalurus punctatus | 2 | 1,800 | 2,350 | 2,900 |
| Bluegill | Lepomis macrochirus | 3 | 9,200 | 9,600 | 16,200 | ||
| Rainbow trout | Oncorhynchus mykiss | 2 | 3,000 | 9,700 | 16,400 | ||
| Malathion | 121-75-5 | Black bullhead | Ameiurus melas | 3 | 11,700 | 12,900 | 12,900 |
| Red shiner | Cyprinella lutrensis | 1 | – | 25 | – | ||
| Carp | Cyprinus carpio | 14 | 2 | 6,590 | 13,800 | ||
| Threespine stickleback | Gasterosteus aculeatus | 2 | 76.9 | 85.45 | 94 | ||
| Channel catfish | Ictalurus punctatus | 5 | 7,620 | 8,970 | 52,200 | ||
| Pumpkinseed | Lepomis gibbosus | 1 | – | 480 | – | ||
| Bluegill | Lepomis macrochirus | 13 | 20 | 103 | 1,200 | ||
| Largemouth bass | Micropterus salmoides | 4 | 250 | 267.5 | 285 | ||
| Cutthroat trout | Oncorhynchus clarki | 4 | 150 | 240.5 | 1,740 | ||
| Coho salmon | Oncorhynchus kisutch | 4 | 101 | 170 | 265 | ||
| Rainbow trout | Oncorhynchus mykiss | 17 | 2.8 | 122 | 234 | ||
| Chinook salmon | Oncorhynchus tshawytscha | 2 | 23 | 71.5 | 120 | ||
| Yellow perch | Perca flavescens | 3 | 263 | 263 | 263 | ||
| Brown trout | Salmo trutta | 3 | 101 | 101 | 200 | ||
| Brook trout | Salvelinus fontinalis | 2 | 120 | 125 | 130 | ||
| Lake trout | Salvelinus namaycush | 2 | 76 | 76 | 76 | ||
| Walleye | Stizostedion vitreum v. | 2 | 64 | 64 | 64 | ||
| MCPA | 94-74-6 | Carp | Cyprinus carpio | 1 | – | 59,000 | – |
| Bluegill | Lepomis macrochirus | 1 | – | 97,000 | – | ||
| Rainbow trout | Oncorhynchus mykiss | 2 | 91,000 | 91,000 | 91,000 | ||
| Trout family | Salmonidae | 1 | – | 25,000 | – | ||
| Tench | Tinca tinca | 1 | – | 45,000 | – | ||
| Metalaxyl | 57837-19-1 | Black bullhead | Ameiurus melas | 1 | – | 100,000 | – |
| Carp | Cyprinus carpio | 1 | – | 100,000 | – | ||
| Bluegill | Lepomis macrochirus | 3 | 27,000 | 139,000 | 150,000 | ||
| Rainbow trout, Donaldson trout | Oncorhynchus mykiss | 3 | 18,400 | 130,000 | 132,000 | ||
| Channel catfish | Ictalurus punctatus | 9 | 300 | 320 | 1,800 | ||
| Bluegill | Lepomis macrochirus | 18 | 370 | 850 | 7,700 | ||
| Largemouth bass | Micropterus salmoides | 4 | 760 | 1,005 | 1,250 | ||
| Cutthroat trout | Oncorhynchus clarki | 2 | 4,050 | 5,425 | 6,800 | ||
| Rainbow trout | Oncorhynchus mykiss | 19 | 860 | 1,600 | 32,000 | ||
| Brook trout | Salvelinus fontinalis | 5 | 1,200 | 1,500 | 2,200 | ||
| Metolachlor | 51218-45-2 | Channel catfish | Ictalurus punctatus | 1 | – | 4,900 | – |
| Bluegill | Lepomis macrochirus | 1 | – | 10,000 | – | ||
| Rainbow trout | Oncorhynchus mykiss | 1 | – | 3,900 | – | ||
| Metribuzin | 21087-64-9 | Channel catfish | Ictalurus punctatus | 1 | – | 3,400 | – |
| Bluegill | Lepomis macrochirus | 3 | 75,960 | 92,000 | 131,300 | ||
| Rainbow trout | Oncorhynchus mykiss | 5 | 42,000 | 76,770 | 147,000 | ||
| Metsulfuron methyl | 74223-64-6 | Bluegill | Lepomis macrochirus | 1 | – | 150,000 | – |
| Rainbow trout, Donaldson trout | Oncorhynchus mykiss | 1 | – | 150,000 | – | ||
| Norflurazon | 27314-13-2 | Bluegill | Lepomis macrochirus | 1 | – | 16,300 | – |
| Rainbow trout | Oncorhynchus mykiss | 1 | – | 8,100 | – | ||
| Oxamyl | 23135-22-0 | Channel catfish | Ictalurus punctatus | 2 | 13,500 | 15,500 | 17,500 |
| Bluegill | Lepomis macrochirus | 4 | 5,600 | 6,415 | 10,000 | ||
| Rainbow trout | Oncorhynchus mykiss | 4 | 3,700 | 4,450 | 12,400 | ||
| Pendimethalin | 40487-42-1 | Channel catfish | Ictalurus punctatus | 2 | 418 | 1,159 | 1,900 |
| Bluegill | Lepomis macrochirus | 4 | 199 | 980 | 90,400 | ||
| Rainbow trout | Oncorhynchus mykiss | 4 | 138 | 760 | 86,600 | ||
| Prometon | 1610-18-0 | Black bullhead | Ameiurus melas | 1 | – | 20,000 | – |
| Bullhead catfish | Ameiurus sp. | 1 | – | 20,000 | – | ||
| Bluegill | Lepomis macrochirus | 3 | 15,500 | 40,000 | 41,500 | ||
| Rainbow trout | Oncorhynchus mykiss | 5 | 12,000 | 16,000 | 20,000 | ||
| Propiconazole | 60207-90-1 | Carp | Cyprinus carpio | 5 | 5,700 | 21,000 | 46,000 |
| Channel catfish | Ictalurus punctatus | 3 | 4,870 | 4,870 | 12,000 | ||
| Bluegill | Lepomis macrochirus | 5 | 1,300 | 5,500 | 9,800 | ||
| Rainbow trout, Donaldson trout | Oncorhynchus mykiss | 11 | 830 | 5,200 | 506,000 | ||
| Brown trout | Salmo trutta | 3 | 1,200 | 3,390 | 3,390 | ||
| Simazine | 122-34-9 | Black bullhead | Ameiurus melas | 1 | – | 65,000 | – |
| Sunfish family | Centrarchidae | 5 | 14,300 | 56,000 | 695,000 | ||
| Channel catfish | Ictalurus punctatus | 1 | – | 85,000 | – | ||
| Pumpkinseed | Lepomis gibbosus | 1 | – | 27,000 | – | ||
| Bluegill | Lepomis macrochirus | 6 | 16,000 | 95,000 | 118,000 | ||
| Largemouth bass | Micropterus salmoides | 1 | – | 46,000 | – | ||
| Rainbow trout | Oncorhynchus mykiss | 5 | 40,500 | 56,000 | 70,500 | ||
| Yellow perch | Perca flavescens | 1 | – | 90 | – | ||
| Terbacil | 5902-51-2 | Bluegill | Lepomis macrochirus | 2 | 102,900 | 107,450 | 112,000 |
| Rainbow trout | Oncorhynchus mykiss | 3 | 46,200 | 54,000 | 79,000 | ||
| Triallate | 2303-17-5 | Bluegill | Lepomis macrochirus | 3 | 1,300 | 1,330 | 2,400 |
| Rainbow trout | Oncorhynchus mykiss | 2 | 1,200 | 1,350 | 1,500 | ||
| Triclopyr | 55335-06-3 | Chum salmon | Oncorhynchus keta | 2 | 300 | 3,900 | 7,500 |
| Coho salmon | Oncorhynchus kisutch | 6 | 260 | 1,150 | 9,600 | ||
| Rainbow trout | Oncorhynchus mykiss | 3 | 1,100 | 2,200 | 7,500 | ||
| Sockeye salmon | Oncorhynchus nerka | 4 | 400 | 1,300 | 7,500 | ||
| Chinook salmon | Oncorhynchus tshawytscha | 2 | 1,100 | 5,400 | 9,700 | ||
| Trifluralin | 1582-09-8 | Carp | Cyprinus carpio | 1 | – | 660 | – |
| Channel catfish | Ictalurus punctatus | 3 | 210 | 417 | 2,200 | ||
| Bluegill | Lepomis macrochirus | 7 | 8.4 | 58 | 190 | ||
| Largemouth bass | Micropterus salmoides | 2 | 75 | 75 | 75 | ||
| Rainbow trout | Oncorhynchus mykiss | 8 | 10 | 41.5 | 210 | ||
| Xylene | 68920-06-9 | Bluegill | Lepomis macrochirus | 16 | 8,600 | 14,700 | 24,500 |
| Rainbow trout, Donaldson trout | Oncorhynchus mykiss | 4 | 3,300 | 10,850 | 17,300 |
The frequency of pesticide detections is related to chemical and physical properties of the specific pesticide, environmental conditions, and amount of pesticide used. Frequency of pesticide detection typically is low in areas of low use and high where pesticide use is high. Seventy to 80 percent of total annual pesticide use in the United States is in agriculture (Aspelin, 1997). Non-agricultural uses may be significant in some areas, however, and include residential pest control, aquatic pest control, rights-of-way applications for pest control, ornamental and turf pest control, and pest control in commercial, industrial, and institutional settings (Larson and others, 1997).
For each pesticide detected in the drainage basins, the total quantity of each pesticide applied to agricultural fields in 2003 was estimated as the sum of annual pesticide applications to each crop type in the drainage basin. For each pesticide applied to a specific crop in a given drainage basin, the total quantity used annually was computed as the product of the rate of pesticide application to that crop in pounds of active ingredient per acre per year, the total acreage of the crop in the drainage basin, and the percentage of that total acreage estimated to be treated with the pesticide. Pesticide application rates and treatment percentages were obtained from the National Agriculture Statistics Service (NASS) where possible (U.S. Department of Agriculture, 2005) and from a 1995 survey conducted in the study area by the National Center for Food and Agricultural Policy (Anderson and Gianessi, 1995) for those crops that are not included in the NASS statistics. Data for total crop acreages were obtained from a geographic information system database of cultivated fields (Patricia Daly, Franklin County Conservation District, written commun., 2004). The crop-acreage database includes only acreages for alfalfa, corn, onions, potatoes, pasture, peas, mint, wheat, and orchards and does not include acreages for minor crops such as carrots; therefore, some pesticides that may be used in the basin were not included in the calculation if they are used specifically on only a few crops not in the database.
In addition to pesticides applied to agricultural lands for control of weeds and pests, herbicides are applied to roads and rights-of-way along irrigation canals, drains, and return flows by local irrigation districts to control terrestrial weed growth (table 10). Herbicide application for non-agricultural weed control ranged from 470 to 10,300 lb during 2003. Concentrations of only three of the eight herbicides (2,4-D, dicamba, and diuron were analyzed in samples of irrigation-return flow during this study. Diuron and 2,4-D were among the five most frequently detected pesticides and dicamba was detected in nearly 25 percent of samples collected during this study (table 7).
Pesticide-use data for residential and other non-agricultural uses are more limited than data for agricultural pesticide use (Barbash and Resek, 1996). No studies of non-agricultural pesticide use in the study area are known to exist. However, an estimate of residential use in the study area was computed on the basis of residential sales data collected in King County, Wash. (Phillip Dickey, Washington Toxics Coalition, written commun., 2004). A per-household sales rate was computed on the basis of total housing units in King County (U.S. Census Bureau, 2004), and this rate was multiplied by total housing units in each drainage basin. This method for computing the amount of residential pesticide use assumes that all pesticides purchased in a given year are used that year and that residential usage patterns in the study area are the same as those in King County. Pesticide registration data for the State of Washington are available from Washington State Pest Management (http://wsprs.wsu.edu/Pesticides.html), and the registration status of pesticides analyzed in this study is listed in table 19 (at back of report).
[ Abbreviations: CAS, Chemical Abstract Services; None, none applied in 2003; UH, used historically; –, not available]
| Herbicide | Trade or common name |
Amount applied (pounds) |
|---|---|---|
| 2,4-D1 | Weedestroy AM-40 | 10,300 |
| Acrolein | Magnacide H | UH |
| Copper sulfate | – | UH |
| Dicamba | Banvel, Vanquish | 510 |
| Diuron | Diuron 4L1VM, Direx | 8,560 |
| Glyphosate2 | AquaNeat | 3,350 |
| Imazypyr | Arsenal | UH |
| Metsulfuron methyl | Escort x P | 470 |
| Xylene | – | None |
1 Dimethylamine salt of 2,4-Dichlorophenoxyacetic acid was applied.
2Isopropylamine salt of glyphosate was applied.
Of the 107 pesticides analyzed for in surface-water samples from the four drainage basins, 42 herbicides, insecticides, and fungicides were detected, and 31 of those detected were reported as being applied to the major agricultural crops in the basins (fig. 5). Pesticides that were analyzed for but not detected are listed in table 20 (at back of report).
The general pesticide-usage pattern in each basin varies depending on the acreage of crops grown in that basin. In drainage basins where orchards predominate, the largest applications are insecticides, whereas in basins with larger percentages of field crops the largest application is herbicides. Usage patterns in Crab Creek and Sand Hollow basins are similar: the largest total amounts applied are the insecticides azinphos-methyl, carbaryl, and chlorpyrifos and the herbicide EPTC (fig. 5). In Red Rock Coulee basin, DCPA was the most heavily applied pesticide, followed by the fungicide chlorothalonil, the herbicide EPTC, and the insecticides chlorpyrifos and azinphos-methyl. In Lind Coulee basin, which has a large percentage of dryland agricultural area, the herbicides 2,4-D and EPTC were applied in the largest amount, followed by the fungicide chlorothalonil.
The total amount of pesticides applied in a basin does not correspond directly with the percentage of samples with detections. Some pesticides, such as atrazine, bentazon, and diuron, are applied in small amounts but were detected in a large percentage of samples; others, such as chlorothalonil, are applied in large amounts but were not frequently detected. Other pesticides, such as carbofuran, methyl parathion, and oryzalin, are known to be used on agricultural crops in the study area but were not detected in any of the surface-water samples.
Eleven pesticides that were detected in the drainage basins are available for purchase and use for residential applications (table 11). A nationwide study in the early 1990s showed that total amounts of pesticides sold for agricultural use exceeded those used for non-agricultural use by a factor of three (Aspelin and others, 1992). However, in this study area, the total amount of non-agricultural pesticides applied in these basins was significantly less than amounts applied to major agricultural crops. For example, the highest total non-cropland usage of 2,4-D was 35 pounds applied in Crab Creek and Lind Coulee, whereas agricultural use amounted to greater than 29,000 lb in that basin. Prometon and triclopyr were the only residential or commercially applied pesticides not used on major agricultural crops; however, they have many commercial uses, such as on landscaping, highway, or power line rights-of-way, so detections can not be linked directly to residential use.
Eight pesticides were detected in the drainage basins, but were not reported as having any major agricultural or residential use (table 12). Most of these were detected only once or twice, except for bromacil and dinoseb. Bromacil is an herbicide detected in samples from all drainage basins and is registered for use along highway right-of-ways, parking lots, and commercial landscaping. The USEPA banned dinoseb use in 1986. However, according to the Washington Agricultural Statistics Service (2005), dinoseb was reported as being used on apples as late as 2001. Possibly, the detection of dinoseb in the Sand Hollow basin indicates current use.
[All application values are in pounds per year. <, less than]
| Pesticide | Estimated application of non-agricultural pesticides in irrigation-return flow drainages | |||
|---|---|---|---|---|
| Crab Creek | Lind Coulee | Red Rock Coulee | Sand Hollow | |
| 2,4-D | 35 | 35 | 1.4 | 3.4 |
| Carbaryl | 14 | 14 | .5 | 1.3 |
| Chlorothalonil | 1 | 1.0 | .04 | .1 |
| Chlorpyrifos | .1 | .1 | <.01 | .01 |
| Diazinon | 7.8 | 7.9 | .3 | .8 |
| Dicamba | 2.4 | 2.5 | .1 | .2 |
| Malathion | 5.5 | 5.6 | .2 | .5 |
| Pendimethalin | 1.7 | 1.7 | .06 | .2 |
| Prometon | 3.0 | 3.0 | .1 | .3 |
| Triclopyr | 2.1 | 2.1 | .08 | .2 |
| Trifuluralin | 4.1 | 4.1 | .2 | .4 |
| Pesticide | Possible sources |
|---|---|
| Benomyl | Minor agricultural use |
| Bromacil | Rights-of-way, parking lots, commercial landscaping |
| Clopyralid | Minor agricultural use |
| Dinoseb | Historical use, banned in 1986 |
| Diphenamid | Unknown, not registered for use in Washington |
| Ethalfluralin | Minor agricultural use |
| gamma-HCH (Lindane) | Seed treatment, head-lice and animal shampoos |
| Linuron | Minor agricultural use |
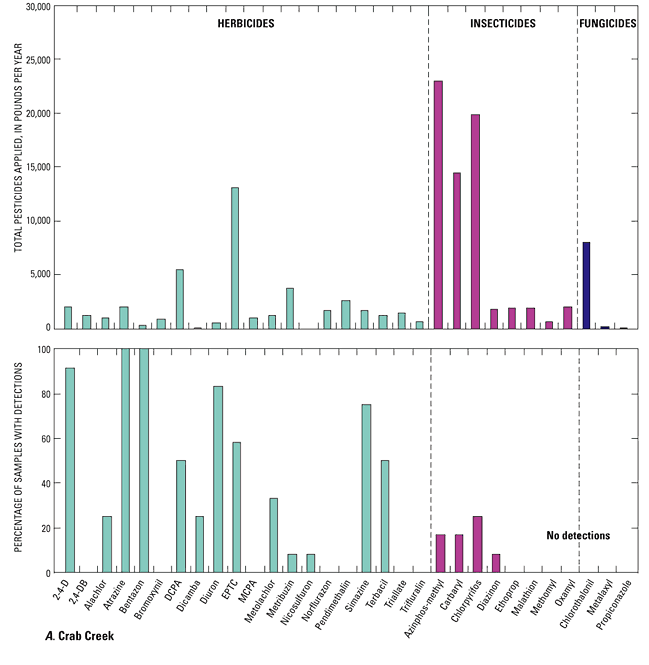
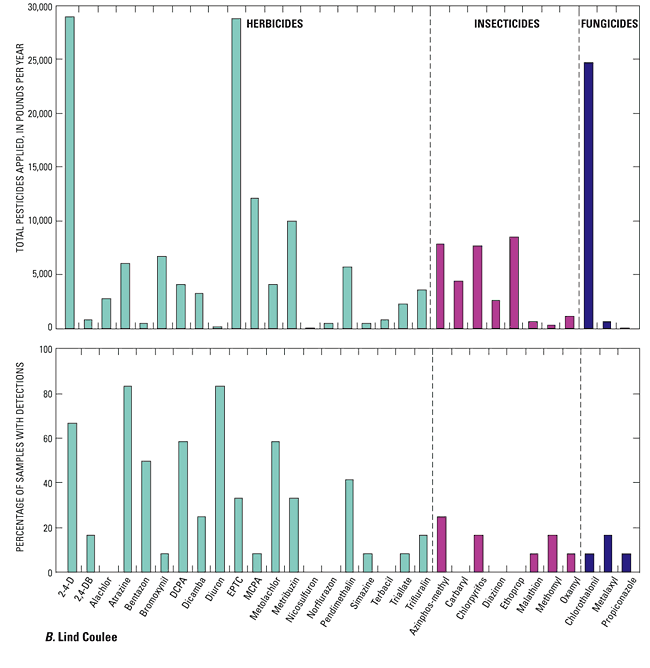
Figure 5. Continued.
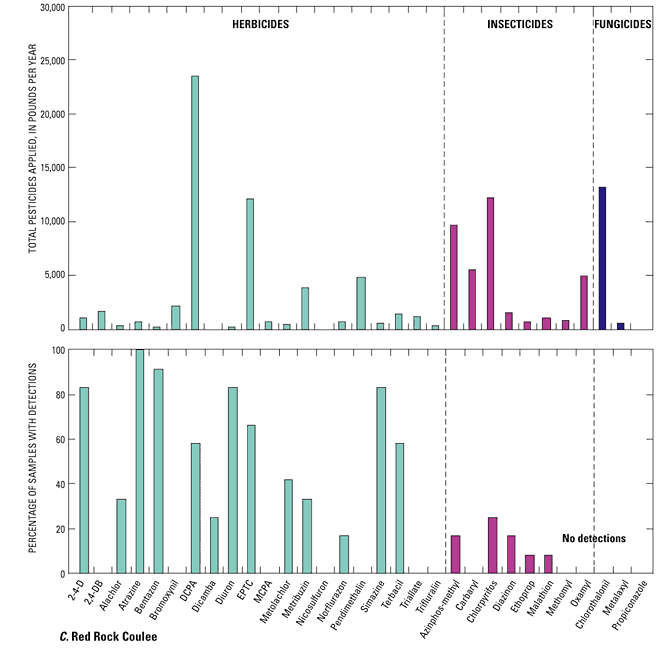
Figure 5. Continued.
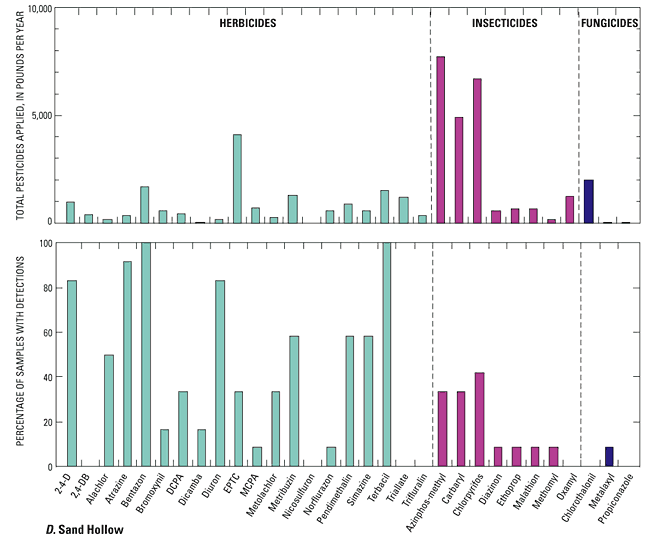
Figure 5. Continued.
Most historical pesticide data for sites in this study were collected during the 1990s by the USGS NAWQA program. Samples also were collected in the mid-1970s in Crab Creek and Lind Coulee basins by the Bureau of Reclamation, and some samples were collected by the Washington State Department of Ecology. Only one previous sample exists for Red Rock Coulee basin, so no comparison was made for that basin.
Thirteen of the pesticides analyzed for in the 1970s in samples from Crab Creek and Lind Coulee basins also were analyzed for in this study (table 13). Of these pesticides, 4,4’‑DDE, dieldrin, and lindane were detected in the 1970s (Greene and others, 1994) and diazinon, EPTC, malathion, and trifluralin were detected during this study. However, given the much lower reporting limits in the current study, the detections of diazinon, EPTC, malathion, and trifluralin do not necessarily represent an increase in detection rate for those compounds. If the detections in the current study were censored to the historical reporting limits, all of them would be reported as “less than” values. However, the lack of detections of 4,4’‑DDE, dieldrin, and lindane in the current study represents a decrease in the detection rate of these compounds. Use of dieldrin and DDT (the parent compound of 4,4’‑DDE) were banned in 1985 and 1972, respectively, which likely is a cause for the decrease in detection rates since the 1970s. Decreased detection rates can be a combination of a decrease in usage, the smaller number of samples collected during this study, and changes from furrow to sprinkler irrigation methods (Gruber and Munn, 1996; Ebbert and Kim, 1998). Crab Creek Lateral, a small drainage basin in the CBP north of Red Rock Coulee, was sampled 38 times from 1993 to 1997 during the NAWQA program; 8 of the 38 samples contained dieldrin and 5 of the 38 samples contained trace amounts of 4,4-DDE. Because dieldrin and DDT bind strongly to soil particles, the detection of these banned chemicals in water samples is attributed to erosion from agricultural fields (Gruber and Munn, 1996; Ebbert and Kim, 1998). Degradation of the original pesticides into metabolites that were not analyzed during the current study also may be a factor that makes comparison of older data difficult. Analysis of additional pesticide metabolites should be considered for future studies.
[Detection rates are number of detections/number of samples analyzed]
| Pesticide | Detection rate | ||||
|---|---|---|---|---|---|
| 1970s | Current study (July 2002 to October 2004) | ||||
| Crab Creek | Lind Coulee | Crab Creek | Lind Coulee | ||
| 4,4’-DDE | 2/37 | 2/38 | 0/12 | 0/12 | |
| Diazinon | 0/37 | 0/38 | 1/12 | 0/12 | |
| Dieldrin | 3/42 | 13/38 | 0/12 | 0/12 | |
| Disulfoton | 0/37 | 0/38 | 0/12 | 0/12 | |
| EPTC | 0/37 | 0/38 | 7/12 | 4/12 | |
| alpha-HCH | 0/5 | 0/0 | 0/12 | 0/12 | |
| gamma-HCH (Lindane) | 4/42 | 0/38 | 0/12 | 0/12 | |
| Malathion | 0/37 | 0/38 | 0/12 | 1/12 | |
| Methyl parathion | 0/37 | 0/38 | 0/12 | 0/12 | |
| Parathion | 0/37 | 0/38 | 0/12 | 0/12 | |
| Trifluralin | 0/37 | 0/38 | 0/12 | 2/12 | |
| Aldicarb | 0/37 | 0/38 | 0/12 | 0/12 | |
| Cycloate | 0/37 | 0/38 | 0/12 | 0/12 | |
A better comparison than in the 1970s can be made between data collected during this study and data collected previously by the NAWQA program at Crab Creek, Lind Coulee, and Sand Hollow during the 1990s, because similar methods were used in both studies. All pesticides detected in the 1990s also were analyzed for in this study; however, some pesticides detected in the current study were not analyzed for in the 1990s, so those were excluded from further analysis.
Thirty-six of the pesticide compounds analyzed for in both studies were detected during the 1990s, and 36 were detected during the current study (table 14). Most compounds detected frequently in one study were detected frequently in the other, with a few exceptions. For example, cyanazine was detected in more than 40 percent of samples collected from Lind Coulee in the 1990s, but was not detected at all in the current study, and bromacil was not detected at any of the sites in the 1990s but was detected in samples from all three sites in the current study. These differences in detections may be due to changes in land use, changes in crop rotations, or just a strategic change of pesticide applications.
[Period of record for historical samples: Crab Creek, 1994–95; Lind Coulee, 1994–2000; Sand Hollow, 1994–97. Pesticide: CIAT, 2-Chloro-4-isopropylamino-6-amino-s-triazine]
| Pesticide | Percentage of samples with detections during the 1990s | Percentage of samples with detections during the current study (July 2002 to October 2004) | |||||
|---|---|---|---|---|---|---|---|
| Crab Creek | Lind Coulee | Sand Hollow | Crab Creek | Lind Coulee | Sand Hollow | ||
| 2,4-D | 17 | 29 | 40 | 92 | 67 | 83 | |
| 2,4-DB | 0 | 0 | 0 | 0 | 17 | 0 | |
| 2,6-Diethylaniline | 0 | 0 | 43 | 0 | 0 | 0 | |
| Acetochlor | 0 | 4 | 0 | 0 | 0 | 0 | |
| Alachlor | 17 | 40 | 100 | 25 | 0 | 50 | |
| Atrazine | 100 | 78 | 100 | 100 | 83 | 92 | |
| Azinphos-methyl | 0 | 5 | 0 | 17 | 25 | 33 | |
| Benfluralin | 0 | 2 | 0 | 0 | 0 | 0 | |
| Bentazon | 50 | 0 | 80 | 100 | 50 | 100 | |
| Bromacil | 0 | 0 | 0 | 17 | 42 | 67 | |
| Bromoxynil | 0 | 0 | 0 | 0 | 8 | 17 | |
| Butylate | 0 | 2 | 0 | 0 | 0 | 0 | |
| Carbaryl | 0 | 24 | 14 | 17 | 0 | 33 | |
| Carbofuran | 0 | 9 | 0 | 0 | 0 | 0 | |
| Chlorothalonil | 0 | 0 | 0 | 0 | 8 | 0 | |
| Chlorpyrifos | 17 | 29 | 29 | 25 | 17 | 42 | |
| CIAT | 67 | 67 | 86 | 100 | 75 | 92 | |
| Clopyralid | 0 | 0 | 0 | 8 | 0 | 0 | |
| Cyanazine | 17 | 42 | 0 | 0 | 0 | 0 | |
| DCPA | 67 | 65 | 86 | 50 | 58 | 33 | |
| Diazinon | 0 | 16 | 0 | 8 | 0 | 8 | |
| Dicamba | 0 | 0 | 0 | 25 | 25 | 17 | |
| Dieldrin | 0 | 4 | 0 | 0 | 0 | 0 | |
| Dinoseb | 0 | 0 | 20 | 0 | 0 | 83 | |
| Disulfoton | 0 | 2 | 0 | 0 | 0 | 0 | |
| Diuron | 17 | 43 | 0 | 83 | 83 | 83 | |
| EPTC | 83 | 55 | 86 | 58 | 33 | 33 | |
| Ethalfluralin | 0 | 16 | 0 | 0 | 17 | 0 | |
| Ethoprophos | 50 | 13 | 29 | 0 | 0 | 8 | |
| Fonofos | 0 | 2 | 0 | 0 | 0 | 0 | |
| Lindane | 0 | 0 | 0 | 0 | 0 | 8 | |
| Linuron | 0 | 5 | 0 | 8 | 17 | 8 | |
| Malathion | 0 | 2 | 14 | 0 | 8 | 8 | |
| MCPA | 0 | 0 | 0 | 0 | 8 | 8 | |
| Metolachlor | 50 | 56 | 71 | 33 | 58 | 33 | |
| Metribuzin | 17 | 22 | 71 | 8 | 33 | 58 | |
| Napropamide | 0 | 2 | 0 | 0 | 0 | 0 | |
| Norflurazon | 0 | 0 | 0 | 0 | 0 | 8 | |
| Oxamyl | 0 | 0 | 0 | 0 | 8 | 0 | |
| 4,4’-DDE | 0 | 2 | 0 | 0 | 0 | 0 | |
| Pendimethalin | 0 | 33 | 0 | 0 | 42 | 58 | |
| Prometon | 0 | 0 | 0 | 0 | 0 | 8 | |
| Propyzamide | 17 | 0 | 0 | 0 | 0 | 0 | |
| Simazine | 83 | 20 | 71 | 75 | 8 | 58 | |
| Terbacil | 83 | 22 | 86 | 50 | 0 | 100 | |
| Triallate | 0 | 9 | 0 | 0 | 8 | 0 | |
| Triclopyr | 0 | 0 | 0 | 0 | 0 | 8 | |
| Trifluralin | 0 | 35 | 0 | 0 | 17 | 0 | |
| No. of samples collected | 6 | 55 | 7 | 12 | 12 | 12 | |
Two methods were used to compare historical data with data from the current study to determine if any change in concentrations occurred over time: (1) the Wilcoxon rank-sum test for sites with a small number of samples and a large gap between sampling periods, and (2) the seasonal Kendall test for sites with a larger, more continuous sampling record (Helsel and Hirsch, 2002).
The Wilcoxon rank-sum test (Helsel and Hirsch, 2002) was used to compare historical and current pesticide concentrations at Crab Creek and Sand Hollow. A small number of samples (six to seven) were collected from Crab Creek and Sand Hollow during 1994–95 and 1994–97, respectively. One sample from Sand Hollow in 1992 was analyzed for a limited number of pesticides. This sample was not included in the historical comparison because it was unfiltered water rather than filtered water, as were the other samples.
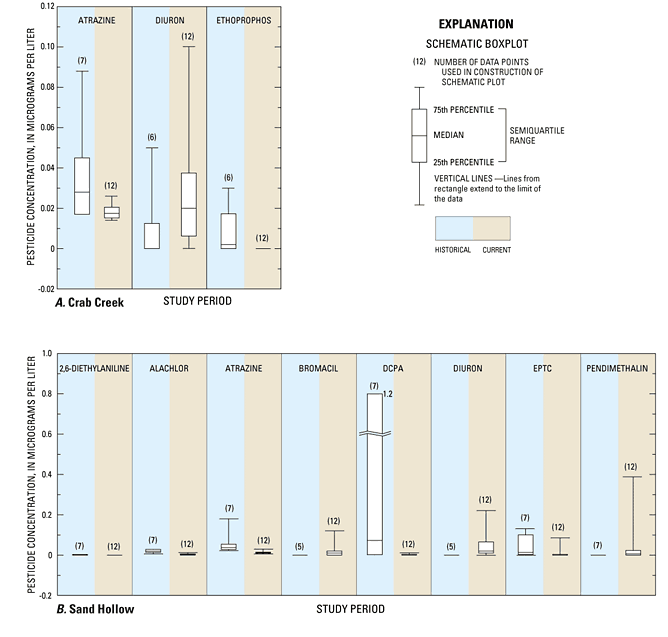
The rank-sum test is a nonparametric test that uses relative ranks of data points to determine if one data set has higher values than another data set. For these tests, if the earlier data set included all lower ranks and the later data set included all higher ranks, the trend would be decreasing. If no trend was present, then the sums of the ranks would be about equal. A trend was considered to be statistically significant if the p-value from the rank-sum test was ≤0.05. Figure 6 shows statistically significant differences in pesticide concentrations between the two study periods.
Statistically significant increases in diuron concentrations (p-value = 0.048) were observed in samples from Crab Creek. Statistically significant decreases were observed in ethoprophos and atrazine concentrations (p-value = 0.012 and 0.038, respectively), and all other pesticides detected at Crab Creek showed no statistically significant trend. Statistically significant increases in bromacil, diuron, and pendimethalin concentrations were observed in samples from Sand Hollow (p-values of 0.026, 0.007, and 0.019, respectively) and statistically significant decreases in concentration of 2,6‑diethylanaline, alachlor, atrazine, DCPA, and EPTC were observed (p-values of 0.02, 0.0005, 0.001, 0.023, and 0.023, respectively). Changes in concentration or detection frequency may be due to reductions in pesticide application, changes in agricultural land use, changes in pesticide use and application techniques, changes in managerial practices, environmental changes that may affect pesticide degradation, differences in times of sample collections, differences in sampling techniques, or any combination of these factors. Additional sampling would be needed to determine if these differences are an actual trend over time. Results from the mid-1990s focused mostly on the non-irrigation and early irrigation seasons, whereas the current study was weighted towards collecting samples throughout the irrigation season.
A larger data set exists for Lind Coulee, because samples were collected from 1994 to 2000 for the previous study and from 2002 to 2004 for the current study. Seasonal Kendall trend analysis was used to determine trends over time using the ESTREND program (Schertz and others, 1991). The seasonal Kendall test is a nonparametric test that compares relative ranks of data rather than actual concentration values. Because the data show changes depending on whether it is irrigation season or not, the seasons were defined to be November through March (non-irrigation season) and April through October (irrigation season) and irrigation season data are compared only with irrigation season data and similarly for non-irrigation season data.
No statistically significant trends were determined at Lind Coulee at p=0.05. However, simazine and terbacil showed marginally significant decreasing trends with p-values of 0.07 and 0.10, respectively. Almost all detections occurred prior to 1999 (fig. 7).
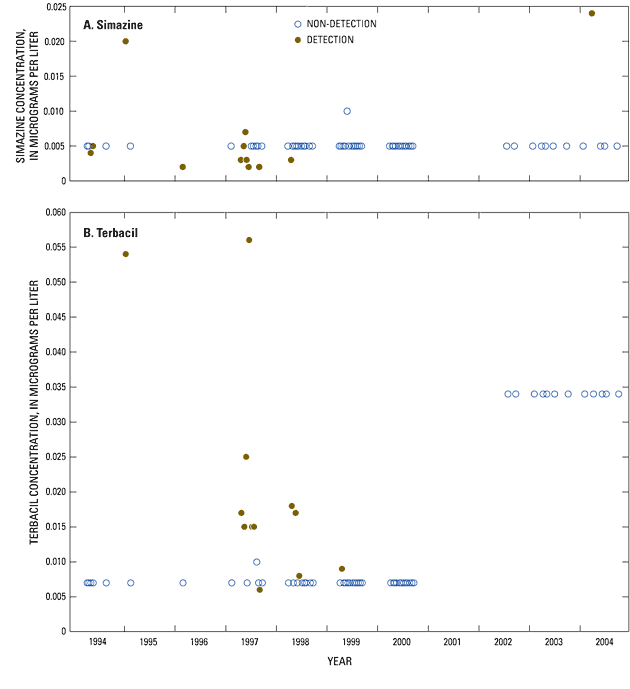
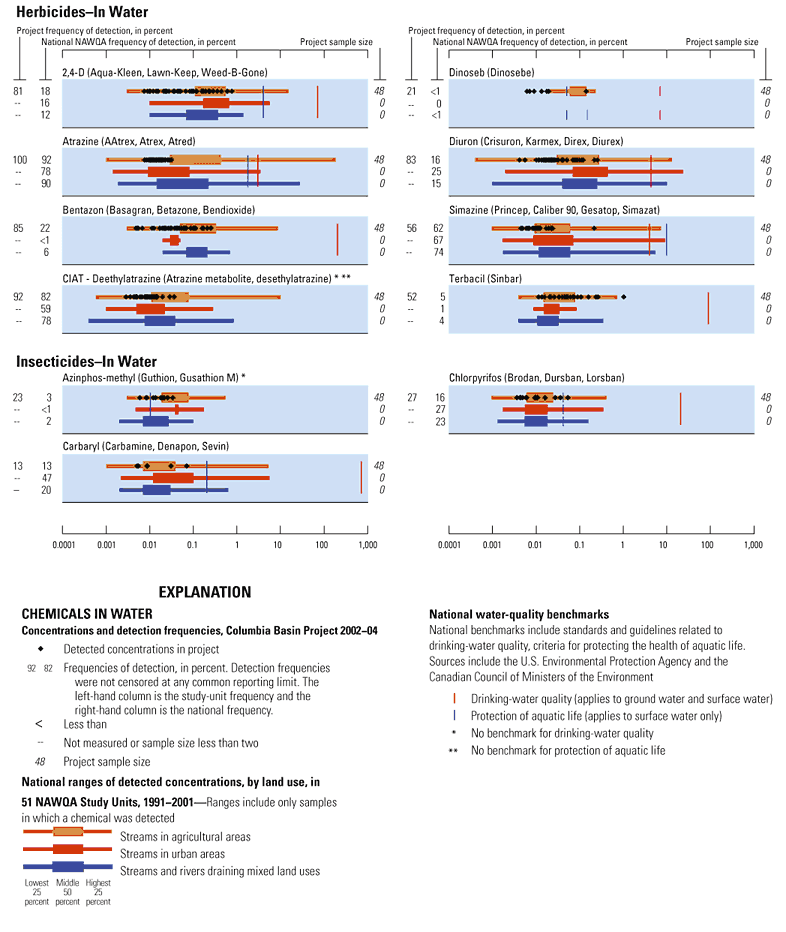
Pesticide concentrations detected in this study for the seven most frequently detected herbicides (table 8), as well as dinoseb and the three most frequently detected insecticides, were compared with pesticide concentrations in previous surface-water samples collected throughout the Central Columbia Plateau (Williamson and others, 1998), Yakima River basin (Fuhrer and others, 2004), and national NAWQA study units (fig. 8).
Overall, pesticide data in this study generally agree with those of the Central Columbia Plateau NAWQA study, which included some of the same sites. Pesticides detected during this study tend to decrease on the middle to lower end of the concentration range compared to all streams of the Central Columbia Plateau study area. This difference is partially explained by the NAWQA program goal to sample during all flow stages, including storm samples that likely transport a greater load of pesticides. Maximum concentrations detected in the Central Columbia Plateau study all were higher than those in this study except for terbacil and dinoseb. Although concentrations in this study tended to be lower, the detection rates were higher for all pesticides except simazine. Dinoseb was detected only twice in Central Columbia Plateau streams, one of which was Sand Hollow, where all 10 detections of dinoseb occurred during this study.
In the Yakima River basin, pesticide concentrations in agricultural streams also were similar to those detected in this study (Fuhrer and others, 2004). Pesticide concentration ranges generally overlapped in the mid to lower range for atrazine, simazine, azinphos-methyl, and carbaryl; terbacil and chlorpyrifos concentrations generally were higher in samples collected during this study. Detection rates also were slightly lower in this study than from streams in the Yakima River basin for all pesticides except chloropyrifos. 2,4-D, diuron, dinoseb, and bentazon were not analyzed for in the Yakima River basin, so no comparison was made for those compounds.
In comparing pesticide concentrations from this study with NAWQA data collected nationally, pesticide concentrations in this study generally were in the mid to lower one-half of the range of concentrations, except for terbacil detections during this study, which are in the upper end of the national range (fig. 8). The detection rate was similar for atrazine, CIAT, simazine, carbaryl, and chlorpyrifos, but was substantially higher in this study for terbacil, 2,4-D, bentazon, diuron, azinphos-methyl, and dinoseb. Dinoseb, in particular, stands out, because it was detected in less than 1 percent of all samples nationally but in 15 percent of samples in this study and about 60 percent of samples in the Sand Hollow drainage basin.
Pesticides are applied to agricultural crops and residential lawns and gardens for control of weeds, insects, fungus, and other undesirable factors. Once applied, pesticides are subject to three types of processes, as described by Larsen and others (1997), that control the behavior and fate of pesticides in the environment: (1) transformation processes that change the chemical structure, (2) phase-transfer processes that control pesticide movement between water, biota, sediment, and the atmosphere; and (3) transport processes that move pesticides from the initial point of application to the environment. Major pathways of pesticide transport in this study were irrigation-return flows, and major transport processes are by direct surface-water runoff from agricultural fields and by ground-water discharge that contains pesticides that have leached into ground water (Jones and Roberts, 1998). Pesticide runoff from right-of-way, commercial, and residential application also is a potential source of pesticide transport.
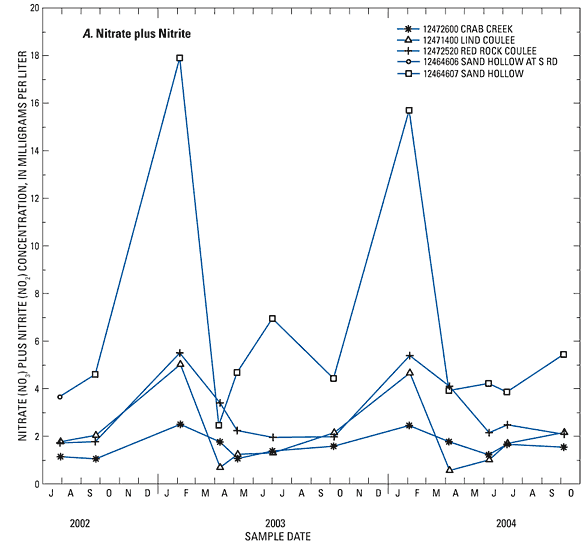
Streams interact with ground water in all landscapes (Winter and others, 1998). Streams lose water to ground water through the streambed and gain water from inflow of ground water through the streambed. Cessation of irrigation delivery water during non-irrigation seasons changes the relative difference between the altitude of the water table near the streams and the altitude of the surface-water surface, leading to ground-water flow to streams. Williamson and others (1998) showed that many irrigation wasteways and drains in the CBP receive large contributions of ground-water discharge. In the four drainage basins in this study, irrigation water is not delivered from November to March, and in the absence of natural runoff from rainfall, ground water is the predominant source of nitrate in surface-water irrigation-return flow (fig. 9). Fuhrer and others (2004) have shown that ground-water discharges are a major source of surface-water nitrate in irrigated areas of the western United States. Williamson and others (1998) note that, like nitrate, soluble pesticides such as atrazine can leach into ground water of the CBP and later be transported to agricultural irrigation-return flow drainages. Concentrations of atrazine in the study basins do not decrease during the non-irrigation season and actually increase in samples collected from Sand Hollow during the non-irrigation season (fig. 9).
Pesticides that are readily soluble in water, such as herbicides atrazine, bentazon, and diuron (table 15), also can be transported to irrigation-return flows by runoff from agricultural fields, highway or power line rights-of-way, and commercial or residential properties. Pesticide presence usually is related to the timing of pesticide application, pesticide properties, agricultural irrigation practices, and environmental conditions at the time of application (Wagner and others, 1996; Ebbert and Kim, 1998). Transport of pesticides also is dependent on the rate of application, the rate at which pesticides break down in soil and water, and the physical properties of the pesticide that allow it to dissolve and be transported by water (Williamson and others, 1998).
Site 12464606 was sampled only once, in July 2002, and all other samples for Sand Hollow basin were from site 12464607.
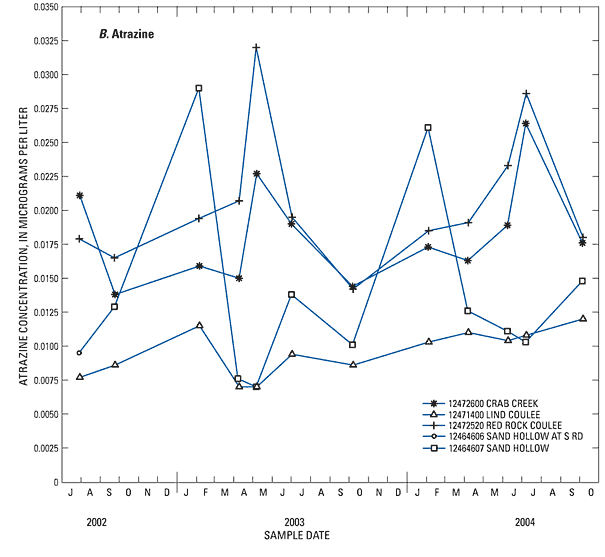
Figure 9. Continued.
[Solubility and partition coefficient values are from Mackay and others (1997) unless otherwise indicated. Solubility: is at 25 degrees Celsius. Partition coefficients:Kow, octanol-water partition coefficient; Koc, adsorption partition coefficient. Type of pesticide: F, fungicide; H, herbicide; I, insecticide. Abbreviations: mg/L, milligram per liter, <, less than; –, no data]
| Pesticide | Type of pesticide |
Solubility (mg/L) |
Partition coefficient | |
|---|---|---|---|---|
| log Kow | log Koc | |||
| Atrazine1 | H | 30 | 2.75 | 2.00 |
| Bentazon2 | H | 500 | – | – |
| Diuron | H | 40 | 2.78 | 2.6 |
| 2,4-D | H | 400 | 2.81 | 1.68-2.73 |
| 2,4-D methyl ester | H | 100 | – | 2.0 |
| Simazine | H | 5 | 2.8 | 2.11 |
| Terbacil1 | H | 710 | 1.89 | 1.74 |
| DCPA3 | H | .5 | – | – |
| EPTC | H | 370 | 3.2 | 2.3 |
| Bromacil | H | 815 | 2.11 | 1.86 |
| Metolachlor | H | 430 | 3.13 | 2.26 |
| Metribuzin2 | H | 1,050 | 1.60 | 1.79 |
| Alachlor | H | 240 | 2.8 | 2.23 |
| Chlorpyrifos | I | .73 | 4.92 | 3.78 |
| Pendimethalin2 | H | .3 | 5.18 | 3.70 |
| Azinphos-methyl | I | 30 | 2.7 | 2.61 |
| Dicamba | H | 4,500 | 2.21 | .34, -.4 |
| Dinoseb | H | 50 | 3.56 | 2.85 |
| Carbaryl1 | I | 120 | 2.36 | 2.36 |
| Linuron1 | H | 75 | 3.0 | 2.91 |
| Benomyl | F | 42.0 | 2.3 | 3.28 |
| Diazinon | I | 60 | 3.3 | 2.76 |
| Diphenamid | H | 260 | 1.92 | 2.31 |
| Bromoxynil | H | 130 | <2.0 | – |
| Malathion | I | 145 | 2.8 | 3.26 |
| Metalaxyl | F | 8,400 | 1.75 | 1.7 |
| Methomyl | I | 58,000 | .60 | – |
| Norflurazon3 | H | 34 | 2.79 | |
| Trifluralin | H | 4.5 | 5.34 | 4.14 |
| 2,4-DB | H | 46 | 3.53 | 2.64 |
| Ethalfluralin | – | – | 31.69 | |
| Ethoprophos | I | 750 | 3.59 | 1.85 |
| MCPA | H | 1,605 | 42.69 | 2.03-2.07 |
| Prometon | H | 750 | 2.99 | 2.54 |
| Chlorothalonil | F | .6 | 2.64 | 3.2 |
| Clopyralid | H | – | – | 3.67 |
| Lindane | I | 7.3 | 3.7 | 3.0 |
| Nicosulfuron3 | H | 18,486 | 1.56 | – |
| Oxamyl | H | 282,000 | -.47 | 1.4 |
| Propiconazole | F | 110 | 3.72 | 2.82 |
| Triallate | H | 4 | 4.29 | 3.38 |
| Triclopyr | H | 440 | .42 | 1.30-2.89 |
1Analyzed by gas chromatography/mass spectrometry (GC/MS) and by high-performance liquid chromatography/mass spectrometry (HPLC/MS).
2Solubility and partition coefficients are from the Extension Toxicology Network (EXTOXNET), accessed August 22, 2005, at http://extoxnet.orst.edu/.
3Solubility and partition coefficients are from the Pesticides Action Network (PAN) pesticides database, accessed August 22, 2005, at http://www.pesticideinfo.org/.
4Reported values vary considerably. Selected value represents best judgment by Mackay and others (1997) and may be subject to a large error.
The herbicides atrazine, bentazon, diuron, and 2,4-D were detected in more than one-half of samples collected at all four sites. Water solubility of these herbicides ranges from 30 to 500 mg/L, and the adsorption coefficients (log Koc), which indicate a chemical’s affinity to partition to soil particles, is relatively low. These physical and chemical characteristics lead to a low affinity for adhering to sediment and to a high potential for the compounds to dissolve and be transported in water.
The insecticides chlorpyrifos and azinphos-methyl each were detected in about one-fourth of samples collected during this study and were detected in all four irrigation return-flow basins, although most detections were in Sand Hollow drainage basin. The insecticide carbaryl was detected in 6 of 48 samples, primarily in samples from Sand Hollow drainage basin. Both azinphos-methyl and carbaryl are readily soluble in water, with 30 and 120 mg/L solubility, respectively. The relatively low adsorption coefficient means that these insecticides are likely to dissolve and be transported in water. Conversely, chlorpyrifos has a low solubility in water (0.73 mg/L) and a relatively large adsorption coefficient, so is more likely to bind to soil particles. Therefore, transport of chlorpyrifos is by means of soil erosion into the irrigation-return flows. Because chlorpyrifos recently was listed by USEPA as a Restricted Use Product (U.S. Environmental Protection Agency, 2003), expectations are that detections of this pesticide should decrease over time.
For more information about USGS activities in Washington, visit the USGS Washington Water Science Center home page .

![]() U.S. Department of the Interior |
U.S. Geological Survey
U.S. Department of the Interior |
U.S. Geological Survey
Persistent URL: https://pubs.water.usgs.gov/sir20065005
Page Contact Information: Publications Team
Page Last Modified: Thursday, 01-Dec-2016 18:54:05 EST
