Scientific Investigations Report 2006-5019
U.S. GEOLOGICAL SURVEY
Scientific Investigations Report 2006-5019
The hydraulic-flow model of the Kootenai River developed by Berenbrock (2005) primarily was used to determine the location of the transition between backwater and free-flowing water. The white sturgeon spawning habitat reach also was the main reach of focus in that study as cross sections were spaced closer than in the braided and canyon reaches and in other areas.
Paired data comprised of discharge in the study reach and water level or elevation in Kootenay Lake at Queens Bay gaging station (08NH064), available since the early 1930s, were used for boundary (upstream and downstream) conditions in the model. Discharge in the study reach is specified at the upstream boundary (Leonia gaging station [12305000]), and water-surface elevation is specified at the downstream boundary (Porthill gaging station [12322000]). Discharges of 40,000 ft3/s and less were used to represent discharges in the river since the construction of Libby Dam (1973 to 2003), and discharges greater than 40,000 ft3/s were used to represent discharges prior to the construction of Libby Dam (1940 to 1972). Water-surface elevations were based on current and historic elevations in Kootenay Lake at Queens Bay.
Water-surface elevations, flow depths, and flow velocities in the modeled reach are needed to determine if hydraulic characteristics of the braided and canyon reaches are reasonable for white sturgeon spawning. At cross sections, a single value for each hydraulic characteristic (water-surface elevation, flow depth, and flow velocity, and such) was computed by the model. For example, model-simulated velocity represents average velocity at a cross section. Because the model is one dimensional, the maximum velocity or other velocities in a cross section cannot be determined.
In task 1, a total of 15 simulations were run using combinations of five discharges and three water-surface elevations. The five objective discharges were 6,000, 20,000, 40,000, 60,000, and 75,000 ft3/s and were used to represent low to high discharges in the river. Three water-surface elevations in Kootenay Lake were used to represent low, median, and high elevations at Queens Bay. The low, median, and high lake elevations were determined by calculating the spread in lake elevations near the objective discharge. The spread is the difference between the highest measured elevation minus the lowest measured elevation. All paired values (measured discharge in the study reach and measured water-surface elevation at Queens Bay) within ±1,000 ft3/s of each objective discharge were used to determine the spread in lake elevation at the objective discharges. Low lake elevation was set to the 15th percentile and high elevation to the 85th percentile. The 50th percentile is known as the median. The 15th percentile, for example, is a value which exceeds 15 percent of the spread in lake elevations and is exceeded by 85 percent of the spread. The 85th percentile is a value which exceeds 85 percent of the spread in lake elevations and is exceeded by 15 percent of the spread. Water-surface elevations at Queens Bay for each objective discharge and percentile are shown in table 1.
The water-surface elevation at Porthill was determined using a regression equation that relates water-surface elevations at Queens Bay and Porthill (Berenbrock, 2005, fig. 7A). These objective discharges in the study reach and water-surface elevations at Porthill (table 1) were then used as boundary conditions in the model for the task 1 simulations.
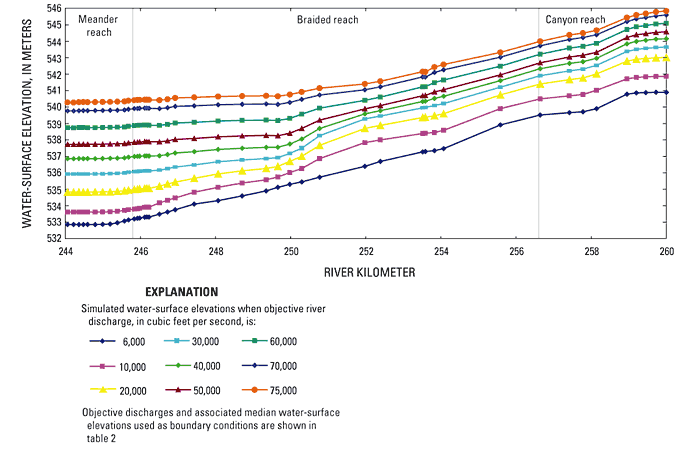
In task 2, nine simulations were run using nine objective discharges and corresponding median water-surface elevations at Queens Bay gaging station. The nine objective discharges are 6,000, 10,000, 20,000, 30,000, 40,000, 50,000, 60,000, 70,000, and 75,000 ft3/s. The median or 50th percentile water-surface elevations were determined by taking the median of the spread in lake elevations near each objective discharge. All paired values (discharge in the study reach and water-surface elevation at Queens Bay) within ±1,000 ft3/s of each objective discharge were used to determine the spread in elevation at the objective discharges. Median water-surface elevations at Queens Bay for each objective discharge are shown in table 2.
Water-surface elevations at Porthill were then determined from the regression equation in Berenbrock (2005, fig. 7A). These objective discharges in the study reach and water-surface elevations at Porthill (table 2) were then used as boundary conditions in the model for task 2 simulations.
[Porthill water-surface elevations are based on regression equation that relates water-surface elevations between Queens Bay and Porthill (Berenbrock, 2005, fig. 7A)]
| Objective discharge (cubic feet per second) |
Percentile | Lake level category |
Water-surface elevations (meters) |
|
|---|---|---|---|---|
| Queens Bay | Porthill | |||
| 6,000 | 15th | Low | 531.32 | 531.60 |
| 6,000 | 50th | Median | 532.09 | 532.47 |
| 6,000 | 85th | High | 532.85 | 533.34 |
| 20,000 | 15th | Low | 531.75 | 532.09 |
| 20,000 | 50th | Median | 532.81 | 533.30 |
| 20,000 | 85th | High | 533.88 | 534.51 |
| 40,000 | 15th | Low | 533.47 | 532.22 |
| 40,000 | 50th | Median | 533.74 | 534.35 |
| 40,000 | 85th | High | 535.40 | 536.24 |
| 60,000 | 15th | Low | 536.25 | 537.20 |
| 60,000 | 50th | Median | 534.86 | 535.62 |
| 60,000 | 85th | High | 533.47 | 534.04 |
| 75,000 | 15th | Low | 534.59 | 535.32 |
| 75,000 | 50th | Median | 535.84 | 536.74 |
| 75,000 | 85th | High | 537.09 | 538.16 |
[Porthill water-surface elevations are based on regression equation that relates water-surface elevations between Queens Bay and Porthill (Berenbrock, 2005, fig. 7A)]
| Objective discharge (cubic foot per second) |
Median water-surface elevations (meter) |
|
|---|---|---|
| Queens Bay |
Porthill | |
| 6,000 | 532.09 | 532.47 |
| 10,000 | 532.51 | 532.95 |
| 20,000 | 532.81 | 533.30 |
| 30,000 | 533.18 | 533.71 |
| 40,000 | 533.74 | 534.35 |
| 50,000 | 534.35 | 535.04 |
| 60,000 | 534.86 | 535.62 |
| 70,000 | 535.49 | 536.34 |
| 75,000 | 535.84 | 536.74 |
The objective discharges and water-surface elevations in table 1 were used in task 1 simulations. Simulated water-surface elevations, flow depths, and flow velocities are shown in figures 3, 4, and 5. The 15th, 50th, and 85th percentile curves of water-surface elevation, flow depth, and flow velocity converge in the braided or canyon reach downstream of the confluence with the Moyie River. At the point where these curves converge, the effects of backwater cease. Upstream of the convergence point, velocities and depths are not affected by Kootenay Lake elevations. The 15th, 50th, and 85th percentile curves of water-surface elevation (fig. 3) show that the influence of backwater on the reach moves upstream with higher Kootenay Lake elevations. As river discharge increases, the influence of backwater moves downstream.
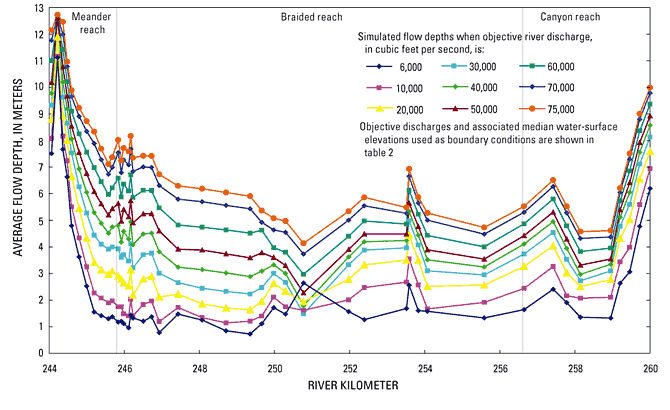
Flow depths in the meander reach usually are greater than flow depths in the braided and canyon reaches for all discharges. The large flow depths near RKM 244, as shown in figure 4, are caused by the deep hole in and around Ambush Rock.
Flow velocities in the canyon and braided reaches usually are greater than flow velocities in the meander reach. At a discharge of 6,000 ft3/s, flow velocities in the canyon and braided reaches on average were four times greater than flow velocities in the meander reach (fig. 5A); at 75,000 ft3/s, flow velocities were 2.5 times greater in the canyon and braided reaches than in the meander reach (fig. 5E). The low-flow velocities in cross sections near RKM 244, as shown in figure 5, are caused by a deep hole in the river in and around Ambush Rock. The streambed portion of cross sections that traverse this area should be artificially modified to only include the active flow area. The hole is about 15 m deep at RKM 244.2 and about 12 m deep at RKM 244.4 and is about 1 km long, which is less than 1 percent of the modeled reach length. The model assumes that the area of water from the surface to the streambed will be conveyed downstream. This area usually is known as the active flow area and is used in calculations in the model. However, not all water in the hole will be actively conveyed downstream because it is ponded and velocities are nearly zero. The ponded water in the hole is not considered part of the active flow area.
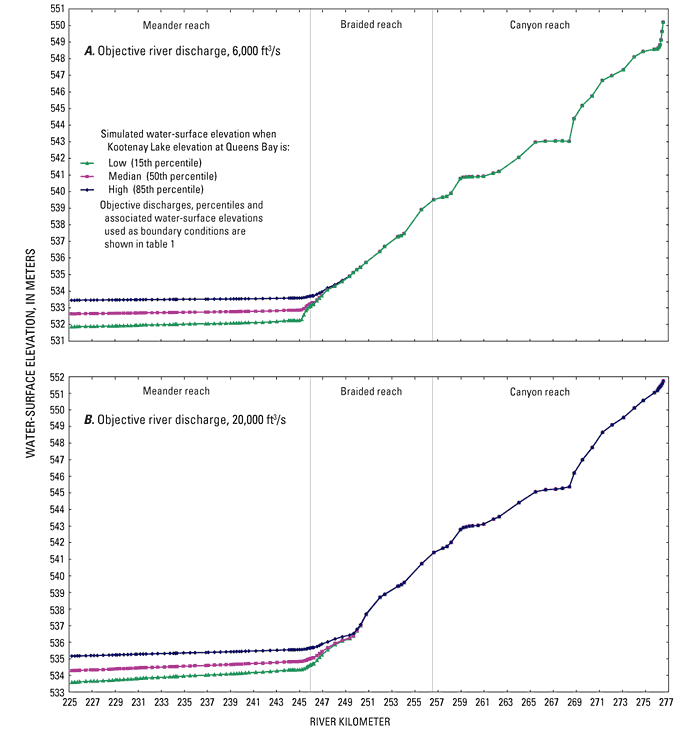
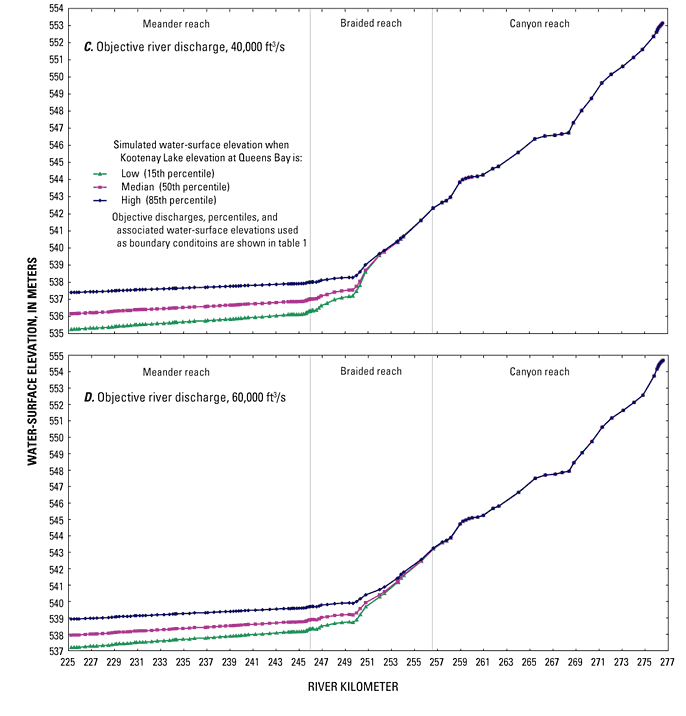
Figure 3.—Continued.
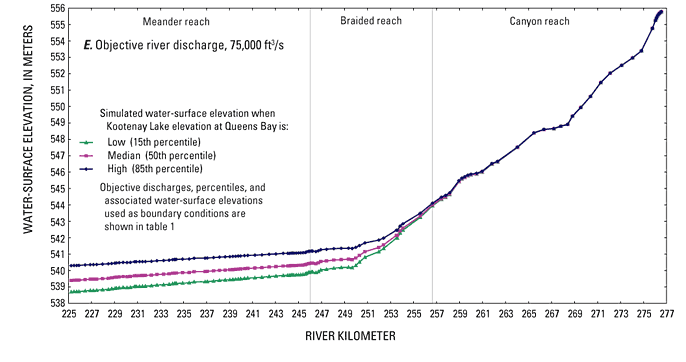
Figure 3.—Continued.
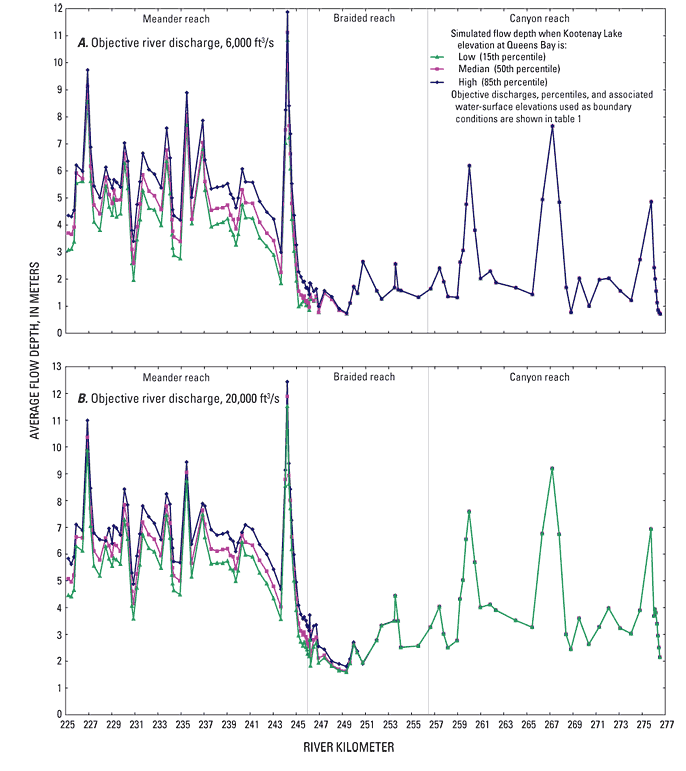
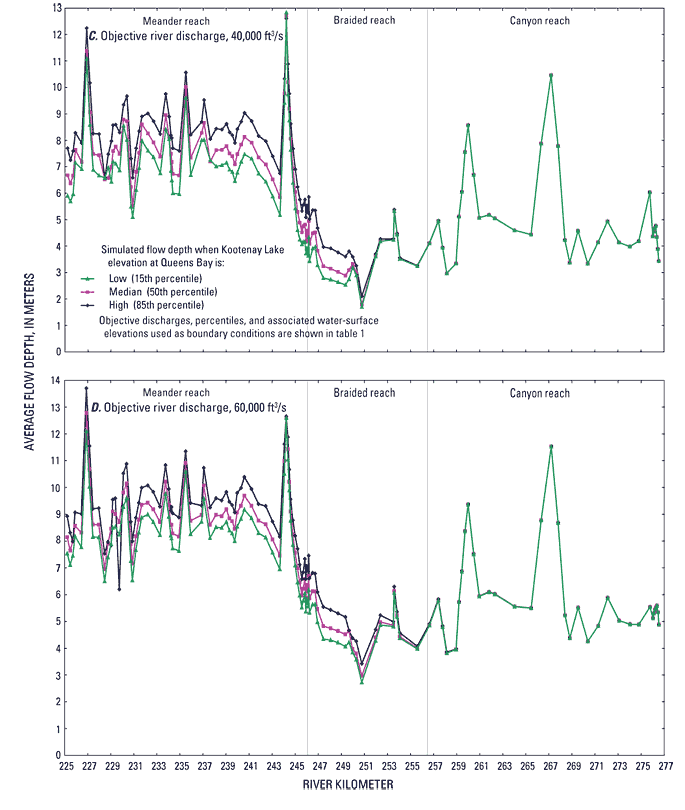
Figure 4.—Continued.
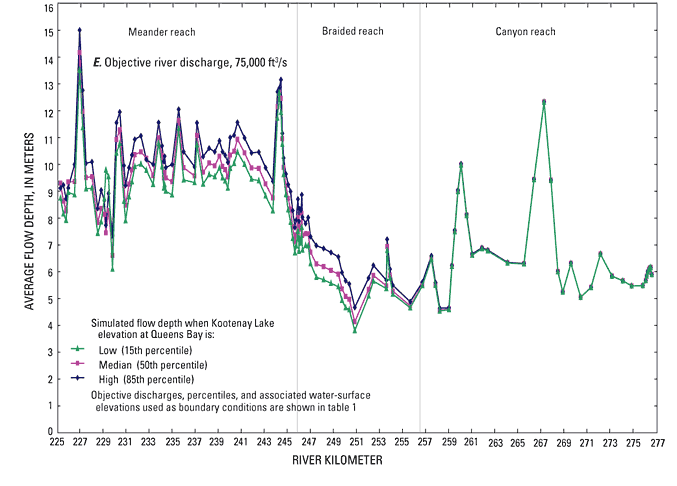
Figure 4.—Continued.
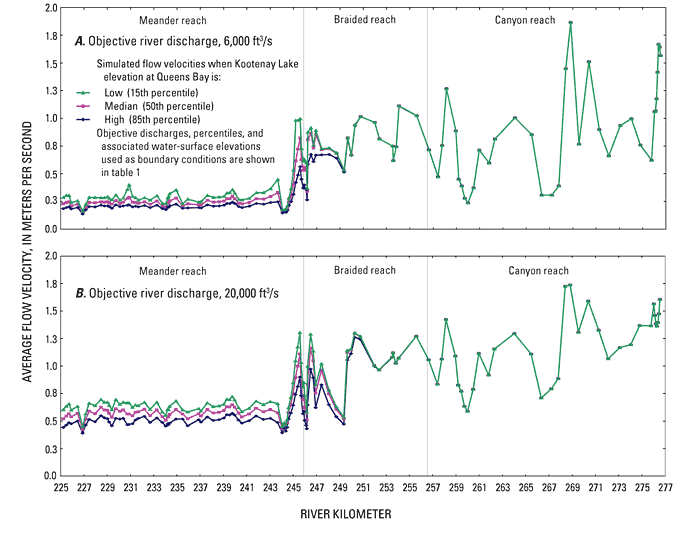
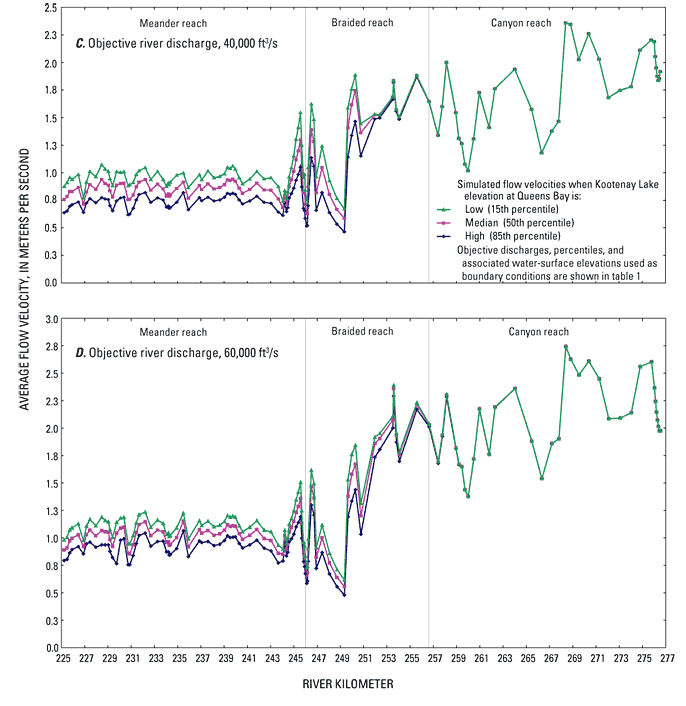
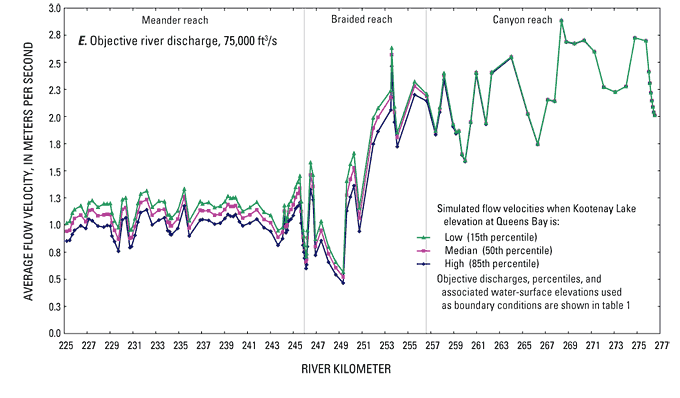
Figure 5.—Continued.
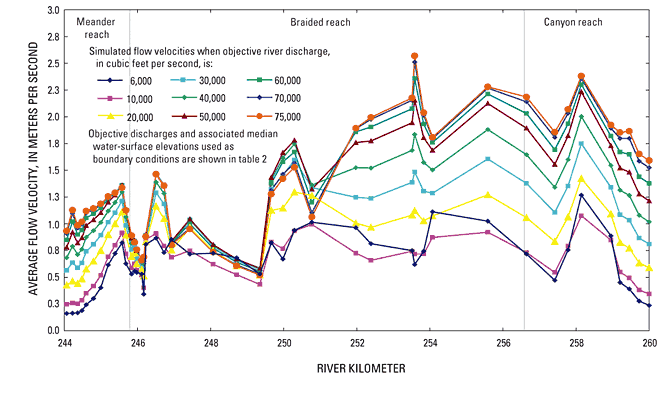
For task 2, nine objective discharges and associated median water-surface elevations at Queens Bay gaging station (table 2) were used for these simulations. Simulated water-surface elevations, flow depths, and flow velocities are shown in figures 6, 7, and 8. Only a portion of the results were shown, from RKM 260 near the confluence with the Moyie River to RKM 244 near Ambush Rock. The curves in these figures show that as river discharge increases, water-surface elevation, flow depth, and flow velocities increases. The large flow depths near RKM 244 (fig. 7) are caused by a deep hole in and around Ambush Rock. As previously mentioned, cross sections in this reach could be artificially modified to only include the active flow area. The low-flow depths at cross section 155.855 (near RKM 251) (fig. 7) are caused from a sudden widening of the channel at the section. The width of the river can be greater than 300 m at high discharges. At discharges less than 10,000 ft3/s, river width narrows at this cross section to less than 60 m exposing a gravel bar on the left side of the channel. Average flow depths in the braided reach can be greater at low discharges than at median to high discharges (fig. 7). The channel near RKM 260 (canyon reach) deepens and causes flow depths to increase.
Flow velocities in the braided reach are greater than velocities in the canyon and meandering reaches (fig. 8). Flow velocities usually are lowest in the meandering reach except for the braided reach between RKM 249.5 and RKM 248 (fig. 8). In this reach, flow velocities were much lower than in surrounding reaches. The reason for this is that cross section 154.972 (near RKM 249.4) is not perpendicular to flow but is skewed to flow. A skewed cross section is wider than an actual cross section, and produces a flow area that is greater than actual, which results in a lower modeled flow velocity at the cross section. The modeled flow areas of two cross sections immediately downstream from cross section 154.972 (near RKM 249.4) probably also were greater than actual resulting in lower flow velocities because these cross sections were interpolated from the skewed cross section 154.972 (near RKM 249.4). Improvements to the model in this reach could be made by replacing these cross sections with cross sections that are generated from the recently collected bathymetry data (Barton and others, 2005) and LIDAR data (Richard Duncan, GeoEngineers, written commun., 2005).
For more information about USGS activities in Idaho, visit the USGS Idaho Water Science Center home page .

![]() U.S. Department of the Interior |
U.S. Geological Survey
U.S. Department of the Interior |
U.S. Geological Survey
Persistent URL: https://pubs.water.usgs.gov/sir20065019
Page Contact Information: Publications Team
Page Last Modified: Thursday, 01-Dec-2016 18:54:31 EST
