Scientific Investigations Report 2006-5041
U.S. GEOLOGICAL SURVEY
Scientific Investigations Report 2006-5041
Existing watershed models for seven watersheds were examined for this study: Lost River and Big Creek watersheds (Washington State), Hamden watershed (Minnesota), North Fork Pheasant Branch watershed (Wisconsin), Amite River watershed (Mississippi and Louisiana), English River watershed (Iowa), and South Branch Potomac River watershed (West Virginia). The watersheds were simulated using a watershed model, or precipitation-runoff model, that simulates runoff and ground-water recharge from precipitation and air temperature inputs. The purpose and scope of the different watershed modeling projects, as well as the method of construction and calibration varied significantly.
The USGS Modular Modeling System (MMS), developed by Leavesley and others (1996), was used for the watershed-simulation component of the study. MMS is an integrated system of computer software developed to provide a framework for the development and application of models to simulate various hydrologic processes. Existing models can be modularized and brought into MMS. Modularization allows the user to select appropriate algorithms (modules) or develop new modules to create an optimal model for the desired application.
The Precipitation-Runoff Modeling System (PRMS) (Leavesley and others, 1983) was the model incorporated into MMS for the analysis of recharge-parameter sensitivities. PRMS is a deterministic, process-based, distributed-parameter modeling system designed to analyze the effects of precipitation, climate, and land use on streamflow and general watershed hydrology (Leavesley and others, 1983). Land units of similar hydrologic response to precipitation and temperature, known as hydrologic response units (HRU), are conceptualized as an interconnected series of reservoirs whose collective output produces the total hydrologic response (fig. 1). These reservoirs include interception storage in the vegetation canopy, storage in the soil zone, subsurface storage between the surface of a watershed and the water table, and ground-water storage. PRMS considers subsurface flow (or interflow) to be relatively rapid movement of water from the unsaturated zone to a stream channel. Flow to a ground-water reservoir comes from a soil zone and a subsurface reservoir. The ground-water reservoir is considered the source of all baseflow. The movement of water from one reservoir to another is computed throughout the simulation and is controlled by user-specified parameters. The application of the model for this study was run on a daily time step. The system inputs included daily precipitation and daily maximum and minimum air temperature. Streamflow at a watershed outlet is the sum of area-weighted surface, subsurface, and ground‑water flows in the watershed.
Simulated soil water in excess of field capacity first satisfies the ground-water reservoir based on a user-specified recharge rate. When the percolating moisture exceeds this daily recharge rate, the excess soil water goes to the subsurface reservoir. Excess moisture in the subsurface reservoir either percolates to a ground-water reservoir or flows to a discharge point above the water table.
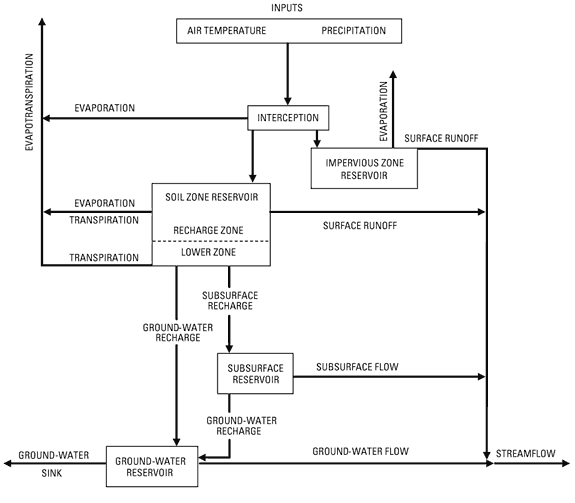
Figure 1. Conceptual Precipitation-Runoff Modeling System.
Seven existing watershed models were examined for this study (fig. 2). The purpose and scope of the different watershed modeling projects, as well as the method of construction and calibration varied significantly. No attempt was made to recalibrate the models or to evaluate the statistical measures of model fit. Selected watershed characteristics are presented in table 1.
Lost River watershed occupies the northwestern part of the Methow River watershed in north-central Washington State and covers an area of about 167 mi2 (fig. 3, table 1). Lost River originates in the Cascade Range and flows south to the confluence of the Methow River. Topography in the Lost River watershed ranges from peaks reaching 8,700 ft above sea level along the Cascade crest down to 2,370 ft at the confluence with the Methow River. Lost River watershed average precipitation for the simulation period (1995–98), as computed by the model, was about 55 in/yr, which accumulates as snow from late autumn to early spring. Annual mean streamflow in 2002 was 265 ft3/s and the highest streamflow resulted from spring snowmelt.
Lost River watershed was simulated as part of the Methow River watershed (Ely and Risley, 2001; Ely, 2003). The purpose of the watershed model was to simulate current and natural streamflow conditions. The model was calibrated using streamflow data from seven steamflow-gaging stations, including Lost River near Mazama (USGS streamflow-gaging station 12447370).
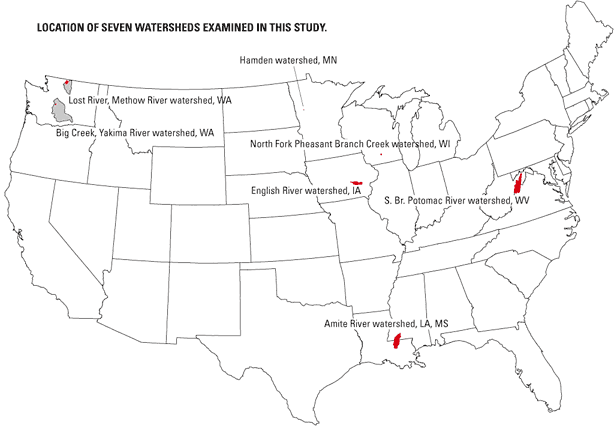
Figure 2. Locations of seven watersheds examined for sensitivity of simulated ground-water recharge.
Table 1. Summary of watershed characteristics and simulation periods for seven watershed models.
| Watershed name | Watershed area (square miles) | Mean altitude (feet) | Simulated recharge (inches per year) | Simulated precipitation (inches per year) | Simulated mean temperature (degrees Fahrenheit) | ||
|---|---|---|---|---|---|---|---|
| Minimum | Maximum | ||||||
| Simulation period 10-01-94 to 09-30-97 | |||||||
| Amite River, Louisiana and Mississippi | 1,335 | 243 | 15.2 | 61.9 | 53.5 | 75.5 | |
| Simulation period 10-01-95 to 09-30-98 | |||||||
| Lost River, Methow River Watershed, Washington | 167 | 5,940 | 6.4 | 54.7 | 26.3 | 41.4 | |
| Big Creek, Yakima River Watershed, Washington | 27 | 4,180 | 14.4 | 75.3 | 36.2 | 49.3 | |
| North Fork Pheasant Branch Creek, Wisconsin | 18 | 1,053 | 6.4 | 33.4 | 35.1 | 53.7 | |
| English River, Iowa | 581 | 837 | 10.4 | 36.5 | 38.4 | 57.7 | |
| South Branch Potomac River, West Virginia | 1,471 | 2,182 | 23.7 | 37.6 | 41.3 | 66.8 | |
| Simulation period 04-01-99 to 09-30-02 | |||||||
| Hamden Watershed, Minnesota | 10 | 1,283 | 0.1 | 28.6 | 34.1 | 56.4 | |
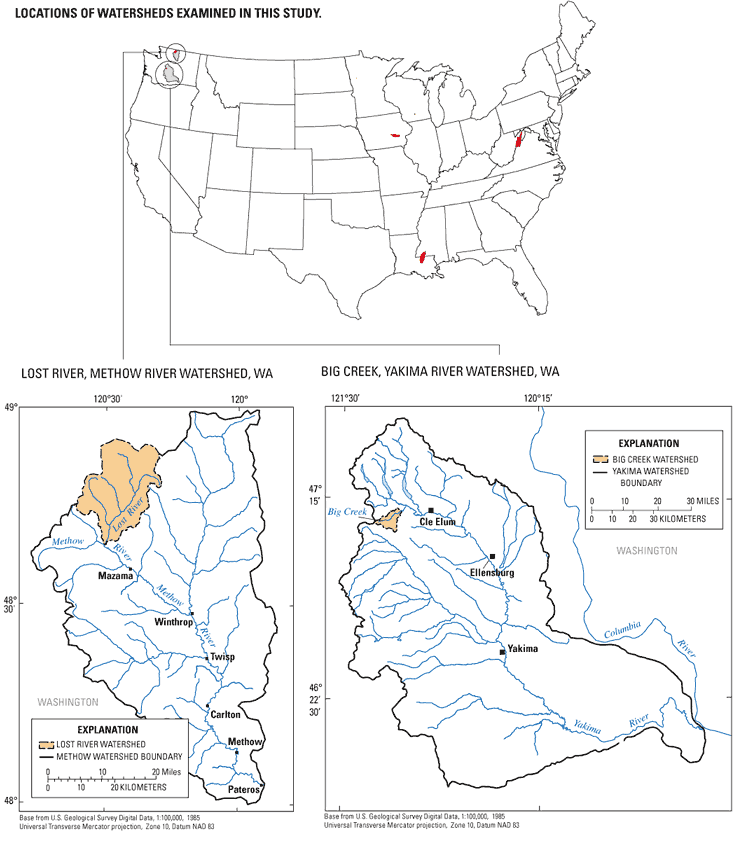
Big Creek is a small watershed in the northwestern part of the Yakima River watershed in south-central Washington State, and covers an area of 27 mi2 (fig. 3, table 1). Big Creek originates on the humid east slope of the Cascade Range, where watershed average precipitation for the simulation period, as computed by the model, was about 75 in/yr. The Big Creek watershed ranges from peaks reaching 4,600 ft above sea level along the Cascade crest down to 2,080 ft at the confluence with the Yakima River. Simulated annual mean streamflow was 90 ft3/s.
Big Creek watershed was simulated as part of the Yakima River Watershed Decision Support System (Mastin and Vaccaro, 2002). The purpose of the model was to provide a tool for improving water management in the watershed. Mean annual streamflow for Big Creek, an ungaged tributary, was estimated by regression equations and calibrated to available snowpack and streamflow data.
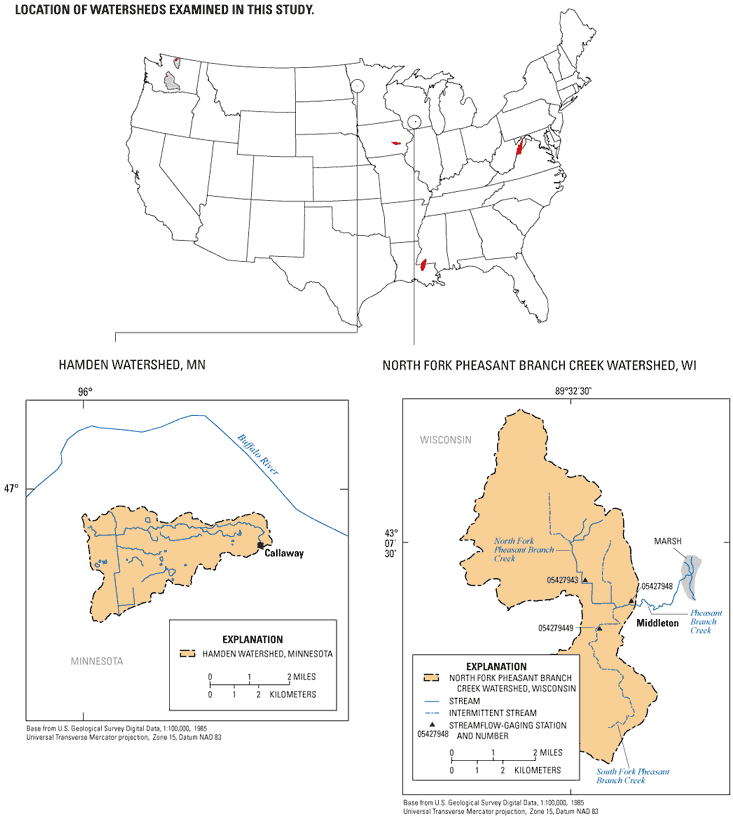
The Hamden watershed site is in west-central Minnesota (fig. 4). The watershed covers 10 mi2 (table 1) in rolling terrain, ranging from 1,420 ft above sea level in the east to 1,230 ft above sea level in the west. Annual precipitation is about 29 in/yr. Many marshes, wetlands, and well-defined drainage channels are at the site.
The Hamden watershed model was developed to investigate the runoff-process relations with wetlands and other landscape features (K.C. Vining, U.S. Geological Survey, written commun., 2003). PRMS modules were designed specifically for routing water to wetland features. After user-defined soil-moisture conditions were met, the remaining water was routed to the ground-water reservoir, stream channel, and wetlands. The model was calibrated for streamflow by adjusting the values and coefficients for soil-water-holding capacity, open wetlands spillage thresholds, and area contribution to streamflow. The addition of wetland storage limited the volume of water routed to the ground-water reservoir.
The North Fork Pheasant Branch Creek watershed, in south-central Wisconsin, comprises the South Fork and North Fork watersheds and a lower system that flows into a marsh. The overall watershed covers an area of 18 mi2 (fig. 4, table 1). Average annual precipitation during 1995–98 was 33 in/yr. Annual mean streamflow for the Pheasant Branch at U.S. Highway 12, near Middleton, Wis. (USGS streamflow-gaging station 05427948) during 1974–99 was 4.6 ft3/s. The watershed consists of gently rolling upland hills, heavily cultivated fields in the flood plains, and large areas of development (Steuer and Hunt, 2001).
A model with an emphasis on the North Fork Pheasant Branch Creek watershed was developed to provide a scientific basis for evaluating changes to the water resources (Steuer and Hunt, 2001). All components of the hydrologic system were quantified, and output from the watershed simulation (recharge) was coupled with a ground-water flow model. The watershed simulation was initially calibrated by trial-and-error adjustments of parameters relating to the annual water balance. Published potential evapotranspiration values, measured infiltration rates, and daily and annual runoff constrained the final calibration.
The international Model Parameter Estimation Experiment (MOPEX) is an ongoing effort adopted as projects of the International Association of Hydrological Sciences and the World Meteorological Organization. The goal of MOPEX is to develop techniques for the a priori estimation of parameters used in atmospheric and hydrologic models. Benchmark watersheds were modeled to create a database of watersheds for future study. The purpose and scope of MOPEX watershed models are considerably different from the other models used in this analysis. MOPEX evolved to address the parameter uncertainty of ungaged watersheds and assess new techniques to decrease the uncertainty.
Three of the humid-region benchmark watersheds were selected for use in the parameter-sensitivity study: Amite River near Denham Springs, Louisiana; English River at Kalona, Iowa; and South Branch Potomac River near Springfield, West Virginia (G. Leavesley, U.S. Geological Survey, written commun., 2004) (fig. 5). The first step to the MOPEX calibration strategy was to make control runs using existing data sets for the watershed climate, soils, vegetation, and topographic features. The second step was to calibrate the model to existing streamflow data and develop relationships between the parameter values and the input data sets.
The Amite River watershed is in southeastern Mississippi and eastern Louisiana. The watershed covers 1,335 mi2 (table 1). Mean altitude of the watershed is 243 ft above sea level and minimum altitude is 0 ft. Amite River watershed average precipitation computed by the model was about 62 in/yr. Annual mean streamflow for the Amite River near Denham Springs, La. (USGS streamflow-gaging station 07378500) during 1939-2001 was 2,120 ft3/s.
The English River watershed is in southeastern Iowa. The watershed covers 581 mi2 (table 1). Mean altitude of the watershed is 837 ft above sea level, with a minimum elevation of 633 ft above sea level. Watershed average precipitation computed by the model was about 36 in/yr. Annual mean streamflow for the English River at Kalona, Iowa (USGS streamflow-gaging station 05455500) during 1940–2003 was 390 ft3/s.
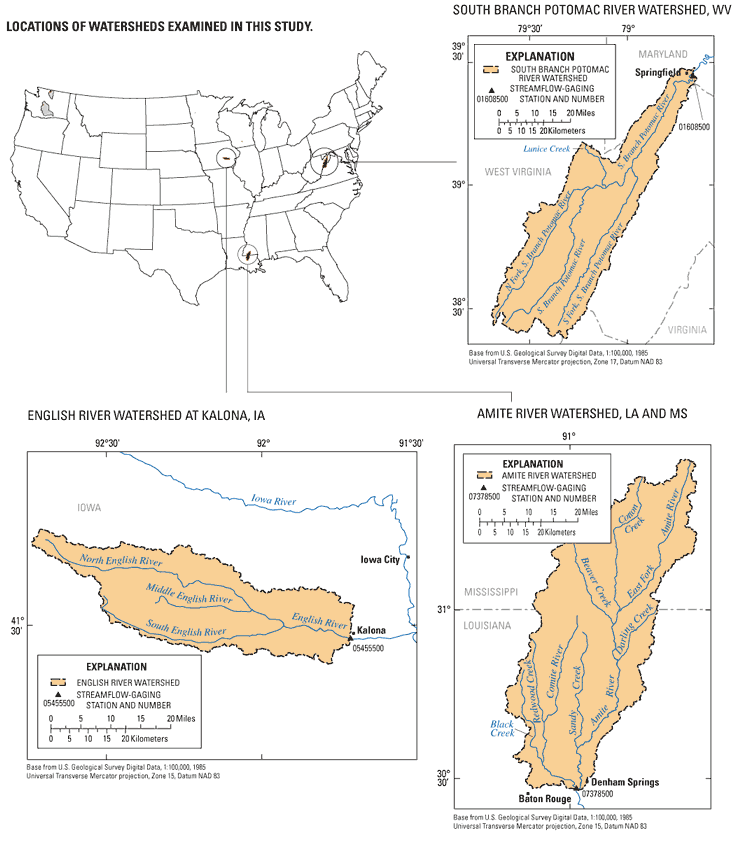
The South Branch Potomac River watershed is in northeastern West Virginia. The watershed covers 1,471 mi2 (table 1). Mean altitude of the watershed is 2,182 ft above sea level, with a minimum altitude of 560 ft above sea level. Watershed average precipitation computed by the model was about 38 in/yr. Annual mean streamflow for the South Branch Potomac River near Springfield, W. Va. (USGS streamflow-gaging station 01608500) during 1900–2002 was 1,340 ft3/s.
For more information about USGS activities in Washington, visit the USGS Washington Water Science Center home page .

![]() U.S. Department of the Interior |
U.S. Geological Survey
U.S. Department of the Interior |
U.S. Geological Survey
Persistent URL: https://pubs.water.usgs.gov/sir20065041
Page Contact Information: Publications Team
Page Last Modified: Thursday, 01-Dec-2016 18:55:17 EST
