Scientific Investigations Report 2006-5041
U.S. GEOLOGICAL SURVEY
Scientific Investigations Report 2006-5041
The nonlinear regression model UCODE (Poeter and Hill, 1998) was used to analyze the sensitivity of recharge to parameters for the seven existing watershed models. No attempt was made to recalibrate the models or to evaluate the statistical measures of model fit. The diagnostic statistics generated by UCODE were used to measure the amount of information provided by the data.
UCODE is a computer program that uses nonlinear regression to minimize a weighted least-squares objective function with respect to the parameter values using a modified Gauss-Newton method. UCODE is a universal inverse model that can be applied to any model, making it powerful and versatile. UCODE also can use standard linear methods to generate diagnostic statistics that measure the amount of information provided by the data. Two statistics of greatest utility in this study were dimensionless scaled sensitivities (DSS) and composite scaled sensitivities (CSS). A complete discussion of these statistics is given in Hill (1998) and Poeter and Hill (1998).
Dimensionless scaled sensitivities indicate the importance of an observation (here, the daily mean recharge) to the estimation of a parameter or, conversely, the sensitivity of the simulated equivalent of the observation to the parameter.
Composite scaled sensitivities indicate the information content of all the observations for the estimation of a parameter.
Poeter and Hill (1998) explained that one sensitivity equals the derivative of a simulated value with respect to one parameter. The dimensionless scaled sensitivity,
![]() , is calculated as (Hill, 1998):
, is calculated as (Hill, 1998):
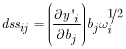 , (1)
, (1)
where

|
identifies one of the observations, |

|
identifies one of the parameters, |

|
is the simulated value associated with the |

|
is the |

|
is the sensitivity of the simulated value associated with the |

|
is the weight for the |
CSS summarize all the sensitivities for one parameter. CSS are calculated for each parameter using the dimensionless scaled sensitivities for all observations. Because they are dimensionless, CSS can be used to compare the amount of information provided by different types of parameters. Model simulation results will be more sensitive to parameters with large CSS relative to those for other parameters. The CSS for the![]() parameter, cssj, is calculated as (Hill, 1998):
parameter, cssj, is calculated as (Hill, 1998):
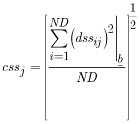 , (2)
, (2)
where

|
is the number of observations being used in the regression, |

|
is a vector that contains the parameter values at which the sensitivities are evaluated, |
and the quantity in parenthesis equals the scaled sensitivities of equation 1.
Parameter correlation coefficients indicate if two or more parameters can be uniquely estimated (optimized) by nonlinear regression. They are calculated as the covariance between two parameters, divided by the product of the standard deviation. Correlation coefficients range from -1.0 to 1.0 and absolute values larger than 0.95 may indicate a possible high degree of correlation. If extreme parameter correlation exists, the correlation coefficient will be close to 1.0 or -1.0. A low degree of correlation implies that the action of one parameter is independent of the action of another parameter with regard to the value of the simulated output. The implications of non-unique parameter values are explained in Poeter and Hill (1997).
In this study, MMS was the application model executed by UCODE. UCODE manipulates the input parameter file of the existing watershed model and reads the simulated recharge values from the MMS output file. For the purposes of this study, “recharge” was defined as the area-weighted average of inflow to the ground-water reservoir. Other studies have defined the recharge rate as the flow from the ground-water reservoir to the outlet (Steuer and Hunt, 2001; Lee and Risley, 2002).
The significance of 17 parameters to ground-water recharge estimates (table 2) was analyzed for this study. Sixteen parameters were analyzed for all of the calibrated watershed models. An additional parameter defining the amount of snowpack that could infiltrate the soil (groundmelt) was analyzed for the Big Creek and Lost River watersheds, Washington. The additional groundmelt component supplies much of the water needed to support low flows when a watershed is snow-covered. Groundmelt is added to the upper part of the HRU soil zone.
Parameters were chosen that likely would have the greatest effect on recharge. From a physical point of view, those parameters that directly route water out of the subsurface reservoir, into the ground-water reservoir, or into streams, or that control ET should always be important because they directly affect the amount of water reaching the ground-water reservoir. Parameters that control the quantity of recharge as a function of soil and subsurface reservoir water storage volume should be considered important under most circumstances. Two other parameters determined the form of precipitation (rain versus snow) and the snow-covered area depletion curve.
Parameters directly responsible for the amount of precipitation were not included in the recharge-parameter analysis. The amount of precipitation, either as rain or as snow, was understood to have the greatest effect on recharge; therefore, those parameter sensitivities could overwhelm other sensitivities and mask subtler effects of the ground-water flow processes.
Scaled sensitivities were calculated by perturbing (increasing and decreasing) the final parameter values of the calibrated model and calculating the derivative of the simulated value (recharge), with respect to the parameter. The size of the perturbation is calculated as a user-specified factor. All parameters except tmax_allsnow were perturbed by 10 percent. Tmax_allsnow was perturbed by 1 percent, due to the relatively large parameter value (32 to 35°F).
One limitation of this method is that integer values representing a soil type (1 = sand, 2 = loam, 3 = clay) or land cover type (0 = bare soil, 1 = grasses, 2 = shrubs, 3 = trees) could not be evaluated directly. Parameters associated with tree-cover density and soil properties were used as proxies.
[Abbreviations: ET, evapotranspiration; HRU, Hydrologic Response Unit]
| Parameter | Description |
|---|---|
| covden_sum | Vegetation-cover density for summer. |
| covden_win | Vegetation-cover density for winter. |
| groundmelt | Amount of snowpack water that melts each day to soils. |
| jh_coef | Monthly air-temperature coefficient used in the Jensen-Haise potential ET computations. |
| rad_trncf | Transmission coefficient for short-wave radiation through the winter canopy. |
| smidx_coef | Coefficient in nonlinear contributing-area algorithm. |
| snarea_thresh | Maximum snow-water equivalent below which the snow-covered area depletion curve is applied. |
| snow_intcp | Snow-interception storage capacity for the major vegetation type on an HRU. |
| snowinfil_max | Maximum infiltration rate for snowmelt, in inches per day. |
| soil_moist_max | Maximum available water-holding capacity of soil profile, in inches. |
| soil_rechr_max | Maximum value for available water in the soil-recharge zone, in inches. |
| soil2gw_max | Maximum amount of soil-water excess for an HRU that is routed directly to the associated ground-water reservoir, in inches per day. |
| srain_intcp | Summer rain-interception storage capacity for the major vegetation type on an HRU, in inches. |
| ssr2gw_rate | Coefficient to route water from the subsurface to ground-water reservoir. |
| ssrcoef_lin | Coefficient to route subsurface storage to streamflow. |
| tmax_allsnow | Maximum temperature below which all precipitation is simulated as snow. |
| wrain_intcp | Winter rain-interception storage capacity for the major vegetation type on an HRU, in inches. |
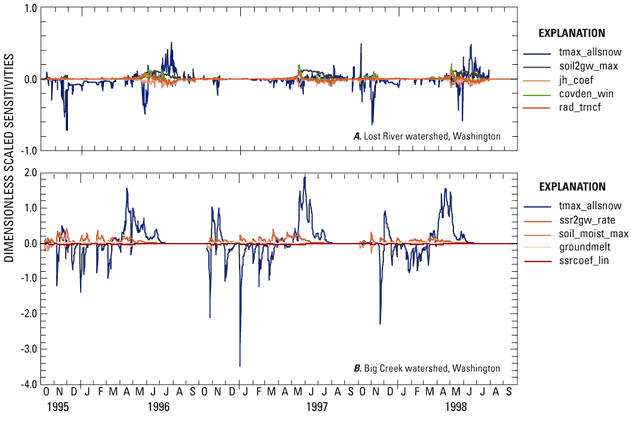
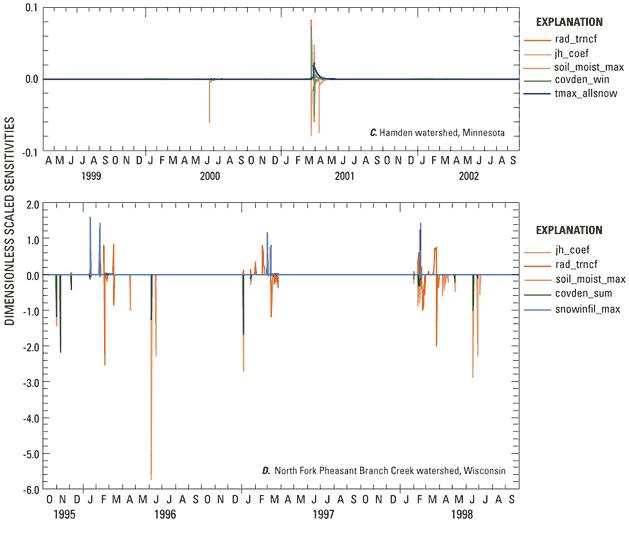
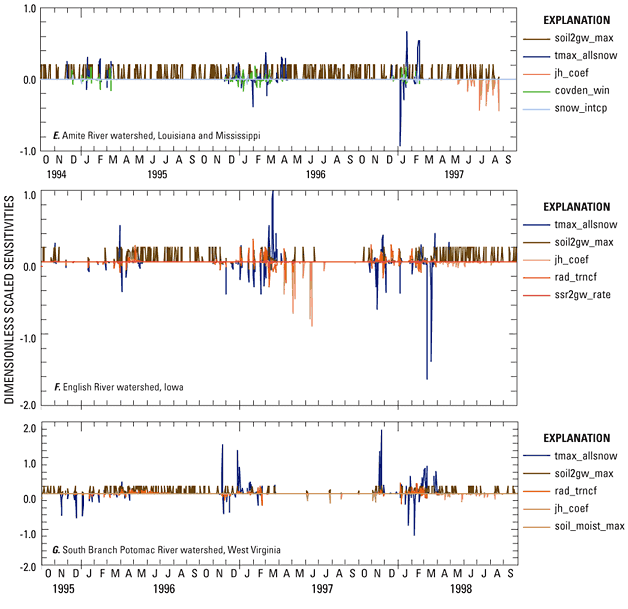
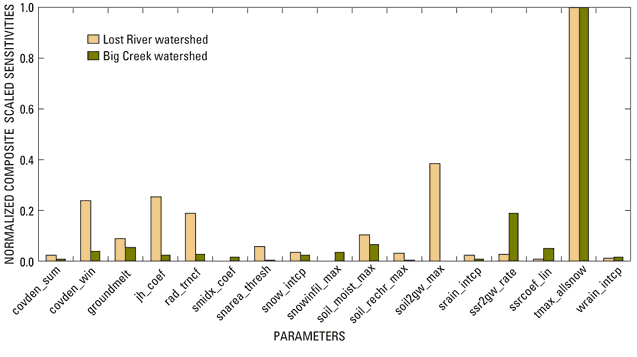
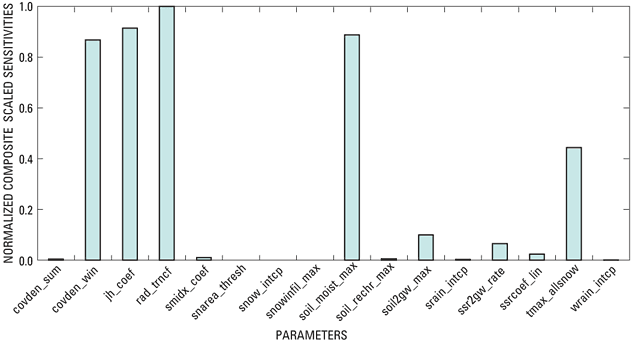
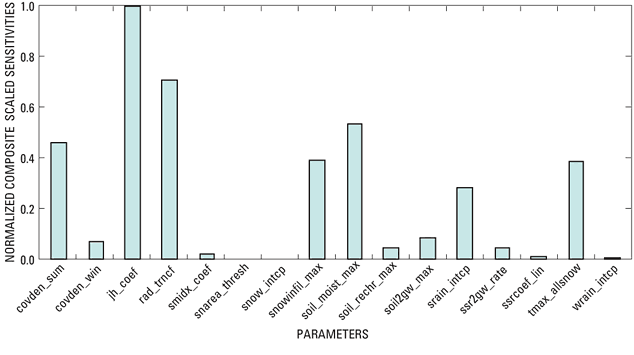
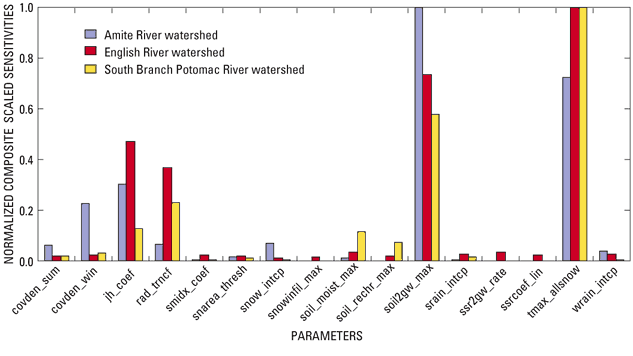
DSS for the five most significant parameters in each watershed were used to present the results of the sensitivity analyses (fig. 6). The CSS of all parameters were normalized by dividing their final values by the maximum CSS (figs. 7–10). No parameter correlation coefficient for any of the seven watershed models indicated an inability to uniquely estimate a parameter value (absolute value greater than 0.95) (table 3).
The Lost River and Big Creek watersheds, Washington, are similar; both are high-altitude, mountainous watersheds with an average precipitation exceeding 50 in/yr and the coldest temperatures of the seven watersheds. Much of the precipitation is snow, and the spring snowmelt produces the peak streamflow. The greatest CSS in both watersheds was tmax_allsnow (maximum temperature below which all precipitation is simulated as snow), as much as five times greater than the next greatest CSS (fig. 7). Tmax_allsnow controls the amount of excess water available in the soil that then can be routed directly to ground water or to the subsurface and then the ground water. It can affect recharge volume by affecting actual evapotranspiration (AET) (for example, the more snowmelt, the longer soils can be saturated). This effect could be insignificant if the snowmelt occurs during periods of low AET.
Tmax_allsnow determines whether the precipitation falls as snow or rain, and therefore affects the timing of recharge more than it does the total volume. The importance of tmax_allsnow is related to the number of days the simulated maximum daily temperature ranges between 30 and 35ºF. Those days are represented by the spikes in the graphs of DSS (fig. 6 A, B). A change of 0.3ºF in the simulated maximum daily temperature would affect the form of precipitation (rain or snow) on 20 days in the Lost River watershed and 25 days in the Big Creek watershed over the 3-year simulation period. The sensitivity of recharge to this parameter also indicates the susceptibility of these watersheds to minor climate change. As with streamflow, much of the ground-water recharge originates as snowmelt.
The second most important parameters for the Lost River and Big Creek watersheds are both “routing” parameters. Recharge in Lost River watershed is sensitive to soil2gw_max, the maximum amount of soil-water excess routed directly to the associated ground-water reservoir. Recharge in Big Creek watershed is sensitive to ssr2gw_rate. This parameter is a coefficient to route water from the subsurface to the ground-water reservoir. The importance of two different parameters that both route water to the ground-water reservoir in similar watersheds could indicate a difference in the focus of calibration. The modeler could preferentially route water to the ground-water reservoir from one source over another, increasing the sensitivity.
The calibration approach can affect any parameter that sets a maximum amount of flow. If the parameter value is set unrealistically high, or if the simulated value never approaches the maximum value, the parameter will appear to be insensitive. For example, if soil_moist_max (maximum available water-holding capacity of the soil profile) is set to 6 in., but the simulated water in the soil profile only reaches 2 in., the simulation will be insensitive to small perturbations of the parameter value. However, if that same parameter value is set to 1.5 in., the simulation will be very sensitive as it routes the excess soil moisture to a different reservoir.
[See table 2 for parameter definitions]
| Watershed name | Parameter / Parameter | Correlation coefficient |
|---|---|---|
| Lost River, Methow River Watershed, Washington | (1) | |
| Big Creek, Yakima River Watershed, Washington | smidx_coef / soil_moist_max | -0.94 |
| snow_intcp / wrain_intcp | .94 | |
| ssr2gw_rate / ssrcoef_lin | .90 | |
| North Fork Pheasant Branch Creek, Wisconsin | covden_sum / srain_intcp | -.90 |
| Amite River, Louisiana and Mississippi | smidx_coef / soil_moist_max | -.92 |
| English River, Iowa | (1) | |
| South Branch Potomac River, West Virginia | (1) | |
| Hamden Watershed, Minnesota | (1) |
1 None greater than 0.85 or less than -0.85.
All DSS for the Hamden watershed in Minnesota were low (fig. 6C). Most of the water satisfied soil moisture conditions and the remainder flowed to the stream channel and wetlands. Simulated flow to the ground-water reservoir was greater than 0.005 in/d only twice, 1 week in June 2000 and 1 month in spring 2001. For these two periods, recharge was sensitive to the parameters that control AET (covden_win, jh_coef, rad_trncf, and soil_moist_max,) (fig. 8).
The North Fork Pheasant Branch watershed simulation shows various important parameters suggesting no single dominant process. Steuer and Hunt (2001) report that much of the recharge at the North Fork Pheasant Branch watershed, Wisconsin, occurs during winter and spring, when snow is melting, or during autumn, when ET is reduced. The high recharge parameter sensitivities for jh_coef (monthly air‑temperature coefficient used in the Jensen-Haise potential ET computations), rad_trncf (transmission coefficient for short-wave radiation through the winter canopy), and covden_sum (vegetation-cover density for summer) indicate the importance of ET in limiting the summer recharge and allowing the autumn and winter recharge (figs. 6D and 9). Maximum air temperature is between 30 and 35ºF many days each year in the North Fork Pheasant Branch watershed, but less precipitation falls during this time; therefore, tmax_allsnow is ranked as only the sixth most important parameter to recharge.
Parameter sensitivities for the three MOPEX watersheds were remarkably similar. Recharge in the Amite River, English River and South Branch Potomac River watersheds was highly sensitive to tmax_allsnow and soil2gw_max. Jh_coef was ranked third for two of the watershed simulations and fourth for the other simulation (figs. 6E-G). Tmax_allsnow and jh_coef are sensitive only during specific episodes indicating unique conditions resulted in the recharge being sensitive to the parameters. DSS for tmax_allsnow spiked for short periods, typically 1 day to 1 week, when precipitation fell and temperatures were near 35°F in the MOPEX watershed simulations.
More interesting is the similarity of the CSS and DSS for soil2gw_max (figs. 6E-G and fig. 10). The rather continuous high sensitivity of soil2gw_max indicates that soil saturation has dominant control over recharge through most of the year. On 18 percent of the days in the Amite River simulation and 11 percent of the days in the English River and South Branch Potomac River simulations, recharge equaled soil2gw_max. That means the soil-profile water excess supplied the only flow on those days to the ground-water reservoir.
Seasonal and episodic DSS values greatly influence CSS values in some instances. Unique events that result in high DSS can skew the significance of long-term trends measured by CSS values. A longer or different simulation/analysis period could indicate different parameter sensitivities.
For more information about USGS activities in Washington, visit the USGS Washington Water Science Center home page .

![]() U.S. Department of the Interior |
U.S. Geological Survey
U.S. Department of the Interior |
U.S. Geological Survey
Persistent URL: https://pubs.water.usgs.gov/sir20065041
Page Contact Information: Publications Team
Page Last Modified: Thursday, 01-Dec-2016 18:55:19 EST
