Scientific Investigations Report 2007–5044
U.S. GEOLOGICAL SURVEY
Scientific Investigations Report 2007–5044
The ground-water flow model known as MODFLOW-2000 (Harbaugh and others, 2000) is used to simulate ground-water flow in the SVRP aquifer. MODFLOW-2000 is a computer program that numerically solves the three-dimensional ground-water flow equation for a porous medium by using the finite-difference method. The modular design of MODFLOW-2000 uses packages to represent various components of the ground-water flow system, such as recharge, withdrawal from wells, and interactions between the aquifer and surface-water bodies.
A model grid of 172 rows, 256 columns, and 3 layers is used to represent the SVRP aquifer. In the horizontal direction, each cell has a dimension of 1,320 by 1,320 ft. The areal extent of the grid is larger than the model area. The larger grid is intended to accommodate possible enlargements of the model area in future studies. Cells outside the model area are designated as inactive in MODFLOW-2000. The active cells in model layers 1 and 3 and shown in figures 32 and 33.
Vertically, the SVRP aquifer is represented by either one or three model layers. Except in Hillyard Trough and Little Spokane River Arm, the aquifer is represented by the top model layer (layer 1); cells in model layers 2 and 3 are inactive. In Hillyard Trough and the Little Spokane River Arm, the aquifer is represented by three model layers. Vertical section A-B-C-D in figure 34 shows how the model layers represent the dividing of the aquifer from a single hydrogeologic unit into an upper and a lower unit separated by a clay layer. From A to B, the aquifer exists as a single hydrogeologic unit and is represented solely by model layer 1. Model layers 2 and 3 have zero thicknesses and are designated as inactive. From B to C, the aquifer exists as a single hydrogeologic unit but is represented by all three model layers. Model layer 2 has a uniform thickness of 1 ft, but model layer 3 gradually thickens from B to C. Point C marks the location where the aquifer divides into an upper and a lower unit. From C to D, model layer 1 represents the upper unit, model layer 2 represents the clay layer, and model layer 3 represents the lower unit. The altitude at the top of the clay layer is set at 1,700 ft in Hillyard Trough and decreases to 1,500 ft in the Little Spokane River Arm. The thickness of the clay layer is assumed to be 150 ft in both Hillyard Trough and the Little Spokane River Arm. In the input data for MODFLOW-2000, model layer 1 is specified as an unconfined layer. Model layers 2 and 3 are specified as confined layers.
Ground-water flow in the SVRP aquifer is simulated for September 1990 through September 2005. The simulation period is divided into 181 stress periods of 1 month each. Monthly stress periods are needed to simulate the dynamic interaction between the aquifer and the Spokane River as shown by the hydrograph in figure 24. Each stress period consists of one time step. Using one time step per stress period was determined to be adequate because trial simulations using several time steps per stress period yielded essentially the same results.
Because the distribution of heads in the aquifer is unknown at the beginning of the simulation period, the initial heads are computed assuming a steady-state ground-water flow system during the first stress period (September 1990). The heads simulated during the first stress period serves as the initial conditions for the rest of the transient simulation. In reality, flow in the aquifer is not at steady state during September 1990, and the simulated heads for that month do not accurately represent the actual heads in the aquifer. To eliminate the effects of this error, the first 5 years of the simulation is considered a start-up period. No attempt is made to fit simulated quantities to measured quantities during the start-up period. Instead, hydrologic data from October 1995 to September 2005 are used for model calibration. The calibrated model is expected to produce simulated conditions at the end of the start-up period (October 1995) that are close to the corresponding actual conditions in the aquifer, because the error caused by the assumed initial conditions would have dissipated.
A no-flow boundary is specified on the bottom of the model domain. Along the sides of the model domain, the no-flow boundary is specified except for locations where the aquifer receives inflow from tributary basins and lakes and where ground water exits the lower unit at the west end of the Little Spokane River Arm. Boundary conditions other than the no-flow boundary are implemented in the model using various MODFLOW packages. These packages represent inflow and outflow components discussed previously in the sections, “Inflows to Aquifer” and “Outflows from Aquifer.”
The Recharge Package is used to simulate recharge from precipitation. Recharge is applied to the top model layer. For each active cell and for each stress period (that is, for each month), the recharge is the precipitation infiltration flux (in units of feet per day) that enters the ground-water table. This recharge is derived from (1) precipitation that infiltrates into permeable land surfaces and (2) precipitation runoff from impermeable land surfaces to recharge wells, infiltration basins, or adjacent permeable surfaces.
The Well Package is used to simulate withdrawals from wells, return percolation from irrigation, and effluent from septic systems. For each active cell and for each stress period, a positive well flow value (in units of cubic feet per day) indicates a volumetric recharge rate, and a negative well flow value indicates a volumetric withdrawal rate. In the model, the well flow value for each cell is the net result of well withdrawals, return percolation from irrigation, and effluent from septic systems. For example, within a water purveyor service area, a cell that contains a water-supply well has a large negative well flow value, which is dominated by the well withdrawal rate. By contrast, a cell that does not contain a water-supply well has a small positive well flow value, which represents return percolation from landscape irrigation.
The Flow and Head Boundary Package (Leake and Lilly, 1997) is used to simulate flows to the SVRP aquifer from tributary basins and from all lakes except Lake Pend Oreille and Coeur d’Alene Lake. For each tributary basin that drains to the aquifer (fig. 10), flow from the basin is assigned as specified flow to the active cell that contains or is closest to the outflow point. An exception to this procedure is made along the east margin of northern Rathdrum Prairie. In that area, the saturated zone is a thin layer overlying bedrock. If flow from the tributary basin is applied to a single cell, a very large buildup in head would result. To avoid this situation, flow is distributed uniformly among active cells along the model boundary. The cells that receive flow from tributary basins are shown in figure 32. For the lakes, flow to the aquifer is distributed uniformly among active model cells along the lakeshore (fig. 32).
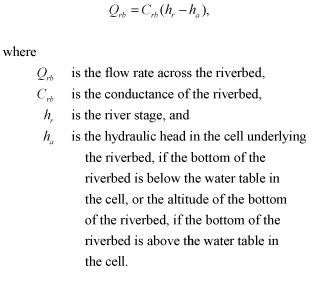
The River Package is used to simulate the Little Spokane River, Lake Pend Oreille, and Coeur d’Alene Lake. In the River Package, a river reach refers to the section of a river with a model cell. For a river reach, the volumetric flow rate across the riverbed to the underlying model cell is computed as
 (6)
(6)
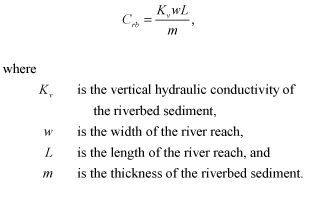
The conductance of the riverbed is given by
 (7)
(7)
However, Kv, w, L, and m are not individually specified in the River Package. Instead, conductance of the riverbed, Crb, is specified. Model cells used in the River Package are shown in figure 32.
To apply the River Package to the Little Spokane River, the following procedure is used to determine the river stage, hr. For each stress period, the average stage (over the stress period) is computed at the gaging stations on the Little Spokane River at Dartford and near Dartford from daily recorded values. Because no gaging stations are located on the Little Spokane River downstream of the gaging station near Dartford, the stage at the mouth of the river (where the river joins the Spokane River) is estimated from the Nine Mile Falls USGS 7.5-minute topographic quadrangle to be 1,544 ft. For each river reach between the gaging stations at Dartford and near Dartford, the stage is estimated by assuming a uniform gradient in river level between the two gaging stations. A similar procedure is used to estimate the stage of a river reach between the gaging station near Dartford and the mouth of the river.
For each reach of the Little Spokane River in the model, the altitude of the bottom of the riverbed is assumed to be 10 ft below the river stage. This assumption is inconsequential to the simulation because the simulated head in the cell underlying the river reach is always higher than the bottom of the riverbed. Therefore, ha in equation 6 is always the hydraulic head in the cell. A single riverbed conductance is assigned to all reaches of the Little Spokane River. This conductance value, denoted as C-LSR, is estimated by model calibration.
Because equation 6 also can be used to describe lakebed seepage, the River Package is used to simulate subsurface seepage from Lake Pend Oreille and Coeur d’Alene Lake. For this usage, the terms river and riverbed in the definitions of variables in equation 6 are replaced, respectively, by lake and lakebed. The River Package is implemented at model cells underlying the near-shore region of the lake. For each stress period, the lake stage is specified as the average of the daily recorded lake levels over the stress period. Based on lake bathymetry data, the altitude of the bottom of the lakebed in the near-shore region is set to 1,860 ft for Lake Pend Oreille and 2,090 ft for Coeur d’Alene Lake. As in the case of the Little Spokane River, a single lakebed conductance is assigned to each lake. These two conductance values, denoted as C-PO for Lake Pend Oreille and C-CDA for Coeur d’Alene Lake, are estimated by model calibration.
The Streamflow-Routing Package (Prudic and others, 2004) is used to simulate the interaction between the Spokane River and the SVRP aquifer. In the Streamflow Routing Package, equations used to compute flow between the stream and the aquifer were the same as equations 6 and 7 in the River Package. However, the Streamflow-Routing Package is more powerful than the River Package because it provides various methods for routing water through a stream network.
The Streamflow-Routing Package requires data on stream-channel geometry. In the SVRP aquifer model, the channel of the Spokane River is approximated as having a rectangular cross section. Channel width and the altitude of the top of the streambed are estimated at 16 control points along the river from field measurements and data from previous studies (Seitz and Jones, 1981; Annear and others, 2001) and then linearly interpolated between control points. The thickness of the streambed sediments (m) is assumed to be 1 ft. This assumption is not critical to the simulation because the streambed conductance depends on Kv/m, where Kv is the vertical hydraulic conductivity of the streambed sediments. Thus, the actual variation in m can be included in the variability of Kv.
To represent Kv of the streambed sediment, the Spokane River in the model area is divided into 11 sections (fig. 35). Within each section, Kv is assumed to be uniform. Selection of the 11 river sections is based partially on factors that might affect Kv. For example, the character of the streambed sediment in a free-flowing part of the river might be different from the character of the streambed sediment where the river is a reservoir behind a dam. In addition, Caldwell and Bowers (2003) noted that the transport of fine-grained material with the leaking water from the Spokane River might decrease Kv of the streambed sediments along a losing section of the river. The Kv values of the 11 river sections are denoted by KVSR-1 through KVSR-11 and are estimated by model calibration.
Although the Streamflow-Routing Package is capable of simulating stream depth as a function of stream discharge using either Manning’s equation or a rating curve, this capability is not used in the SVRP aquifer model because of the presence of dams, spillways, and reservoirs on the Spokane River. Instead, for every time step, stream stage is specified for every stream reach in the model. In this usage, the Streamflow-Routing Package functions in a manner similar to the River Package with the added capability of calculating a stream water budget for each stream reach.
Data used to determine stream stages include: (1) stage measurements at the four gaging stations on the Spokane River, (2) stage measurements for 1999 and 2000 for seven bridges across the Spokane River (Reanette Boese, Spokane County Utilities, written commun., 2006), and (3) levels of Coeur d’Alene Lake, Long Lake, and Nine Mile Reservoir. The altitude of Upriver Reservoir is assumed to be constant at 1,914 ft. The given data provide stream stages at 15 control points along the Spokane River. Between control points, stream stage is estimated by linear interpolation. If the stage data at a control point do not span the entire simulation period (1990–2005), a mathematical relation is developed between the available stage measurements at the control point and the corresponding stage at the gaging station near Post Falls (which has stage data for the entire simulation period). The relation between the stage at the Sullivan Road Bridge (where stage data are available for 1999 and 2000) and the stage at the gaging station near Post Falls is shown in figure 36. The equation shown in figure 36 is used to estimate the stage at Sullivan Road Bridge for periods with no stage data.
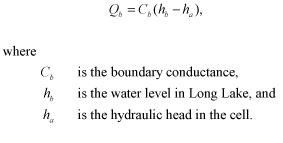
The General-Head Boundary Package is used to simulate ground-water outflow from the lower unit at the west end of the Little Spokane River Arm. Available field data indicate that the lower unit extends beyond the model boundary, and ground water flows in the unit for an unknown distance before eventually discharging into Long Lake. The General-Head Boundary Package is used as an approximate representation of this conceptualization and is applied to four active cells at the west edge of model layer 3 (fig. 33). Ground-water outflow from each cell is computed as
 (8)
(8)
For each stress period, hb is the average of the daily recorded levels of Long Lake over the stress period. A single boundary conductance, denoted as C-OUT, is assigned to all four cells, and the conductance is estimated by model calibration.
To represent the spatial distribution of Kh in the SVRP aquifer, active cells in model layer 1 are grouped into 22 zones, denoted by HK1-1 through HK1-22, as shown in figure 37. Within each zone, Kh is uniform. Zones HK1-1 through HK1-11 represent the central part of the aquifer in Rathdrum Prairie, Spokane Valley, and the upper unit in Hillyard Trough and the Little Spokane River Arm. Zones HK1-12 and HK1-13 represent Trinity Trough and Western Arm, respectively. Zones HK1-14 and HK1-15 represent the areas in the vicinity of Hayden and Coeur d’Alene. Zones HK1-16 through HK1-22 represent side valleys and regions of shallow bedrock along the aquifer margins. Zone HK1-22 is included as a separate zone to represent a small side valley north of Coeur d’Alene. This arrangement provides greater flexibility during model calibration to simulate water levels in well 140, which is located in the side valley. The Kh values for zones HK1-1 through HK1-22 are estimated by model calibration. For all active cells in model layer 1, Kv is set to 3,000 ft/d. This Kv value is intended to allow water to flow freely from model layer 1 into model layer 3 in the region south of the clay layer in Hillyard Trough.
Active cells in model layer 2 are grouped into two zones as indicated in figure 38. One zone represents the clay layer in Hillyard Trough and the Little Spokane River Arm. Kh and Kv values of these cells are set to 10-8 ft/d. The other zone provides hydraulic connection between model layers 1 and 3 in the region south of the clay layer. These are the 1-ft thick cells shown along section B-C in figure 34. Kh and Kv values of these cells are set to 3,000 ft/d.
Active cells in model layer 3 are grouped into two zones as shown in figure 39. Zone HK3-1 consists of cells in Hillyard Trough. Zone HK3-2 consists of cells in the Little Spokane River Arm. Kh values of both zones are estimated by model calibration. As in the case of model layer 1, all active cells in model layer 3 are assigned a Kv value of 3,000 ft/d to establish a direct hydraulic connection between model layers 1 and 3 in the region south of the clay layer in Hillyard Trough.
The spatial distribution of SY is represented by three zones as shown in figure 40. Because SY values are expected to fall within a relatively limited range (0.1 – 0.3), fewer zones are used to represent the spatial distribution of SY than to represent the spatial distribution of Kh. Zone SY-1 represents, approximately, that part of the SVRP aquifer where water-level fluctuations are controlled primarily by recharge from precipitation. By contrast, zone SY-2 represents, approximately, that part of the aquifer where water-level fluctuations are controlled primarily by the Spokane River. Zone SY-3 represents regions of shallow bedrock along the margins of Rathdrum Prairie where water-level fluctuations are controlled by both recharge from precipitation and inflows from tributary basins and adjacent uplands. The three SY values are estimated by model calibration.