Scientific Investigations Report 2007–5180
U.S. GEOLOGICAL SURVEY
Scientific Investigations Report 2007–5180
Stream discharge, water temperature, pH, dissolved oxygen concentration, specific conductance, and turbidity were measured on-site in the field to characterize water quality during sampling. Samples of water were collected for laboratory analyses of filtered (0.45 µm pore size) and unfiltered nutrients, filtered (0.7 µm pore size) pesticides, and suspended sediment. Samples also were collected for fecal-indicator bacteria analysis (Morace and McKenzie, 2002). During the October sampling period, samples for selected dissolved metals were collected (Fuhrer and others, 2004).
Water-quality samples were collected by USGS personnel and representatives from Benton Conservation District, Kittitas Conservation District, Roza-Sunnyside Board of Joint Control, and South Yakima Conservation District as part of their routine sampling operations. The majority of the samples were collected by USGS personnel using procedures described in the following paragraphs.
Glass and fluorocarbon polymer (PFTE) equipment used to collect and process samples were cleaned with a 0.1 percent phosphate-free detergent solution, rinsed with tap water, rinsed with a 5 percent hydrochloric acid solution, rinsed with distilled water, and rinsed with pesticide-grade methanol. Metal equipment were cleaned similarly, but were not acid rinsed to prevent pitting and corrosion. Sampling equipment was either wrapped in clean aluminum foil or sealed in clean plastic bags and stored in a dust free environment prior to sample collection (U.S. Geological Survey, variously dated).
Due to the small size and unusual characteristics of many sites, dip samples frequently were collected; however, when conditions permitted, depth- and width-integrated samples were collected according to the protocols outlined in the USGS National Field Manual (U.S. Geological Survey, variously dated). When dip samples were collected, the sampling crew evaluated the site and modified or devised a technique to obtain a sample that was representative of the water at that site (U.S. Geological Survey, variously dated). Samples were collected by using a US DH-81 or US D-77 TM sampler (Edwards and Glysson, 1999), immersing sample bottles by hand in the stream or drain, or pumping water from the stream or drain using a pesticide-grade pump outfitted with a glass J-tube. Regardless of the collection method, an attempt was made to collect a depth- and width-integrated sample at all sites. Samples were collected into 3-liter PFTE bottles, 1-liter PFTE bottles, 1-liter narrow-mouth baked glass bottles or 1-liter wide-mouth baked glass bottles.
Water for pesticide analyses was pumped from its sampling vessel using flexible PFTE tubing connected to a valveless piston-metering pump. The water was filtered through a stainless-steel filtration unit containing a glass-fiber filter (0.7 µm pore diameter). The pumps and filters, and protocols for their use are described in the USGS National Field Manual (U.S. Geological Survey, variously dated). Samples were stored on ice and shipped within 36 hours of collection to the USGS National Water Quality Laboratory (NWQL) in Lakewood, Colorado.
Pesticide samples were analyzed at the USGS NWQL. A total of 121 pesticides and pesticide degradates were analyzed by C-18 solid-phase extraction and capillary-column gas chromatography/mass spectrometry with selected-ion monitoring (Zaugg and others, 1995; Sandstrom and others, 2001). An additional 58 pesticides and pesticide degradates were analyzed by graphitized carbon-based solid-phase extraction and high-performance liquid chromatography/mass spectrometry (Furlong and others, 2001). A list of analytes is provided in appendix A.
Fifty-six samples were collected for quality control: 13 blank samples, 30 replicate samples, and 12 spike samples. With one exception, all blank water samples were free from pesticide residue. The fungicide myclobutanil was detected at 0.006 µg/L in one sample. This concentration is near the reporting level (RL) and was coded by the lab as an estimated value. This detection was very likely the result of carryover in contaminated equipment. The prior sample collected with the same equipment contained 4.74 µg/L of myclobutanil, which was the largest concentration of this compound detected in the study, exceeding the next largest by a factor of 50.
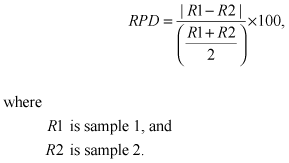
Replicate samples were used to evaluate lab and environmental variability. Most replicates were collected sequentially, and therefore recorded both sources of variability. Replicate samples were compared using the relative-percent difference (RPD) and absolute difference (AD) in the concentration of each analyte in the paired sample. The RPD was calculated as:
The distribution of RPD and AD values are shown in figure 1 for 93 analyte pairs for which these values could be calculated. The median RPD was 7.3 percent and the median AD was 0.001 µg/L. Five pairs exceeded the 95th percentile RPD value of 73.4 percent. In four of the five pairs, the greatest concentration was less than 2 times the RL, and in the fifth it was less than 2.5 times the RL.
RPD and AD could not be computed for 28 analyte pairs because the concentration in one of the two samples was not detected. In most samples, the one quantified concentration was near the RL for the analyte (fig. 2), and in all but two samples was less than two times the RL. The remaining two data points may reflect laboratory variability—since these data were collected, the RL for both of these analytes (methomyl and didealkylatrazine) has been increased. Using the current RLs, the methomyl sample would be 2.9 times the RL and the didealkylatrazine sample would be 1.5 times the RL. The nondetections in these 28 replicate pairs are interpreted as false negatives (reporting an analyte as not detected when it actually is in the water), due to the nearness to the RL. Three lines of evidence lend weight to this interpretation. First, only one pesticide was detected among blank samples, and it likely was the result of carryover contamination. Second, with the exception of chloramben, all of the analytes detected in replicates were found in at least one other environmental sample. Third, the method of setting the RL is designed to minimize false positives (quantifying an analyte when it is not present in the water); however, the tradeoff is that false negatives can be relatively common near the RL (Childress and others, 1999).
Pesticide recoveries from spiked samples of environmental water were compared to pesticide recoveries from laboratory-spiked organic-grade blank water samples, which routinely are conducted by NWQL (available online at http://bqs.usgs.gov/OBSP/). The range of recoveries from spiked environmental water was within the range of recoveries observed in samples of laboratory-spiked blank-water analyzed between February 1999 and December 2001 (fig. 3). The only anomalous recovery among the spiked environmental samples was for 1-naphthol from a sample spiked at South Drain on July 13, 2000. In this sample, the recovery of 100‑percent 1-naphthol stands in stark contrast to three other spiked-environmental samples in which only 5–10 percent of the 1-naphthol was recovered. It also is atypical of laboratory-spiked blank water, which had a median recovery of 25 percent from 2001–03. The cause for the anomalously good recovery is unexplained.
Nearly one-half (48 percent) of all spike recoveries were within 20 percent of the spiked concentration, and 83 percent of the spike recoveries were between 50 percent and 200 percent of the spiked concentration (fig. 4). Seventy-one percent of the spiked samples had recoveries of less than 100 percent, indicating that, taken as a whole, environmental-pesticide concentrations likely are to be slightly higher than reported by the laboratory. The degree to which pesticide concentrations might be lower than reported is modest—only 5 percent of the spiked samples had recoveries exceeding 150 percent and fewer than 2 percent of samples had recoveries exceeding 200 percent. Although a small percentage is affected by substantial overrecovery, there are three pesticides of moderate to high use in this group: azinphos-methyl, carbofuran, and terbacil. Most spike recoveries for these pesticides fall within the range of 50–200 percent and are not always overestimated. They are subject to occasional erratic recoveries for reasons that are not clear.

![]() U.S. Department of the Interior | U.S. Geological Survey
U.S. Department of the Interior | U.S. Geological Survey
URL: https://pubs.usgs.gov/sir/2007/5180
Page Contact Information: Publications Team
Page Last Modified: Thursday, 01-Dec-2016 19:52:06 EST
