Scientific Investigations Report 2007–5185
U.S. GEOLOGICAL SURVEY
Scientific Investigations Report 2007–5185
The Willamette temperature TMDL quantified the cumulative heating effects of a set of 27 point-source discharges to the Willamette River and selected tributaries, set maximum heat-loading limits for each, and provided for the potential trading of such heat-load allocations, among other things. The TMDL did not provide any tools or spatially linked quantifications of individual point-source heating effects, however, that might be used to assess potential point-source heat-allocation trades. To assess the efficacy of such trades, the Willamette flow and temperature models were used in this investigation to determine individual “heating signatures” for each of the 27 modeled point sources listed in table 1. Those signatures then were used to create a screening tool in which the magnitude of the heating signature for each point source can be increased or decreased to simulate the effects of potential changes in point-source heat-load allocations. The aim of the screening tool was to facilitate the evaluation of point-source to point-source heat-allocation trading.
The heating signature for each point source was determined by running the Willamette temperature models under the TMDL’s NTP baseline conditions, but with the addition of that single point source at its maximum wasteload allocation under the TMDL. The model results then were processed as described in the section “Methods” to obtain the 95th percentile of the 7dADM temperature differences caused by that point source; that 95th percentile as a function of downstream distance is the point source’s heating signature. The process was repeated with each of the 27 point sources to determine each of the 27 heating signatures. A spreadsheet-based screening tool was created to add the heating signatures together and thereby estimate the cumulative heating effects of all modeled point sources.
The summation of individual point-source heating signatures by the screening tool is only valid in predicting the cumulative point-source heating effect if the temperature changes that result from each point source are largely independent of one another. The temperature changes caused by many of these point sources, however, do not completely dissipate by the time a downstream point source adds its heat to the river. To the extent that an upstream point source increases the temperature of the river at the location of a downstream point-source discharge, the temperature increase caused by the downstream source is slightly less than it would be in the absence of the upstream source. Therefore, the individual point sources are not completely independent, and the summation of the individual point-source heating signatures will not be a completely accurate prediction of the cumulative temperature effect of all point sources if they were modeled together; instead, the sum is likely to be slightly larger.
The magnitude of this point-source dependence problem diminishes as the temperature change associated with each point source decreases. Given that the point sources included in this investigation all have discharge flows that are small relative to the flow in their respective receiving streams, and that the temperature increases caused by each point source also are small (typically less than a few tenths of a degree Celsius), the point-source dependence problem also is likely small. Indeed, the effect was estimated for this investigation using a range of point-source flows (as much as 1/50th of the receiving stream’s flow) and a range of independent point-source temperature increases (as large as 0.2°C). Under these conditions, the point-source dependence error is only on the order of a few thousandths of a degree Celsius. This error is small compared to the actual discrepancy between the sum of the individual point-source heating signatures and the cumulative temperature increase as predicted by a model run with all point sources included (fig. 2). Most of the observed error in using the sum of the point-source heating signatures, then, is not a result of point-source dependence issues.
The summation of the point-source heating signatures is complicated by the fact that each signature is defined as a 95th percentile, and such percentiles from separate data distributions are only additive under certain conditions. This problem is illustrated in figure 3, in which two data distributions were added together in two different ways. In that figure, distributions A and B are normal distributions with means of 0.15 and 0.10, respectively, and identical standard deviations of 0.03. Distributions C and D represent the “random sum” and the “ranked sum” of A and B, respectively. The random sum is defined as the sum of members of distributions A and B, chosen randomly. In contrast, the ranked sum was created by first ranking the members of A and B, pairing them according to their ranks, and then adding them together. Statistical methods dictate that the standard deviation of the random sum, distribution C, is the square root of the sum of the variances of the distributions being added, giving a value of 0.042. In contrast, the standard deviation of the ranked sum, distribution D, is simply the sum of the standard deviations of A and B, resulting in a value of 0.06. Regardless of whether the distributions are normal, the fact remains that the ranked sums produce a wider distribution, and therefore have larger 95th percentiles than those resulting from the random sum. One particularly useful result is that the 95th percentile of the ranked sum distribution is exactly equal to the sum of the 95th percentiles of distributions A and B.
The example using ranked and random sums illustrates that 95th percentiles from many datasets are only additive when the members of those datasets are tied together with similar ranks. Heating signatures from different point sources, therefore, may be added together only if the temperature changes caused by each of the point sources are not random, but “synchronized” with one another. So, in order for the sum of the heating signatures to be a good prediction of the results from a single model run that includes all point sources together, the modeled temperature change resulting from each point source can not be random relative to those that result from other point sources. The temperature change caused by a point-source discharge is determined by a number of factors, but streamflow and weather conditions are prime influences, and those flow and weather conditions are likely to be similar across the entire model domain. Therefore, when any one point source is modeled to have its greatest heating effect on the river, it is likely that all other point sources also have large, if not their largest, heating effects on the river. In this way, the point-source heating effects are somewhat synchronized rather than random, and their heating signatures, though they are defined as 95th percentiles, probably can be added together without incurring a large amount of predictive error.
Despite the fact that the point-source heating effects are largely synchronized, the sum of the 27 point-source heating signatures is slightly larger than the 95th percentile of temperature increases resulting from a single model run containing all 27 point sources (fig. 2). The difference probably is because the heating effects from each point source are not completely synchronized in time with those from other point sources. The flow conditions that occur at each point-source discharge location have similar seasonal and annual patterns, but may not conform to exactly the same patterns because of the influence of varying releases from upstream dams. Therefore, the heating effects of point sources that discharge to the Willamette River upstream and downstream of the McKenzie River confluence are affected by slightly different patterns in streamflow, which contributes to the difference shown in figure 2.
The sum of the 27 heating signatures may be slightly larger than the results from one model run containing all point sources, but the difference is small enough that a correction factor can be formulated to adjust each of the heating signatures until the sum of all signatures is exactly equal to the results from that one model run. The formulation of the correction factor must be relatively simple and defensible, and yet still produce the desired result. One simple and logical way to adjust the heating signatures is to decrease each by a certain percentage, where the percentage varies as a function of location along the river because the required adjustment, as a percentage of the model results, also varies across the model domain. This adjustment by itself, however, is not enough because the sum of the heating signatures also needs to collapse to a single heating signature if all but one point source is removed from the analysis. If the percentage adjustment still remains in that case, then the prediction would be too low. So, the correction factor needs to include not only a factor that causes a percentage decrease, but also a second term that causes the correction factor to gradually be eliminated as any one point-source heating signature becomes the dominant member of the sum.
In addition to the correction factors, each heating signature was assigned a corresponding “strength factor” for use in the screening tool. The strength factor is simply a multiplicative factor that is used to linearly vary the magnitude of a particular heating signature. A strength factor of 1.0 leaves the point source at its full wasteload allocation as specified in the Willamette temperature TMDL. A strength factor of 0.0 has the effect of removing that point source from the river. A strength factor of 0.5 cuts its effect in half, and a factor of 1.5 increases its effect by 50 percent. The strength factor may be thought of as a modification to its allowable flow, without a change in its temperature.
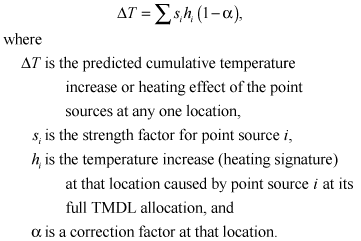
Accounting for the strength factors and correction terms, the resulting framework for the screening tool is manifested in the following equations. The sum of the heating signatures, multiplied by their strength factors and adjusted by a correction factor results in a prediction of the cumulative heating effect caused by the point sources:
 (1)
(1)
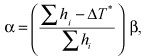
The correction factor is defined by:
 (2)
(2)
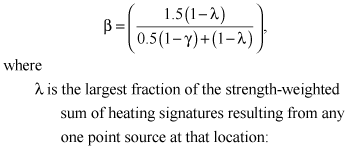
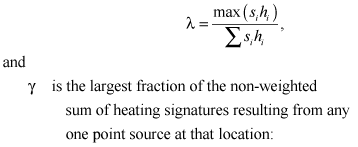
where ∆T* is the cumulative point-source temperature increase (heating effect) as calculated from one model run containing all point sources at their full TMDL heat-load allocations. The term in parentheses is a fractional adjustment and is the same for each point source, but varies by location. The second factor in that equation, β, also varies with location and is the term that causes the correction factor to become zero when any one point source dominates the strength-weighted sum of heating signatures; it is defined with the following asymptotic formula:
 (3)
(3)
 (4)
(4)
 (5)
(5)
Formulated in this way, the β factor is near 1.0 under most conditions and quickly decreases toward 0.0 whenever any one point source begins to dominate the strength-weighted sum of heating signatures. This means that the adjustment factor α typically is equal to a simple percentage reduction and is only eliminated when the strength-weighted sum of heating signatures approaches the strength-weighted signature from just one point source.
A spreadsheet-based screening tool was created to calculate the sum of the 27 adjusted and strength-weighted point-source heating signatures. This screening tool, termed the “Willamette Point-Source Heat-Trading Tool” or just the “Trading Tool” for short, was crafted to allow resource managers, city engineers, plant operators, and regulators to quickly and accurately evaluate the thermal effects of potential heat-allocation trades among the point sources regulated by the Willamette temperature TMDL. By simply selecting a target time period and modifying the strength factors associated with each point source in an iterative fashion, potential trades can be defined and the effects on the temperature of the river can be estimated. The latest version of the Trading Tool may be downloaded from the project website; the website address is listed in section, “Supplemental Material.”
The Trading Tool not only calculates the sum of the strength-weighted point-source heating signatures, but also provides graphs of the results and several types of metrics that might be useful in evaluating potential trades. Graphs include the predicted 7dADM temperature difference that results from point sources as a function of river mile along the Coast Fork Willamette, McKenzie, and Willamette Rivers, with a comparison to the TMDL’s fully allocated condition, as well as the difference between the two. The tool also includes a graph showing the contribution of each point source to the total 7dADM temperature difference, and a cumulative frequency plot showing the distribution of 7dADM temperature differences for the potential trade compared to the fully allocated condition.
Several metrics are calculated by the Trading Tool to assist in evaluating the effects of a potential trade. A set of screening criteria are evaluated, one for each of several subreaches of the modeled domain. These criteria help to determine whether the potential trade would cause the temperature to increase above the level that occurred at any of the local points of maximum impact (POMI) for the fully allocated condition. Presumably, if the magnitude of the cumulative point-source heating effect at any POMI is estimated to increase to a level that is higher than what was modeled for the TMDL under fully allocated conditions, then that trade might not be desirable. In addition to these screening criteria, the number of miles of river that are expected to be heated or cooled by certain amounts as a result of the trade is quantified. Lastly, an integrated heating or cooling effect for the river and several subreaches is calculated. This overall heating or cooling effect is quantified in terms of “degree-miles,” where one degree-mile is equivalent to a change in temperature of one degree over the entire length of one mile of river. This metric is useful in providing an overall measure of the heating or cooling effect of the trade, regardless of any localized temperature changes.
Finally, the changes in point-source heat-load allocations are quantified by the Trading Tool in a set of tables that mirrors the wasteload allocations provided in the TMDL. For each point source, one or two tables show that source’s maximum allowable heating effect both in terms of a change in temperature of the receiving stream, and as an added heat load in millions of kilocalories per day; each of these measures is a function of the flow in the river. These tables may prove to be particularly useful to permit writers and to engineers and planners that need to quantify a potential trade in units that they can measure or calculate.
The patterns in the predicted cumulative point-source temperature effects can be explained primarily by the locations of point-source and tributary inflows. The 7dADM temperature difference usually increases where a point-source discharge is located (the upward-pointing triangles in figure 2, for example). The magnitude of the increase depends on several factors such as the size of the point source, the flow in the river at that location, and the temperature of both the river and the point-source discharge. Tributary inflows (table 2) are notable particularly where they cause the 7dADM temperature difference to decrease in response to additional flow that dilutes upstream point-source heating effects; this is the case for the inflows of the Row River (RM 206.5), the Middle Fork Willamette (RM 186.3), and the Santiam River (RM 108.5). The McKenzie River inflow at RM 174.9, though it contributes a large flow to the Willamette River, shows an increase in the 7dADM temperature difference in figure 2; this results from the presence of a point source on the McKenzie River upstream. Downstream of point-source inflows, the 7dADM temperature difference typically diminishes slightly with downstream distance as the river dissipates some of the heat from the point sources to the atmosphere.
A few anomalies do not follow this pattern of point-source heating, downstream heat dissipation, and tributary dilution. A small increase and decrease in the 7dADM temperature difference, a “hump” in the pattern, occurs between roughly RMs 150 and 160. This anomaly, which does not coincide with any point-source or tributary inflow, has more than one potential explanation. First and most likely, it may be caused by the fact that point-source temperatures often are relatively constant while receiving water temperatures can vary over the course of a day. Any increase in river temperature at the point-source’s discharge location, therefore, also varies and is greatest when the receiving water temperature is at its daily minimum. This increased daily minimum water temperature at the point of discharge then can result in an increased daily maximum water temperature at a location approximately one-half day of travel time downstream. This effect can only occur when the receiving stream has a sufficiently large daily variation in its water temperature at the point of discharge, thus making it a transient anomaly. In this case, the anomaly between RMs 150 and 160 is indeed approximately one-half day of travel time downstream of the Metropolitan Wastewater Management Commission (MWMC) point source at RM 177.9, and the anomaly is associated primarily with that point source’s heating signature.
A second possible explanation is that this anomaly was caused by a slight change in travel time associated with the MWMC and possibly the Weyerhaeuser Springfield (McKenzie River) point sources upstream. Downstream of dams that release relatively constant flows and temperatures, the daily maximum temperature of a river tends to exhibit a nodal pattern with downstream distance, where the nodes are spaced at intervals of approximately one day of travel time (Lowney, 2000). The introduction of point sources changes the travel time and therefore the distance between nodes. When the 7dADM temperature results of two model runs are subtracted, this change in the nodal pattern causes some interesting patterns to appear downstream of the larger point sources. ODEQ staff tried to remove all such travel-time artifacts by artificially withdrawing flow from the river upstream of each point source, but it is possible that not all of the travel-time artifacts were completely eliminated.
The “hump” in the 7dADM temperature difference between RMs 200 and 205 might be another anomaly caused by travel-time changes or daily variations in heating effects associated with an upstream point source. The hump also could be a numerical modeling artifact caused by the large change in temperature that occurs just upstream; slight numerical anomalies just downstream of abrupt changes in temperature are not uncommon in numerical model predictions, though improvements in numerical solution techniques in CE-QUAL-W2 have minimized or eliminated most such artifacts.
A screening tool such as the Trading Tool is only useful if it can be shown to be accurate in its predictions. To test the tool’s predictions, four test cases were created and evaluated with the Trading Tool. Then, the exact same conditions were simulated with the Willamette flow and temperature models. By comparing the results, the error associated with the Trading Tool estimates can be quantified. The Trading Tool is envisioned to be used only as an easy-to-use screening tool to quickly define potentially useful point-source heat-allocation trades. Each identified trade, then, can be evaluated with the Willamette River flow and temperature models. Only if the Trading Tool predictions are shown to be accurate over a wide range of conditions might its predictions be used without verification; at this time, verification runs with the full suite of models is still advisable.
The first test case postulates a purely hypothetical heat trade between three point sources in the upper Willamette River. In this trade, MWMC’s allocation is decreased by 50 percent by setting its strength factor in the Trading Tool to 0.5. In concert with this heat-load decrease, the screening tool shows that the heat-load allocations for the cities of both Corvallis and Albany might be increased by 50 percent; their strength factors were both set to 1.5. All other strength factors were kept at 1.0 to represent their fully allocated condition under the TMDL. This test case was modeled with the full suite of flow and temperature models by simply changing the modeled flow for each of these three point sources; each was changed by multiplying their point-source flow time series by each source’s strength factor, but leaving the temperature associated with each source unchanged. Time-of-travel offset withdrawals also were adjusted for each of these point sources, as in the TMDL model runs. The resulting comparison shows that, for this test case, the Trading Tool predictions agree with the model results to within 0.005°C, with a mean error of 0.001°C and a mean absolute error of 0.002°C (fig. 4, table 3). Mean error is a measure of bias in the predictions, and the mean absolute error may be thought of as a typical error associated with any point along the river. Given the magnitude of the temperature changes being modeled, these errors seem small enough to be acceptable.
Test case 2, also hypothetical, involves four point sources upstream of the Santiam River confluence. In this test case, Cottage Grove no longer discharges to the Coast Fork Willamette River and MWMC removes its discharge from the Willamette River (each strength factor = 0.0). Because of this decrease in heat inputs upstream, the cities of Corvallis and Albany are able to increase their heat discharges, in this case by factors of 2.0 and 3.0, respectively. These strength factors were set in the Trading Tool to estimate the cumulative point-source heating effect. The Willamette flow and temperature models also were run to determine the result of this change in point-source discharges; the flows of the point sources were modified while the temperature of those sources were left unchanged. A comparison of the results of the models to the predictions of the Trading Tool shows that the Trading Tool’s predictions were fairly accurate, with a mean error of -0.002°C and a mean absolute error of 0.002°C (fig. 5, table 3). The tool’s predicted patterns of 7dADM temperature effects generally were within 0.005°C of the model results. The match was not quite as accurate in the 15 miles or so downstream of the McKenzie River confluence (RM 174.9), probably due to the different flow conditions that affect the point sources discharging to the McKenzie River versus those along the Willamette River.
In test case 3, the predictions of the Trading Tool were tested for sources located in the middle Willamette subreach. Again, Cottage Grove’s flow was removed from the river (strength factor set to 0.0). The city of Salem’s discharge was scaled back by 20 percent (strength factor = 0.8). Then, the heat-load allocations for the cities of Newberg and Wilsonville were doubled (strength factor = 2.0). The Willamette flow and temperature models were used to assess this new condition by changing the point-source flows as before. For this test case, the Trading Tool predicted the change in temperature conditions along the Willamette River quite well, with a mean error of -0.001°C and a mean absolute error of 0.001°C (fig. 6, table 3). The screening tool’s prediction errors in this case were well within ±0.005°C for the entire model domain.
For hypothetical test case 4, the Cottage Grove WWTP effluent was removed from the river, and Weyerhaeuser Springfield traded some of its heat-load allocation with the Weyerhaeuser Albany plant downstream. The Springfield plant reduced its load by one-half (strength factor = 0.5), thus allowing the Albany plant to double its load (strength factor = 2.0). The flow and temperature models were run with the modified point-source and travel-time offset flows; the results are compared to the predictions of the Trading Tool in figure 7, with error statistics listed in table 3. For this test case, the mean error and the mean absolute error for the tool’s predictions were -0.003°C and 0.003°C, respectively. In this case, the Trading Tool accurately predicted the modified patterns in the cumulative point-source heating effects, but the predictions were biased very slightly negative for most of the length of the Willamette River. This inaccuracy is small (less than 2 percent), however, compared to the types of temperature differences being modeled, so the predictions of the Trading Tool still appear to be reliable in this case.
On the basis of these four hypothetical test cases, the Trading Tool predictions are sufficiently accurate to be useful in its intended purpose as a tool for screening potential point-source heat-allocation trades. The tool’s prediction errors typically are within ±0.005°C, which is small compared to both the calculated cumulative point-source heating effects of the TMDL and the typical changes in 7dADM temperature patterns associated with many potential trades. Though it appears that the Trading Tool is both accurate and reliable in its predictions, a verification of all potential point-source heat-allocation trades with the full suite of Willamette River flow and temperature models is still advised.

![]() U.S. Department of the Interior | U.S. Geological Survey
U.S. Department of the Interior | U.S. Geological Survey
URL: https://pubs.usgs.gov/sir/2007/5185
Page Contact Information: Publications Team
Page Last Modified: Thursday, 01-Dec-2016 19:50:21 EST
