Scientific Investigations Report 2007–5239
U.S. GEOLOGICAL SURVEY
Scientific Investigations Report 2007–5239
Project quality-control data are shown in table A1. Geochemical data collected from sediments beneath the Little Deschutes River during October 2000 (Morgan and others, 2007) are shown in table A2.
River discharge was measured, and chemistry data were collected, at five sites along the Little Deschutes River during low-flow conditions October 9–10, 2006 and are listed in table A3 and shown in figure A1. For these discharge measurements, tributary inflows along the studied reaches accounted for less than 0.2 ft3/s. Water samples were collected using isokinetic, depth-integrated, equal-width-increment sampling methods. Collection and processing methods were those described by U.S. Geological Survey (1999). Analytical techniques used were those described by Fishman (1993) and Patton and Kryskalla (2003).
Table A1. Project quality-control data, March and October 2006.
[Standard reference samples prepared by M.C. Doyle, U.S. Geological Survey. Abbreviations: mg/L, milligram per liter; mg N/L, milligram of nitrogen per liter; μg/L, microgram per liter; ‰, per mil; NWQL, National Water Quality Laboratory; –, not collected]
| Sample type | Station No. | Date | Time | Chloride(mg/L) | Ammonium(mg N/L) | Nitrite + nitrate(mg N/L) | Iron(μg/L) | δ15N-NO3-(‰) | δ18O-NO3-(‰) |
|---|---|---|---|---|---|---|---|---|---|
| Replicate | 434212121295203 | 10-02-06 | 1800 | 6.14 | <0.04 | 1.57 | 296 | – | – |
| Replicate | 434212121295203 | 10-02-06 | 1801 | 6.18 | <.04 | 1.56 | 287 | – | – |
| Replicate | 434212121295203 | 10-02-06 | 1802 | 6.15 | <.04 | 1.55 | 302 | – | – |
| Standard deviation of replicates | .02 | – | .01 | 8 | – | – | |||
| Replicate | 435014121274900 | 03-07-06 | 1000 | – | – | – | – | 11.9 | -1.0 |
| Replicate | 435014121274900 | 03-07-06 | 1001 | – | – | – | – | 11.9 | -.7 |
| Standard deviation of replicates | – | – | – | – | .0 | .2 | |||
| Equipment blank | – | 03-01-06 | 1508 | <.20 | <.04 | <.016 | <6 | – | – |
| Standard reference sample 1 | |||||||||
| Standard concentration | – | 03-01-06 | 1603 | 5.20 | .53 | 1.00 | – | – | – |
| Reported by NWQL | – | 03-01-06 | 1603 | 5.14 | .54 | .99 | – | – | – |
| Reported concentration, as percentage of standard | 98.8 | 102 | 99 | – | – | – | |||
| Standard reference sample 2 | |||||||||
| Standard concentration | – | 03-01-06 | 1613 | 11.9 | .91 | 2.78 | – | – | – |
| Reported by NWQL | – | 03-01-06 | 1613 | 11.0 | .93 | 2.68 | – | – | – |
| Reported concentration, as percentage of standard | 92.4 | 102 | 96.4 | – | – | – | |||
| Standard reference sample 3 | |||||||||
| Standard concentration | – | 03-01-06 | 1623 | 15.4 | 1.93 | 3.06 | – | – | – |
| Reported by NWQL | – | 03-01-06 | 1623 | 14.5 | 1.86 | 2.97 | – | – | – |
| Reported concentration, as percentage of standard | 94.2 | 96.4 | 97.1 | – | – | – | |||
Table A2. Historical ground-water data for samples collected from sediments beneath the Little Deschutes River, Oregon.
[Historical data from Morgan and others, 2007. Nitrogen samples analyzed by Oregon Department of Environmental Quality, using methods described in Hinkle and others, 2007. River mile, as indicated on U.S. Geological Survey topographic maps. Depth, depth of center of screen below riverbed. Latitude and longitude: North American Datum of 1927 (NAD 27). Abbreviations: LEW, left edge of water looking downstream; mg N/L, milligram of nitrogen per liter; <, less than]
| River mile | Sample location | Depth (feet) | Latitude | Longitude | Date | Dominant river bed lithology | Nitrite+ nitrate (mg N/L) | Ammonium (mg N/L) | Hydrogen sulfide odor |
|---|---|---|---|---|---|---|---|---|---|
| 7.8 | Center of river | 1.0 | 43° 48' 6.2" | 121° 27' 10.7" | 10-27-00 | Sand | <0.005 | 0.34 | Present |
| 9.8 | Center of river | 3.0 | 43° 47' 30.2" | 121° 27' 29.1" | 10-27-00 | Sand | <.005 | 1.6 | Present |
| 12.5 | Center of river | 3.0 | 43° 46' 41.5" | 121° 28' 12.0" | 10-27-00 | Sand | .006 | .44 | Present |
| 16.7 | Center of river | 1.0 | 43° 44' 58.2" | 121° 29' 15.8" | 10-26-00 | Sand | <.005 | 1.3 | Present |
| 19.1 | Center of river | 2.0 | 43° 44' 15.8" | 121° 29' 21.4" | 10-26-00 | Sand | .071 | 2.3 | Present |
| 21.2 | Center of river | 2.0 | 43° 43' 32.5" | 121° 29' 26.8" | 10-26-00 | Sand | .006 | 2.6 | Present |
| 24.9 | One-fourth of distance across from LEW | 3.0 | 43° 42' 12.3" | 121° 29' 52.4" | 10-23-00 | Gravel | .011 | .31 | Present |
| 24.9 | Center of river | 3.0 | 43° 42' 12.3" | 121° 29' 52.4" | 10-23-00 | Gravel | 1.29 | <.02 | Absent |
| 24.9 | Three-fourths of distance across from LEW | 3.0 | 43° 42' 12.3" | 121° 29' 52.4" | 10-23-00 | Gravel | 2.73 | <.02 | Absent |
Table A3. Discharge measurements and chemical samples collected from Little Deschutes River near La Pine, Oregon, October 2006.
[Total nitrogen and field parameters on unfiltered samples; other analyses on filtered samples. Latitude and longitude: North American Datum of 1927 (NAD 27). Abbreviations: NAVD 88, North American Vertical Datum of 1988; RM, river mile, as indicated on U.S. Geological Survey topographic maps. ft3/s, cubic foot per second; mg/L, milligram per liter; μS/cm, microsiemens per centimeter at 25°C; °C, degrees Celsius; mg N/L, milligram of nitrogen per liter; mg P/L, milligram of phosphorus per liter; <, less than]
| Site | Station No. | Date | Time | Latitude | Longitude | Altitude (feet above NAVD 88) |
Instantaneous discharge (ft3/s) |
Dissolved oxygen (mg/L) |
Specific conductance (μS/cm) |
|---|---|---|---|---|---|---|---|---|---|
| RM 37.8 | 433846121352800 | 10-09-06 | 1610 | 43° 38' 45.7" | 121° 35' 28.1" | 4,235 | 30.3 | 10.2 | 55 |
| RM 32.6 | 434022121324600 | 10-10-06 | 1110 | 43° 40' 22.2" | 121° 32' 46.5" | 4,205 | 29.5 | 9.8 | 57 |
| RM 24.9 | 434212121295700 | 10-10-06 | 1340 | 43° 42' 12.4" | 121° 29' 52.4" | 4,195 | 31.1 | 10.4 | 61 |
| RM 16.0 | 434515121290200 | 10-10-06 | 1510 | 43° 45' 14.7" | 121° 29' 02.0" | 4,170 | 33.9 | 10.6 | 66 |
| RM 5.4 | 434917121270000 | 10-10-06 | 1720 | 43° 49' 16.8" | 121° 26' 59.8" | 4,165 | 36.9 | 10.3 | 68 |
| Site | Station No. | Temperature (°C) |
Chloride (mg/L) |
Ammonium (mg N/L) |
Nitrite+ nitrate (mg N/L) |
Nitrite (mg N/L) |
Total nitrogen (mg N/L) |
Orthophosphate (mg P/L) |
|---|---|---|---|---|---|---|---|---|
| RM 37.8 | 433846121352800 | 11.5 | 0.67 | <0.02 | <0.06 | <0.002 | 0.08 | 0.039 |
| RM 32.6 | 434022121324600 | 7.1 | .66 | <.02 | <.06 | <.002 | .09 | .040 |
| RM 24.9 | 434212121295700 | 8.9 | .82 | <.02 | <.06 | <.002 | .08 | .041 |
| RM 16.0 | 434515121290200 | 9.7 | .95 | <.02 | <.06 | <.002 | <.06 | .053 |
| RM 5.4 | 434917121270000 | 10.3 | 1.10 | <.02 | <.06 | <.002 | .06 | .041 |
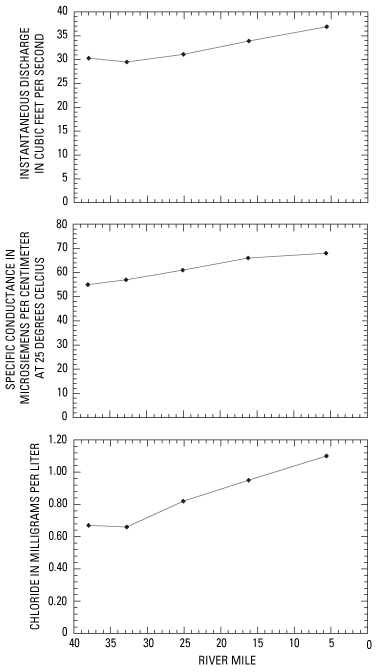
Figure A1. Spatial patterns of instantaneous discharge, specific conductance, and chloride, Little Deschutes River near La Pine, Oregon, October 9–10, 2006.

![]() U.S. Department of the Interior | U.S. Geological Survey
U.S. Department of the Interior | U.S. Geological Survey
URL: https://pubs.usgs.gov/sir/2007/5239
Page Contact Information: Publications Team
Page Last Modified: Thursday, 01-Dec-2016 19:54:39 EST
