Scientific Investigations Report 2008–5126
U.S. GEOLOGICAL SURVEY
Scientific Investigations Report 2008–5126
Flow-duration and low-flow frequency statistics can be estimated at ungaged stream sites using several methods that include (1) a drainage-area ratio relation, (2) use of miscellaneous flow measurements at the ungaged site (commonly termed a partial-record site), and (3) a regional regression equation.
The drainage-area ratio method is the preferred method for estimating low-flow statistics at an ungaged site on a stream with gaged record. However, the method generally is reliable only if the ungaged site is close to the gaged site (also know as an index station). This method is based on the assumption that the unit area runoff of the ungaged basin is the same as that for the gaged site. The equation used in this method is as follows:
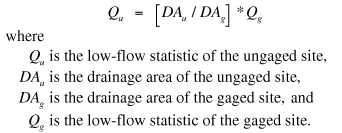 (2)
(2)
This method is often used when the ungaged site is on the same stream, upstream or downstream, of the gaged site and the drainage-area ratio of the two sites is between 0.5 and 1.5. This range of ratios has been confirmed in flood-frequency analyses in Montana (Parrett and Johnson, 2004) and Idaho (Kjelstrom, 1998; Berenbrock, 2002). Ries and Friesz (2000) determined that a range of 0.3 to 1.5 was appropriate for low-flow statistics in Massachusetts.
At a partial-record site, a series of miscellaneous streamflow measurements are collected during low-flow conditions over a period of several years. These measurements, typically a minimum of 10, are then used to develop a graphical or statistical relation with concurrent daily mean flows at nearby streamflow-gaging stations (index stations). The relation can be determined by plotting partial-record flows against flows from an index station site. Often the curve, or lack of curve, and the visual correlation of the plot can determine the appropriate method to use for estimating the low-flow statistic at the partial-record site. Riggs (1972) provides details for using the graphical estimation method. After the low-flow statistic for the index station has been plotted on the curve, the corresponding low-flow statistic for the partial-record site can be estimated by drawing a straight line from the plotted point on the curve to the partial-record site axis. Ordinary Least Squares (OLS) regression can be used to estimate the low-flow statistic for the partial-record site by fitting a line between the concurrent flow points of the partial-record site and index station. However, OLS will create a low-flow estimate that is biased because the variances of the concurrent flow measurements for the partial-record site and index station are not equal. To avoid this bias, many low-flow analyses have used the Maintenance Of Variance Extension technique (MOVE.1 and MOVE.2) (Hirsch, 1982) or the base-flow correlation method (Stedinger and Thomas, 1985). Other techniques to remove bias include MOVE.3 and MOVE.4 (Vogel and Stedinger, 1985) and the GMOVE technique (Grygier and others, 1989).
Linear multiple regression analysis is another method of estimating streamflow statistics at ungaged sites. Multiple regression is used to create equations that relate streamflow statistics of gaged sites in a region with the climatic and physical characteristics of their upstream drainage areas. Once an optimal equation has been determined, a streamflow statistic at an ungaged site can then be estimated using the relevant basin characteristics of the ungaged site.
The equation describing a linear multiple regression analysis is:
 (3)
(3)
Linear regression analysis is based on the following assumptions: (1) the mean of the residuals (ei) is zero, (2) the variance of the residuals is constant, (3) the residuals are normally distributed, and (4) the residuals are independent of each other. In addition to these assumptions, the selected independent variables (X) should have a good physical basis as predictors of the streamflow statistic. The plus and minus terms of the equation should make hydrological sense. For example, a variable such as drainage area should have a positive coefficient because an increase in drainage area should result in an increase in the streamflow statistic. The independent variables in the equation also should not be strongly correlated with each other.
In almost all regionalization studies, low-flow and peak-flow statistics, the dependent and independent datasets are skewed. As a consequence, the data needs to be transformed in order to satisfy the first assumption of having the mean of the residuals equal zero. In many studies, a logarithmic transformation is used. A base10 log-transformed multiple regression equation has the form of:
 (4)
(4)
After the coefficients have been determined through regression analysis, the equation is transformed back to its original units in a form that can be used to estimate a specific streamflow statistic at an ungaged site. The retransformed equation has the following form:
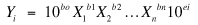 (5)
(5)
A linear regression equation provides an unbiased estimate of the mean response of the dependent variable. Although estimates provided by equation 4 are unbiased, these estimates are in log units and estimates in the original units are needed. Estimates from equation 5 are in the original units. However, this equation predicts the median, instead of the mean, response of the dependent variable. A streamflow statistic based on a median response creates an estimate that is biased and tends to be lower than the mean (Ries and Friesz, 2000). Bias correction factors (BCF) have been used in some studies to remove the bias from the estimate (Ries, 1994; Ries and Friesz, 2000; Flynn, 2003). The specific BCFs that were used in this study are discussed in section, “Bias Correction Factors.”
In regression analysis, a least-squares method can be used to estimate the equation coefficients. The coefficients are determined after minimizing the sum of the squared differences of the measured and predicted Y values. Ordinary-least-squares (OLS) regression assumes that each data vector in the analysis is providing equal information to the equation. All data vectors are then given an equal weight in determining the equation coefficients through minimizing the sum of the squared errors. In a flow regionalization study, streamflow-gaging stations (data vectors) are not providing equal information because streamflow statistics computed from stations with long records generally are more accurate than those computed from stations with short records. The stations also are not entirely independent from each other even though independence is one of the assumptions of linear regression analysis. Station flow records are sometimes spatially correlated because of similar climatic and physical basin characteristics. High spatial correlation can result in an over-representation of information from those stations. Weighted-least-squares (WLS) and generalized-least-squares (GLS) regression are two methods used to provide an appropriate weight for each data vector (streamflow-gaging station) in the analysis. Tasker (1980) developed a WLS method for peak-flow and low-flow frequency applications that computes weights based on the flow-record length and the variance of the annual peak flows or 7-day low flows of each streamflow-gaging station. The GLS method computes station weights based on record length, variance, and spatial cross-correlation (Tasker and Stedinger, 1989). The application of the GLS method in this study is discussed in more detail in section, “Generalized Least Squares Regression Analysis.”

![]() U.S. Department of the Interior | U.S. Geological Survey
U.S. Department of the Interior | U.S. Geological Survey
URL: http://pubs.usgs.gov/sir/2008/5126
Page Contact Information: Publications Team
Page Last Modified: Thursday, 10-Jan-2013 18:52:42 EST
